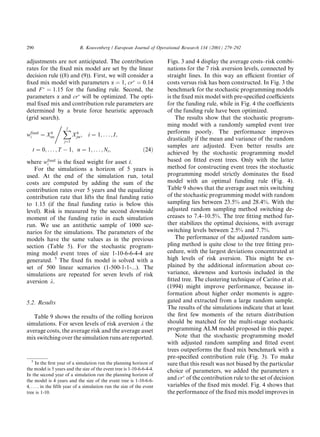
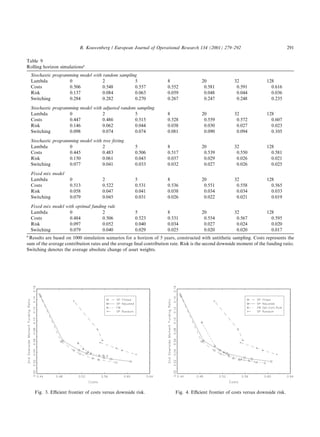
SlideShare a Scribd company logo
1 of 14
Download to read offline
Scenario generation and stochastic programming models for asset
liability management q
Roy Kouwenberg
Econometric Institute, Erasmus University Rotterdam, P.O. Box 1738, 3000 DR Rotterdam, The Netherlands
Abstract
In this paper, we develop and test scenario generation methods for asset liability management models. We propose a
multi-stage stochastic programming model for a Dutch pension fund. Both randomly sampled event trees and event
trees ®tting the mean and the covariance of the return distribution are used for generating the coecients of the sto-
chastic program. In order to investigate the performance of the model and the scenario generation procedures we
conduct rolling horizon simulations. The average cost and the risk of the stochastic programming policy are compared
to the results of a simple ®xed mix model. We compare the average switching behavior of the optimal investment
policies. Our results show that the performance of the multi-stage stochastic program could be improved drastically by
choosing an appropriate scenario generation method. Ó 2001 Elsevier Science B.V. All rights reserved.
Keywords: Stochastic programming; Finance; Asset liability management; Scenarios
1. Introduction
In this paper, we develop and test scenario
generation methods for asset liability management
models. As an application we consider the ®nan-
cial planning problem of a large Dutch pension
fund. The planning horizon of most pension funds
stretches out for decades, as a result of the long
term commitment to pay bene®ts to the retirees.
However, funds should also reckon with short
term solvency requirements. The trade-o€ between
long term gains and short term losses should be
made carefully, while anticipating future adjust-
ments of the policy. This setting therefore seems to
be suited for a stochastic programming approach
with dynamic portfolio strategies. Stochastic pro-
gramming models have been applied to ®nancial
planning problems by Carino et al. (1994),
Consigli and Dempster (1998), Golub et al. (1995),
Kusy and Ziemba (1986) and Mulvey and Vla-
dimirou (1992).
In this paper, we propose a stochastic pro-
gramming model for asset liability management
for pension funds based upon Carino et al. (1994)
and Dert (1995). We investigate the topic of
European Journal of Operational Research 134 (2001) 279±292
www.elsevier.com/locate/dsw
q
Research partially supported through contract ``HPC-
Finance'' (no. 951139) of the European Comission. Partial
support also provided by the ``HPC-Finance'' partner institu-
tions: Universities of Bergamo (IT), Cambridge (UK), Calabria
(IT), Charles (CZ), Cyprus (CY), Erasmus (ND), Technion (IL)
and the ``Centro per il Calcolo Parallelo e i Supercalcolatori''
(IT).
E-mail address: kouwenberg@few.eur.nl (R. Kouwenberg).
0377-2217/01/$ - see front matter Ó 2001 Elsevier Science B.V. All rights reserved.
PII: S 0 3 7 7 - 2 2 1 7 ( 0 0 ) 0 0 2 6 1 - 7
scenario generation by considering both randomly
sampled event trees and event trees that ®t the
mean and the covariance of the underlying distri-
bution in each node. We use rolling horizon sim-
ulations to measure the performance of the
stochastic programming model and the scenario
generation methods. The results are compared to a
benchmark ®xed mix model. We show that the
optimal solution of the stochastic program based
on a randomly sampled tree promises spurious
pro®ts and results in extensive asset mix switching.
A simple adjustment to the random sampling
procedure similar to Carino et al. (1994) greatly
improves the performance of the model. Even
better performance is achieved by ®tting the ®rst
few moments of the underlying distribution in
each node (H
oyland and Wallace, 1996). Only
with the latter method for constructing event trees,
the stochastic programming model dominates the
®xed mix benchmark.
2. Generating scenarios
2.1. Scenarios for the liabilities
All quantitative models considered in this pa-
per, will be applied to the planning problem of a
large Dutch pension fund. The goal of this pension
fund is to provide its participants with bene®ts
equal to 70% of their ®nal salary. The actual
bene®t payment depends on the number of years a
retiree has been building up rights, by paying
contributions to the fund. Each year the earned
rights of a participant k are determined by
Ok…t† ˆ 1:75% dk Sk…t†

100
70
PP…t†

; …1†
where dk is the number of years participant k has
been building up rights, Sk…t† the salary of the
participant at time t and PP…t† is the public pension
at time t.
If a retired participant has built up rights for 40
years (from age 25±65), then he will receive a
bene®t payment (including the public pension)
equal to 70% of his ®nal salary. To avoid depre-
ciation of this real amount, the pension fund in-
creases the bene®ts of the retirees each year with
the general increase of wages. The earned rights of
participants who have stopped building up rights
but are not yet retired are also indexed with the
wage increase. 1
However, in times of ®nancial
distress the pension fund is not obliged to pursue
these expensive adjustments.
Given the pension scheme in (1), the value of
the liabilities is now determined as the present
value of the expected bene®t payments (2). Regu-
latory authorities in the Netherlands check the
solvency requirements by comparing the liabilities
to asset value of the fund. Note that in (2) the
current earned rights are discounted. The future
increases of the earned rights due to wage in¯ation
are ignored. These expected real payments are
discounted with a constant actuarial rate of 4%, as
speci®ed by the regulatory authorities.
Lk…t† ˆ
X
1
jˆmaxf1;65 lktg
Ok…t†
1
1 ‡ r
 j
p
…j†
lkt
; …2†
where Ok…t† are the earned rights of participant k, r
the actuarial discount rate, lkt the age of partici-
pant k at time t and p
…j†
lkt
is the probability that a
person of age lkt will be alive in j years time.
To generate scenarios for the uncertain devel-
opment of the liabilities and the bene®t payments,
future values of the earned rights should be de-
termined. An important ®rst step is to estimate the
future status of the participants: how many par-
ticipants will be retired and working? The method
of Boender (1997) uses a Markov model, which
updates the status of each participant year by year
according to assumed mortality rates, retirement
rates and job termination rates. The second step is
to specify the future real wages, ignoring general
price and wage in¯ation. Using (1) and (2), the
future value of the earned rights, the real bene®ts
and the real liabilities are determined. The average
over 100 simulation runs of the Markov model has
been computed in order to estimate the expected
real values of the bene®ts and the liabilities.
1
E.g., participants who have changed jobs and are now
aliated with another pension fund.
280 R. Kouwenberg / European Journal of Operational Research 134 (2001) 279±292
2.2. Economic scenarios
The economic scenarios should provide infor-
mation about future asset returns in order to
evaluate investment policies for the pension fund.
As the scope of asset liability management is lim-
ited to long term strategic decisions, a small set of
asset classes should be sucient. Moreover, each
scenario should contain a time series of wage in-
creases in order to transform the real expected
values of the bene®ts and liabilities into nominal
values. To generate these time series, we will use a
vector autoregressive model (VAR model):
ht ˆ c ‡ Xht 1 ‡ t; t  N…0; R†;
t ˆ 1; . . . ; T; …3†
hit ˆ ln…1 ‡ rit†; i ˆ 1; . . . ; I; t ˆ 1; . . . ; T ; …4†
where I is the number of time series, rit the discrete
rate of change of variable i in year t, ht is a fI  1g
vector of continuously compounded rates, c the
fI  1g vector of coecients, X the fI  Ig matrix
of coecients, t the fI  1g vector of error terms
and R is a fI  Ig covariance matrix.
The asset classes considered in this study are
deposits, bonds, real estate and stocks. Annual
observations of the total asset returns and the
general wage increase from 1956 to 1994 are used
to estimate the coecients of the VAR model.
Table 1 displays descriptive statistics of the time
series and Table 2 displays the correlation matrix.
The speci®cation of the VAR model should be
chosen carefully, because the asset returns are
generated to implement a ®nancial optimization
model. To avoid any problems with unstable and
spurious predictability of returns, we never use
lagged variables to model the returns of bonds,
real estate and stocks in the VAR model (Table 3).
The time series of the return on deposits and the
increase of the wage level are modeled by a ®rst-
order autoregressive process. The VAR model is
estimated by the method of iterative weighted
least-squares. Table 4 displays the estimated cor-
relation matrix of the residuals. Future returns for
®nancial planning models can be constructed by
sampling from the error distribution of the VAR
model and applying the estimated equations of
Table 3. After the VAR model has been used to
generate a random sample of returns, nominal
values for the wages, the liabilities and the bene®ts
are determined by indexing the real expected val-
ues each year with the projected annual wage in-
crease. 2
3. Asset liability management
3.1. Costs, risk and stability
As pointed out, we consider a pension fund that
provides a de®ned bene®t pension scheme to its
retirees. To fund this pension scheme, the plan
sponsor each year pays a contribution to the fund.
Next the pension fund has to decide how to invest
these contributions, in order to meet short term
solvency requirements and to ful®ll its long term
obligations. Therefore, the goal of asset liability
management for pension funds is to ®nd a
Table 1
Statistics, time series 1956±1994a
Mean S.D. Skewness Kurtosis
Wages 0.061 0.044 0.434 2.169
Deposits 0.055 0.025 0.286 2.430
Bonds 0.061 0.063 0.247 3.131
Real estate 0.081 0.112 )0.492 7.027
Stocks 0.102 0.170 0.096 2.492
a
Wages is the rate of change of the Dutch general wage level.
The time series deposits is based on the average of the 3-month
borrowing rate for government agencies. In each year a pre-
mium of 0:5% has been subtracted, because the pension fund
will have to lend cash to commercial banks. The asset class
bonds represents the total return of a roll-over investment in
long term Dutch government bonds. Real estate consists of
total returns of the property fund Rodamco. Due to some
outliers speci®c to this fund in 1993 and 1994, the time series
has an exceptionally high kurtosis. Stocks is the total return of
the internationally diversi®ed mutual fund Robeco. All time
series were provided by Ortec Consultants.
2
At this moment the commercial system of Ortec cannot
generate scenarios in the tree-shaped structure, needed to
implement multi-stage stochastic programming models. There-
fore, some small sacri®ces in the modeling process had to be
made. Ideally, the Markov model should generate the wages,
the bene®ts and the liabilities conditionally for each set of
economic projections.
R. Kouwenberg / European Journal of Operational Research 134 (2001) 279±292 281
investment policy and a contribution policy. One
might argue that the level of the contributions is
not controlled by the pension fund, but by the plan
sponsor and the participants instead. However, the
¯exibility of the contribution rates determines the
capability of the pension fund to deal with huge
losses on the asset portfolio. Restricted contribu-
tion policies will limit the amount invested in risky
assets, if the pension fund wants to keep up with
the solvency requirements. In our opinion, this
interdependence between the contribution policy
and the investment policy should be modeled ex-
plicitly to provide valuable insight.
In the Netherlands, contributions to the pen-
sion fund are usually a ®xed percentage of the
wage of each participant. We refer to this per-
centage as the contribution rate. In practice a steep
increase of the contribution rate should be avoi-
ded, as this would immediately decrease the pro®ts
or income of the plan sponsor. Due to this reluc-
Table 3
Coecients of the VAR-modela
ln…1 ‡ wagest† ˆ 0:018 + 0:693 ln…1 ‡ wagest 1† ‡ e1t r1t ˆ 0:030
…2:058† …5:789†
ln…1 ‡ depositst† ˆ 0:020 + 0:644 ln…1 ‡ depositst 1† ‡ e2t r2t ˆ 0:017
…2:865† …5:448†
ln…1 ‡ bondst† ˆ 0:058 + e3t r3t ˆ 0:060
…6:241†
ln…1 ‡ real estatet† ˆ 0:072 + e5t r5t ˆ 0:112
…4:146†
ln…1 ‡ stockst† ˆ 0:086 + e6t r6t ˆ 0:159
…3:454†
a
Estimated with interative weighted least-squares, annually 1956±1994, t-statistics in parentheses. For the purpose of generating
plausible scenarios the coecient of the bond returns in the VAR model will be increased with 1:0%. Note that the average total return
of bonds is quite low in the time period 1956±1994: 6:1%. This is partly due to the low post World-War-II interest rates, that start to
return to `regular' levels in 1956 and 1957. If these two years are excluded the average bond return increases to 6:7%.
Table 4
Residual correlations of VAR-model
Wages Deposits Bonds Real estate Stocks
Wages 1
Deposits 0.227 1
Bonds )0.152 )0.268 1
Real estate )0.008 )0.179 0.343 1
Stocks )0.389 )0.516 0.383 0.331 1
Table 2
Correlations, annually 1956±1994
Wages Deposits Bonds Real estate Stocks
Wages 1
Deposits )0.059 1
Bonds )0.127 0.259 1
Real estate 0.162 )0.053 0.360 1
Stocks )0.296 )0.157 0.379 0.326 1
282 R. Kouwenberg / European Journal of Operational Research 134 (2001) 279±292
tance to increase the contribution rates, it might
occur that the value of the assets temporarily
drops below the liabilities (underfunding). The
pension fund is allowed to built up a surplus in
order to stabilize the contribution rate, while
avoiding de®cits. To measure the variability of the
contribution rate, we use the mean absolute dif-
ference (7). To measure both the probability and
the level of de®cits we use the second downside
moment of the funding ratio (6), with the thresh-
old at 1. The funding ratio is the ratio of assets to
liabilities and therefore it seems plausible to start
measuring risk if the funding ratio is less than 1.
Finally, the average contribution rate (5) repre-
sents the costs of the pension plan. The asset lia-
bility management model for pension funds should
provide insight in the optimal trade-o€ between
these three measures, representing costs, risk and
stability.
Costs : Mcr ˆ
X
S
sˆ1
1
S
X
T
tˆ1
crts
T
!
; …5†
Risk : Dm2
ˆ
X
S
sˆ1
1
S
X
T
tˆ1
maxf0; 1 Ftsg
… †
2
T
!
; …6†
Stability : Madcr
ˆ
X
S
sˆ1
1
S
X
T
tˆ2
jcrts crt 1;sj
T 1
!
; …7†
where Mcr is the mean contribution rate, Dm2 the
second downside moment of the funding ratio,
Madcr the mean absolute di€erence of the contri-
bution rates, crts the contribution rate at the be-
ginning of year t, Fts the funding ratio at the end of
year t, T the planning horizon and S is the number
of scenarios.
3.2. Fixed mix model
In the Netherlands most pension funds use a
decision support system based on simulation and
optimization, in order to provide insight in the
planning problem and to estimate expected costs
and risk (Boender, 1997). Currently the optimi-
zation part of the decision support system uses a
®xed asset mix and a decision rule for setting
contribution rates. The ®xed mix investment
strategy assumes that the weights of the asset mix
are restored each year to pre-speci®ed target
proportions. Eqs. (8) and (9) describe a simple
decision rule for setting contributions to the
pension fund. The funding rule determines a
weighted average of the target contribution rate
cr
and the rate that restores the funding ratio to
the target level F 
. The smoothness of the dy-
namic adjustments can be controlled by the pa-
rameter a.
crts ˆ cr
‡ a zrts
… cr
†; …8†
zrts ˆ F 
… Ft 1;s†
Lt 1;s
Sts
; …9†
where cr
is the target contribution rate, zrts the
contribution rate that lifts the funding ratio to F 
,
Fts the funding ratio at the end of year t, Sts the sum
of the wages of the participants at the beginning of
year t, Lts the value of liabilities at the end of year t
and a 2 f0; 1g is the adjustment weight.
The ®xed mix model incorporates a bi-linear
constraint for determining the asset value and
could be solved by applying the global optimiza-
tion procedure of Floudas and Visweswaran
(1993). Boender (1997) uses a local search algo-
rithm to ®nd (sub-)optimal investment policies for
pension funds, while taking into account realistic
funding rules and risk measures. However, the
number of decision variables should be small, in
order to avoid overwhelming solution times. Fixed
mix models could determine dynamic investment
policies by including decision rules that change the
composition of the ®xed mix according to state
variables like the current interest rate and the ex-
pected growth of the liabilities. This approach is
used by Boender (1997) and Brennan et al. (1997).
Note that in discrete time these models could be
based on a set of independently generated sce-
narios. Each scenario is a particular path of states
from the initial time period to the planning hori-
zon (Fig. 1).
R. Kouwenberg / European Journal of Operational Research 134 (2001) 279±292 283
3.3. Stochastic programming approach
A stochastic programming model is based
upon an event tree for the key random variables
(Fig. 2). Each node of the event tree has multiple
successors, in order to model the process of in-
formation being revealed progressively through
time. The stochastic programming approach will
determine an optimal decision for each node of
the event tree, given the information available at
that point. These optimal decisions will be de-
termined without exploiting hindsight, because
there are multiple succeeding nodes. If a sto-
chastic programming model is formulated then
the optimal policy will be tailor-made to ®t the
condition of the pension fund in each state, while
anticipating the optimal adjustment of the policy
later on. Moreover, a trade-o€ between short
term and long term costs is made. Stochastic
programming models have been applied to asset
liability management by Carino et al. (1994),
Consigli and Dempster (1998), Dert (1995), Kusy
and Ziemba (1986), Mulvey and Vladimirou
(1992) and Zenios (1995).
We will now introduce a stochastic program-
ming model for asset liability management for
pension funds, based upon Dert (1995). The
model of Dert (1995) includes chance constraints
for the solvency of pension funds, which severely
complicate numerical solutions. Following Ca-
rino et al. (1994), we penalize de®cits in the
objective function to avoid these computational
diculties. The model is presented in compact
form, which means that the structure of the
event tree is not described by a set of constraints
but instead is contained implicitly in the de®ni-
tion of the model. We change the notation from
a set of scenarios s 2 f1; . . . ; Sg to the nodes of
the event tree n 2 f1; . . . ; Ntg. 3
Nt denotes the
number of nodes of the event tree at time t,
n 2 f1; . . . ; Ntg is a particular node in this set
and ^
n is the predecessor of node n at time t 1.
First a list of variables, coecients and param-
eters is provided.
De®nition of variables
Atn portfolio value at the end of year t
Xh
itn amount invested in asset class i at the
beginning of year t
Xb
itn amount bought of asset class i at the
beginning of year t
Xs
itn amount sold of asset class i at the beginning
of year t
ml
tn cash lent at the beginning of year t
mb
tn cash borrowed at the beginning of t
crtn the contribution rate at the beginning of
year t
Ztn de®cit relative to the minimum funding
ratio in year t
crend
n contribution rate at the planning
horizon needed to lift the funding
level to F end
De®nition of random coecients
Btn bene®t payments in year t
Ltn liabilities at the end of year t
Stn total wages of the participants at the begin-
ning of year t
rtn return on risky assets in year t
rl
tn lending rate in year t
rb
tn borrowing rate in year t
Fig. 2. Event tree.
Fig. 1. Linear scenario structure.
3
In an event tree a scenario represents a unique path from
the initial node up to the planning horizon.
284 R. Kouwenberg / European Journal of Operational Research 134 (2001) 279±292
3.3.1. Objective
The objective of the model is to minimize the
sum of the average contribution rates, while taking
into account the risk aversion of the pension fund
and the state of the fund at the planning horizon.
Risk aversion is modeled with a quadratic penalty
on de®cits Ztn in the objective function (second
downside moment of the funding ratio). To mea-
sure the ®nal wealth of the pension fund, the
funding ratio is restored to the target level F end
at
the planning horizon by setting the contribution
rate at crend
s . Without this ®nal contribution, end
e€ects could occur and moreover it would be dif-
®cult to compare solutions.
min
X
T 1
tˆ0
X
Nt
nˆ1
crtn
Nt
!
‡ k
X
T
tˆ1
X
Nt
nˆ1
1
Nt
Ztn
Ltn
 2
!
‡
X
NT
nˆ1
1
NT
crend
n : …10†
3.3.2. Cash balance equation
The cash balance equation speci®es that the
cash in¯ow (including borrowing, assets sold and
contributions) should be equal to the cash out¯ow
(including lending, assets bought and bene®t pay-
ments). Transaction costs on buying and selling of
assets are incorporated.
mb
tn ml
tn ‡ …1 ‡ rl
tn†ml
t 1;^
n …1 ‡ rb
tn†mb
t 1;^
n ‡ crtnStn
Btn ‡
X
I
iˆ1
…1 cs
i †Xs
itn
X
I
iˆ1
…1 ‡ cb
i †Xb
itn ˆ 0;
n ˆ 1; . . . ; Nt; t ˆ 1; . . . ; T 1; …11†
mb
01 ml
01 ‡ mini
‡ cr01S01 B01
‡
X
I
iˆ1
…1 cs
i †Xs
i01
X
I
iˆ1
…1 ‡ cb
i †Xb
i01 ˆ 0: …12†
3.3.3. Asset inventory equation
The asset inventory equation speci®es that the
amount invested in an asset class at the beginning
of a period is equal to the amount invested at the
end of the previous period adjusted for buying and
selling.
Xh
itn ˆ …1 ‡ ritn†Xh
i;t 1;^
n Xs
itn ‡ Xb
itn;
i ˆ 1; . . . ; I; t ˆ 1; . . . ; T 1;
n ˆ 1; . . . ; Nt; …13†
Xh
i01 ˆ Xini
i Xs
i01 ‡ Xb
i01; i ˆ 1; . . . ; I: …14†
3.3.4. Total asset value at the end of a period
This equation speci®es the total asset value at
the end of a period, which is used to measure
de®cits.
Atn ˆ
X
I
iˆ1
Xh
i;t 1;^
n…1 ‡ ritn† ‡ …1 ‡ rl
tn†ml
t 1;^
n
…1 ‡ rb
tn†mb
t 1;^
n;
t ˆ 1; . . . ; T; n ˆ 1; . . . ; Nt: …15†
3.3.5. Measuring de®cits and ®nal wealth
Whenever at the end of the year the funding
ratio is less than the minimum level F min
, de®cits
are measured and penalized in the objective. At the
end of the horizon the funding ratio should be
greater than F end
. The contribution rate crend
n is set
to lift the funding ratio to this target level. In this
way we avoid end e€ects and measure the ®nal
wealth of the pension fund.
De®nition of model parameters
Xini
i initial amount invested in asset class i
mini
initial cash position
crini
initial contribution rate
crlo=up
lower/upper bound of the contribution
rate
dcrlo=up
lower/upper bound of the decrease/
increase of the contribution rate
c
b=s
i proportional transaction costs on
buying/selling of asset class i
F min
minimum funding ratio
F end
target funding ratio at the planning
horizon
w
lo=up
i lower/upper bound of the weights of the
asset mix
k parameter for specifying risk aversion
R. Kouwenberg / European Journal of Operational Research 134 (2001) 279±292 285
Atn P F min
Ltn Ztn; t ˆ 1; . . . ; T;
n ˆ 1; . . . ; Nt; …16†
ATn P F end
LTn crend
n STn; n ˆ 1; . . . ; NT ; …17†
Ztn P 0; t ˆ 1; . . . ; T; n ˆ 1; . . . ; Nt;
crend
n P 0; n ˆ 1; . . . ; NT :
…18†
3.3.6. Policy restrictions for the contribution rates
The level and the change of the contribution
rate are bounded, as speci®ed by the pension fund.
crlo
6 crtn 6 crup
; t ˆ 0; . . . ; T 1;
n ˆ 1; . . . ; Nt; …19†
dcrlo
6 crtn crt 1;^
n 6 dcrup
;
t ˆ 1; . . . ; T 1; n ˆ 1; . . . ; Nt: …20†
3.4. Policy restrictions for the asset mix
The weights of the asset mix are bounded, as
speci®ed by the pension fund.
wlo
i
X
I
iˆ1
Xh
itn 6 Xh
itn 6 wup
i
X
I
iˆ1
Xh
itn;
i ˆ 1; . . . ; I; t ˆ 0; . . . ; T 1;
n ˆ 1; . . . ; Nt: …21†
4. Constructing event trees
4.1. Random sampling
In the previous section, we introduced a sto-
chastic programming model for ALM of pension
funds. The stochastic program is based upon an
event tree, describing the return distributions and
the development of the liabilities. In this section,
we will present methods to construct event trees.
First, we consider random sampling from the error
distribution of the VAR model. We applied ran-
dom sampling to construct an event tree with a
planning horizon of 5 years and a branching
structure of 1-10-6-6-4-4. This event tree has one
initial node at time 0 and 10 succeeding nodes at
time 1. Each node at time 1 has 6 succeeding nodes
at time 2; . . . ; resulting in 10  6  6  4  4 ˆ
5760 nodes at time period 5.
The stochastic programming model of the pre-
vious section has been solved with this randomly
sampled event tree as input. The borrowing and
lending variables mb
tn and ml
tn are ®xed at zero in
order to limit the number of variables. The size of
the model formulated as a compact LP-problem is:
24 614 constraints, 32 100 variables and 96 586
(0.012%) non-zeros in the constraint matrix. Due
to the exponential growth of the number of nodes
in the event tree, the number of variables and
constraints is huge. Note that the constraint matrix
is very sparse: 0.012% ®ll-in. The special structure
of the problem could be exploited by interior point
methods (Birge and Qi, 1988) or a specialized de-
composition method (Birge, 1985; Rockafellar,
1991). For the time being however, the stochastic
programming model is solved as a large LP-prob-
lem using the interior point algorithm HOPDM
(Gondzio, 1995) on a Sun Sparcstation. It takes 11
seconds to generate the sparse data-structures of
the problem with a C-code, while the solution time
of the model is 298 seconds.
The parameters of the model are displayed in
Table 5. The initial funding ratio and the initial
contribution rate are set to 1.07 and 0.12. 4
The
minimum funding ratio is 1:00. If the funding ratio
drops below this value de®cits are penalized in the
objective, with the risk aversion parameter equal
to 4. The target funding ratio at the horizon is
1:15. At the planning horizon the contribution rate
crend
s is paid to lift the funding ratio to this level.
The upper and lower bounds of the contribution
rate are set to 0:10 and 0:25. The decrease and
the increase of the contribution rate are limited by
4
If the initial contributions and the initial cash position are
added, then the funding ratio is 1:15. The initial contribution
rate is a decision variable in the stochastic programming model,
however it is ®xed at 0:12 in order to facilitate comparisons with
the ®xed mix model.
286 R. Kouwenberg / European Journal of Operational Research 134 (2001) 279±292
0:08 and 0:04. The asset weights are forced to be
in the range f0; 1g. Transaction costs of 1% are
imposed on buying and selling of assets. However,
these costs are ignored in the initial node in order
to investigate how the optimal initial asset mix
changes as a function of risk aversion.
Table 6 contains information about the optimal
solution of the stochastic programming model.
First, the initial asset mix is displayed, which is the
part of the solution that could be implemented. In
this case, the model recommends the pension fund
to invest 100% of its initial wealth in stocks. The
mean absolute change of the asset weights is
0.37%, indicating major changes in the asset mix
through time. The next part of the table shows that
the optimal objective value is 0.2294 and that the
average contribution rate equals 1.26%.
Given the excessive switching behavior, the
optimal solution should be looked at with some
suspicion. This might be explained by considering
the sparse branching structure of the event tree. At
each time period there are no more than 10 states
to represent the underlying conditional distribu-
tion of 5 time series. Moreover, these states are
sampled randomly. As a result, the mean and co-
variance matrix will not be correctly speci®ed in
most nodes of the tree. Next, in each node the
optimizer chooses an investment strategy having
the best return and downside risk characteristics
but based on limited and incorrect information.
An obvious way to deal with this problem is to
increase the number of nodes in the randomly
sampled event tree. However, the stochastic pro-
gram might become computationally intractable
due to the exponential growth rate of the tree.
Alternatively, the switching of asset weights might
be bounded by adding linear constraints to the
model. Though the solutions might appear more
reasonable in this case, the forces driving the op-
timizer remain unreasonable.
Klaassen (1998) proposes a fundamental ap-
proach to deal with arbitrage opportunities and
spurious pro®ts in stochastic programming models
for ®nancial planning. The approach of Klaassen
(1998) requires a ®ne-grained event tree without
arbitrage opportunities and a corresponding risk
neutral probability measure. The risk neutral tree is
aggregated while preserving the no-arbitrage
property. However, this method seems to ignore the
properties of the `regular' probabilities and distri-
butions. A better approach might be to increase the
eciency of the random sampling procedure by
reducing the variance of the samples. Carino et al.
(1994) use a clustering technique which shrinks a
large sample of return vectors, while ®tting the
mean and the variance exactly and preserving in-
formation about higher order moments.
4.2. Adjusted random sampling
We will now consider an adjusted random
sampling technique. Assuming an even number of
nodes, we apply antithetic sampling in order to ®t
every odd moment of the underlying distribution.
Table 6
Solution of SP model: Random samplinga
Initial asset mix Bonds Real Stocks
0.00 0.00 1.00
Switching Bonds Real Stocks
(average absolute
deviation)
0.31 0.37 0.42
Objective value 0.2294
Mean contribution rate
(Mcr)
0.0126
Downside risk (Dm2) 0.0302
MAD contribution
rates (Madcr)
0.0539
a
The parameters of the model are displayed in Table 5. The
switching behaviour of the optimal asset policy through time is
measured by the average absolute change of the asset weights.
Dm2 is the second downside moment of the funding ratio.
MAD measures the average absolute change of the contribution
rates.
Table 5
Parameters of the stochastic programming model
crini crlo
crup
dcrlo
dcrup
F ini
F end
wlo
wup
k cb
cs
0.12 )0.10 0.25 )0.08 0.04 1.00 1.15 0.00 1.00 4.00 0.01 0.01
R. Kouwenberg / European Journal of Operational Research 134 (2001) 279±292 287
For example, if there are 10 succeeding nodes then
we sample 5 vectors of error terms from the VAR
model. The error terms for the 5 remaining nodes
are identical but with opposite signs. Next the
sample points of each variable are rescaled to ®t
the variance, as in Carino et al. (1994). Table 7
displays the optimal solution of the stochastic
programming model, based upon an event tree
generated with the adjusted random sampling
method. The optimal weight of stocks is 57% and
average switching has decreased to 12.3%. Com-
pared to Table 6 the average contribution rate
jumps from 1.26% to 5.83%, while downside risk
has increased. It seems clear that reducing
the variance of a random sample and matching
the mean can greatly reduce spurious pro®ts. The
additional computational e€ort for adjusting
the random sample is negligible.
4.3. Fitting the mean and the covariance matrix
An alternative approach is to construct an
event tree that ®ts the ®rst few moments of the
underlying distribution by solving a non-linear
optimization problem (Fleten et al., 1998). The
decision variables of the optimization problem are
the returns and the probabilities of the event tree,
while the objective function and the constraints
enforce the desired statistical properties. If all
nodes of the event tree are considered simulta-
neously as in H
oyland and Wallace (1996), then it
might take longer to construct a desirable event
tree than to solve the stochastic programming
model. Therefore, we simplify the problem and
apply the tree construction method node by node
in a forward recursion, while assuming the Mar-
kov property for the timeseries. As the random
generating process for our ALM problem is a
VAR model (4), the Markov property holds.
As an example, we write down the equations for
a set of disturbances that ®t the residual covari-
ance matrix of the VAR-process R. The proba-
bilities are uniform in order to ease comparison
with random sampling. Let i 2 f1; . . . ; Ig denote a
random variable that is modeled by the VAR-
process, for example the stock index return. A
total of M succeeding nodes at time t are available
to describe the conditional distribution of these
random variables in a particular node at time
t 1. We de®ne the disturbance uim as the real-
ization in node m for the ith element of the vector
t. Eq. (22) speci®es that the average of these dis-
turbances should be zero. Eq. (23) speci®es that
the disturbances should have a covariance matrix
equal to R.
1
M
X
M
mˆ1
uim ˆ 0 8i 2 f1; . . . ; Ig; …22†
1
…M 1†
X
M
mˆ1
uimujm ˆ Rij 8i; j 2 f1; . . . ; Ig; …23†
where uim is the disturbance for random variable
i 2 f1; . . . ; Ig in node m 2 f1; . . . ; Mg.
By using this ®xed set of disturbances in each
node and applying the VAR-equation recursively,
we generate an event tree that ®ts the time-varying
conditional expectation and the covariance matrix
of the distribution. Obtaining a solution to the
non-linear system (22) and (23) might be dicult,
specially when higher order moments like skew-
ness and kurtosis are included. Like H
oyland and
Wallace (1996), we solve a non-linear optimization
model that penalizes deviations from the desired
moments in the objective function. Starting points
are randomly sampled from the underlying distri-
bution. The adjustment procedure of the previous
sections could be applied to speedup convergence.
We have applied this method to construct a ®t-
ted 1-10-6-6-4-4 event tree. All probabilities are
Table 7
Solution of SP model: Adjusted random sampling
Initial asset mix Bonds Real Stocks
0.00 0.43 0.57
Switching Bonds Real Stocks
(average absolute
deviation)
0.16 0.09 0.12
Objective value 0.5013
Mean contribution
rate (Mcr)
0.0583
Downside risk
(Dm2)
0.0375
MAD contribution
rates (Madcr)
0.0500
288 R. Kouwenberg / European Journal of Operational Research 134 (2001) 279±292
uniform in order to ease comparison with the
random sampling methods. With 4 succeeding
nodes the mean and covariance matrix are ®tted,
while with 6 or 10 succeeding nodes we also ®t the
skewness and the kurtosis.
Table 8 displays the optimal solution of the
stochastic programming model based upon the
®tted event tree. The initial asset mix now consists
of 33% stocks, 30% real estate and 37% bonds.
Average switching of asset weights has been re-
duced to 6%, while the average contribution rate
equals 6.24%. It is hard to compare the quality of
the optimal solutions based upon di€erent scenario
generation methods, by solving the ALM-model
just once. In Section 5, we will use rolling horizon
simulations to investigate the issue of constructing
event trees.
5. Rolling horizon simulations
5.1. Methodology
The previous section demonstrates that the
optimal solution of the stochastic program model
depends on the method for constructing event
trees. In order to test these methods empirically,
we now perform rolling horizon simulations. We
include a simple ®xed mix model in these test as a
benchmark for the performance of the stochastic
programming model. Golub et al. (1995) compare
stochastic programming models for money man-
agement to alternative planning models with a
similar simulation framework. Fleten et al. (1998)
use simulations for comparing the performance of
a stochastic program and a ®xed model for a life
insurance ALM problem.
The purpose of the rolling horizon simulations
is to investigate the results of implementing the
optimal decisions of a model every year. We start
by generating one path of realized returns for the
next 5 years. At time zero we solve a ®xed mix or a
stochastic programming model with a planning
horizon of 5 years. We implement the initial op-
timal decisions of the model and calculate the asset
value of the pension fund at the end of the ®rst
year. Next, the model is solved given the current
state of the pension and with a planning horizon of
4 years. The optimal initial decisions are again
implemented. This process is repeated until we
know the ®nal state of the pension at end of year 5.
By generating a large number of `realized return
paths', we can estimate the average costs and risk
of the planning model. The simulation process is
now described formally:
1. Sample a path of realized returns for the peri-
ods 1 to T. Start at the beginning of the initial
period: t ˆ 1.
2. Construct an event tree conditional on the real-
izations of the returns and the wage increase at
the end of period t 1. Solve the stochastic
programming model using this event tree and
a planning horizon of T t ‡ 1 years, given
the state of the pension fund at the end of pe-
riod t 1.
3. Use the realized returns for period t to deter-
mine the state of the pension fund at the end
of period t, if the optimal initial decisions are
implemented.
4. If t  T, then t ˆ t ‡ 1 and return to step 2.
5. Store the average contribution rate and infor-
mation about underfunding for this particular
simulation run. Return to step 1, unless the
number of simulation runs is sucient.
A ®xed mix model is included in the simulation
tests as a benchmark for the stochastic program-
ming model. The ®xed model consists of the same
equations as the stochastic programming model,
but with additional linear constraints (24) for re-
storing the asset weights to ®xed proportions every
year. As the model is solved each year the resulting
investment strategy will be dynamic, however these
Table 8
Solution of SP model: Fitted tree
Initial asset mix Bonds Real Stocks
0.37 0.30 0.33
Switching Bonds Real Stocks
(average absolute
deviation)
0.08 0.05 0.06
Objective value 0.5213
Mean contribution
rate (Mcr)
0.0624
Downside risk
(Dm2)
0.0346
MAD contribution
rates (Madcr)
0.0494
R. Kouwenberg / European Journal of Operational Research 134 (2001) 279±292 289
adjustments are not anticipated. The contribution
rates for the ®xed mix model are set by the linear
decision rule ((8) and (9)). First, we will consider a
®xed mix model with parameters a ˆ 1, cr
ˆ 0:14
and F 
ˆ 1:15 for the funding rule. Second, the
parameters a and cr
will be optimized. The opti-
mal ®xed mix and contribution rule parameters are
determined by a brute force heuristic approach
(grid search).
wfixed
i ˆ Xh
itn
X
I
jˆ1
Xh
jtn;
,
i ˆ 1; . . . ; I;
t ˆ 0; . . . ; T 1; n ˆ 1; . . . ; Nt; …24†
where wfixed
i is the ®xed weight for asset i.
For the simulations a horizon of 5 years is
used. At the end of the simulation run, total
costs are computed by adding the sum of the
contribution rates over 5 years and the equalizing
contribution rate that lifts the ®nal funding ratio
to 1:15 (if the ®nal funding ratio is below this
level). Risk is measured by the second downside
moment of the funding ratio in each simulation
run. We use an antithetic sample of 1000 sce-
narios for the simulations. The parameters of the
models have the same values as in the previous
section (Table 5). For the stochastic program-
ming model event trees of size 1-10-6-6-4-4 are
generated. 5
The ®xed ®x model is solved with a
set of 500 linear scenarios (1-500-1-1-...). The
simulations are repeated for seven levels of risk
aversion k.
5.2. Results
Table 9 shows the results of the rolling horizon
simulations. For seven levels of risk aversion k the
average costs, the average risk and the average asset
mix switching over the simulation runs are reported.
Figs. 3 and 4 display the average costs±risk combi-
nations for the 7 risk aversion levels, connected by
straight lines. In this way an ecient frontier of
costs versus risk has been constructed. In Fig. 3 the
benchmark for the stochastic programming models
is the ®xed mix model with pre-speci®ed coecients
for the funding rule, while in Fig. 4 the coecients
of the funding rule have been optimized.
The results show that the stochastic program-
ming model with a randomly sampled event tree
performs poorly. The performance improves
drastically if the mean and variance of the random
samples are adjusted. Even better results are
achieved by the stochastic programming model
based on ®tted event trees. Only with the latter
method for constructing event trees the stochastic
programming model strictly dominates the ®xed
model with an optimal funding rule (Fig. 4).
Table 9 shows that the average asset mix switching
of the stochastic programming model with random
sampling lies between 23.5% and 28.4%. With the
adjusted random sampling method switching de-
creases to 7.4±10.5%. The tree ®tting method fur-
ther stabilizes the optimal decisions, with average
switching levels between 2.5% and 7.7%.
The performance of the adjusted random sam-
pling method is quite close to the tree ®tting pro-
cedure, with the largest deviations concentrated at
high levels of risk aversion. This might be ex-
plained by the additional information about co-
variance, skewness and kurtosis included in the
®tted tree. The clustering technique of Carino et al.
(1994) might improve performance, because in-
formation about higher order moments is aggre-
gated and extracted from a large random sample.
The results of the simulations indicate that at least
the ®rst few moments of the return distribution
should be matched for the multi-stage stochastic
programming ALM model proposed in this paper.
Note that the stochastic programming model
with adjusted random sampling and ®tted event
trees outperforms the ®xed mix benchmark with a
pre-speci®ed contribution rule (Fig. 3). To make
sure that this result was not biased by the particular
choice of parameters, we added the parameters a
and cr
of the contribution rule to the set of decision
variables of the ®xed mix model. Fig. 4 shows that
the performance of the ®xed mix model improves in
5
In the ®rst year of a simulation run the planning horizon of
the model is 5 years and the size of the event tree is 1-10-6-6-4-4.
In the second year of a simulation run the planning horizon of
the model is 4 years and the size of the event tree is 1-10-6-6-
4; . . . ; in the ®fth year of a simulation run the size of the event
tree is 1-10.
290 R. Kouwenberg / European Journal of Operational Research 134 (2001) 279±292
Table 9
Rolling horizon simulationsa
Stochastic programming model with random sampling
Lambda 0 2 5 8 20 32 128
Costs 0.506 0.548 0.557 0.552 0.581 0.591 0.616
Risk 0.137 0.084 0.063 0.059 0.048 0.044 0.036
Switching 0.284 0.282 0.270 0.267 0.247 0.248 0.235
Stochastic programming model with adjusted random sampling
Lambda 0 2 5 8 20 32 128
Costs 0.447 0.486 0.515 0.528 0.559 0.572 0.607
Risk 0.146 0.062 0.044 0.038 0.030 0.027 0.023
Switching 0.098 0.074 0.074 0.081 0.090 0.094 0.105
Stochastic programming model with tree ®tting
Lambda 0 2 5 8 20 32 128
Costs 0.445 0.483 0.506 0.517 0.539 0.550 0.581
Risk 0.150 0.061 0.043 0.037 0.029 0.026 0.021
Switching 0.077 0.041 0.033 0.032 0.027 0.026 0.025
Fixed mix model
Lambda 0 2 5 8 20 32 128
Costs 0.513 0.522 0.531 0.536 0.551 0.558 0.565
Risk 0.058 0.047 0.041 0.038 0.034 0.034 0.033
Switching 0.079 0.045 0.031 0.026 0.022 0.021 0.019
Fixed mix model with optimal funding rule
Lambda 0 2 5 8 20 32 128
Costs 0.484 0.506 0.523 0.531 0.554 0.567 0.595
Risk 0.097 0.052 0.040 0.034 0.027 0.024 0.020
Switching 0.079 0.040 0.029 0.025 0.020 0.020 0.017
a
Results are based on 1000 simulation scenarios for a horizon of 5 years, constructed with antithetic sampling. Costs represents the
sum of the average contribution rates and the average ®nal contribution rate. Risk is the second downside moment of the funding ratio.
Switching denotes the average absolute change of asset weights.
Fig. 3. Ecient frontier of costs versus downside risk. Fig. 4. Ecient frontier of costs versus downside risk.
R. Kouwenberg / European Journal of Operational Research 134 (2001) 279±292 291
this case, however the stochastic programming
model with ®tted event trees still outperforms the
benchmark. At high levels of risk aversion the sto-
chastic programming model and the ®xed mix
model are quite close. This is reasonable as dynamic
investment strategies might become less important
at high levels of risk aversion (merely 3% average
asset mix switching with ®tted trees).
6. Conclusions
In this paper, we developed and tested methods
to construct event trees for ALM models. We
proposed a stochastic programming model for a
Dutch pension fund. To construct event trees for
the stochastic programming model we used ran-
dom sampling, an adjusted random sampling ap-
proach and a tree ®tting method. Rolling horizon
simulations indicate that the random sampling
approach might lead to excessive asset mix
switching and spurious pro®ts. We considered an
antithetic random sampling method that matches
every odd moment of the distribution and the
variance. The adjusted random sampling proce-
dure considerably reduced the asset mix switching
and drastically improved the performance of the
ALM model. Next we proposed a tree ®tting
technique based upon H
oyland and Wallace
(1996). The tree ®tting procedure slightly outper-
formed the adjusted random sampling technique.
Moreover, the stochastic programming ALM
model with ®tted event trees strictly dominated the
®xed mix benchmark with an optimized funding
rule. At low levels of risk aversion the dynamic
investment strategies of the stochastic program-
ming ALM model clearly resulted in a better
tradeo€ between costs and risk than the ®xed mix
ALM model.
References
Birge, J.R., 1985. Decomposition and partitioning methods for
multi-stage stochastic linear programs. Operations Research
33, 989±1007.
Birge, J.R., Qi, L., 1988. Computing block-angular Karmarkar
projections with applications to stochastic programming.
Management Science 34, 1472±1479.
Boender, G.C.E., 1997. A hybrid simulation/optimisation
scenario model for asset/liability management. European
Journal of Operational Research 99, 126±135.
Brennan, M.J., Schwartz, E.S., Lagnado, R., 1997. Strategic
asset allocation. Journal of Economic Dynamics and
Control 21, 1377±1403.
Carino, D.R., Kent, T., Myers, D.H., Stacy, C., Sylvanus, M.,
Turner, A.L., Watanabe, K., Ziemba, W.T., 1994. The
Russel±Yasuda Kasai model: An asset liability model for a
Japanese insurance company using multistage stochastic
programming. Interfaces 24 (1), 29±49.
Consigli, G., Dempster, M.A.H., 1998. Dynamic stochastic
programming for asset±liability management. Annals of
Operations Research 81, 131±161.
Dert, C.L., 1995. Asset liability management for pension funds:
A multistage chance constrained programming approach,
Ph.D. thesis, Erasmus University Rotterdam.
Fleten, S.-E., H
oyland, K., Wallace, S.W., 1998. The perfor-
mance of stochastic dynamic and ®xed mix portfolio
models. Department of Economics and Technology Man-
agement, Norwegian University of Science and Technology.
Floudas, C.A., Visweswaran, V., 1993. Primal±relaxed dual
global optimization approach. Journal of Optimization
Theory and Applications 78, 187±225.
Golub, B., Holmer, M., McKendall, R., Pohlman, L., Zenios,
S.A., 1995. A stochastic programming model for money
management. European Journal of Operational Research
85, 282±296.
Gondzio, J., 1995. HOPDM (version 2.12) ± a fast LP solver
based on a primal±dual interior point method. European
Journal of Operational Research 85, 221±225.
H
oyland, K., Wallace, S.W., 1996. Generating scenario trees
for multi stage problems. Department of Economics and
Technology Management, Norwegian University of Science
and Technology.
Klaassen, P., 1998. Financial asset-pricing theory and stochas-
tic programming models for asset±liability management: A
synthesis. Management Science 44, 31±48.
Kusy, M.I., Ziemba, W.T., 1986. A bank asset and liability
model. Operations Research 34, 356±376.
Mulvey, J.M., Vladimirou, H., 1992. Stochastic network
planning for ®nancial planning problems. Management
Science 38, 1642±1664.
Rockafellar, R.T., Wets, R.J.-B., 1991. Scenario and policy
aggregation in optimization under uncertainty. Mathemat-
ics of Operations Research 16, 119±147.
Zenios, S.A., 1995. Asset/liability management under uncer-
tainty for ®xed income securities. Annals of Operations
Research 59, 77±98.
292 R. Kouwenberg / European Journal of Operational Research 134 (2001) 279±292

More Related Content

What's hot

Generic valuation framework for insurance liabilities - August 2017 edition
Generic valuation framework for insurance liabilities - August 2017 editionGeneric valuation framework for insurance liabilities - August 2017 edition
Generic valuation framework for insurance liabilities - August 2017 editionNick Kinrade
 
Fm11 ch 09 the cost of capital
Fm11 ch 09 the cost of capitalFm11 ch 09 the cost of capital
Fm11 ch 09 the cost of capitalNhu Tuyet Tran
 
Federico Thibaud - Capital Structure Arbitrage
Federico Thibaud - Capital Structure ArbitrageFederico Thibaud - Capital Structure Arbitrage
Federico Thibaud - Capital Structure ArbitrageFederico Thibaud
 
Chapter7 an introduction to risk and return
Chapter7 an introduction to risk and returnChapter7 an introduction to risk and return
Chapter7 an introduction to risk and returnRodel Falculan
 
2010 09 the empirical law of active management
2010 09 the empirical law of active management2010 09 the empirical law of active management
2010 09 the empirical law of active managementbfmresearch
 
Bba 2204 fin mgt week 5 time value of money
Bba 2204 fin mgt week 5 time value of moneyBba 2204 fin mgt week 5 time value of money
Bba 2204 fin mgt week 5 time value of moneyStephen Ong
 
Ramsey–Cass–Koopmans model and its application in Ethiopia
Ramsey–Cass–Koopmans model and its application in EthiopiaRamsey–Cass–Koopmans model and its application in Ethiopia
Ramsey–Cass–Koopmans model and its application in EthiopiaMolla Derbe
 
15 minute lesson - capm derivation
15 minute lesson - capm derivation15 minute lesson - capm derivation
15 minute lesson - capm derivationFuturum2
 
GSB-711-Lecture-Note-05-Risk-Return-and-CAPM
GSB-711-Lecture-Note-05-Risk-Return-and-CAPMGSB-711-Lecture-Note-05-Risk-Return-and-CAPM
GSB-711-Lecture-Note-05-Risk-Return-and-CAPMUniversity of New England
 
Fm11 ch 12 real options
Fm11 ch 12 real optionsFm11 ch 12 real options
Fm11 ch 12 real optionsNhu Tuyet Tran
 
Cost of capital
Cost of capitalCost of capital
Cost of capitalSweetp999
 

What's hot (16)

Generic valuation framework for insurance liabilities - August 2017 edition
Generic valuation framework for insurance liabilities - August 2017 editionGeneric valuation framework for insurance liabilities - August 2017 edition
Generic valuation framework for insurance liabilities - August 2017 edition
 
Fm11 ch 09 the cost of capital
Fm11 ch 09 the cost of capitalFm11 ch 09 the cost of capital
Fm11 ch 09 the cost of capital
 
Federico Thibaud - Capital Structure Arbitrage
Federico Thibaud - Capital Structure ArbitrageFederico Thibaud - Capital Structure Arbitrage
Federico Thibaud - Capital Structure Arbitrage
 
Chapter7 an introduction to risk and return
Chapter7 an introduction to risk and returnChapter7 an introduction to risk and return
Chapter7 an introduction to risk and return
 
Fm5
Fm5Fm5
Fm5
 
Ch 01 slides
Ch 01 slidesCh 01 slides
Ch 01 slides
 
2010 09 the empirical law of active management
2010 09 the empirical law of active management2010 09 the empirical law of active management
2010 09 the empirical law of active management
 
Bba 2204 fin mgt week 5 time value of money
Bba 2204 fin mgt week 5 time value of moneyBba 2204 fin mgt week 5 time value of money
Bba 2204 fin mgt week 5 time value of money
 
Presentation
PresentationPresentation
Presentation
 
Ramsey–Cass–Koopmans model and its application in Ethiopia
Ramsey–Cass–Koopmans model and its application in EthiopiaRamsey–Cass–Koopmans model and its application in Ethiopia
Ramsey–Cass–Koopmans model and its application in Ethiopia
 
Risk and return
Risk and returnRisk and return
Risk and return
 
4. time value of money
4. time value of money4. time value of money
4. time value of money
 
15 minute lesson - capm derivation
15 minute lesson - capm derivation15 minute lesson - capm derivation
15 minute lesson - capm derivation
 
GSB-711-Lecture-Note-05-Risk-Return-and-CAPM
GSB-711-Lecture-Note-05-Risk-Return-and-CAPMGSB-711-Lecture-Note-05-Risk-Return-and-CAPM
GSB-711-Lecture-Note-05-Risk-Return-and-CAPM
 
Fm11 ch 12 real options
Fm11 ch 12 real optionsFm11 ch 12 real options
Fm11 ch 12 real options
 
Cost of capital
Cost of capitalCost of capital
Cost of capital
 

Similar to Stochastic programming models for asset liability management scenario generation

A Short Glimpse Intrododuction to Multi-Period Fuzzy Bond Imunization for Con...
A Short Glimpse Intrododuction to Multi-Period Fuzzy Bond Imunization for Con...A Short Glimpse Intrododuction to Multi-Period Fuzzy Bond Imunization for Con...
A Short Glimpse Intrododuction to Multi-Period Fuzzy Bond Imunization for Con...NABIH IBRAHIM BAWAZIR
 
Retirement saving with contribution payments and labor income as a benchmark ...
Retirement saving with contribution payments and labor income as a benchmark ...Retirement saving with contribution payments and labor income as a benchmark ...
Retirement saving with contribution payments and labor income as a benchmark ...Nicha Tatsaneeyapan
 
RADRmarket risk premiumLicheng This premium is taken from the.docx
RADRmarket risk premiumLicheng This premium is taken from the.docxRADRmarket risk premiumLicheng This premium is taken from the.docx
RADRmarket risk premiumLicheng This premium is taken from the.docxmakdul
 
Case Notes on MW Petroleum Corporation (A)Why Should We Care A.docx
Case Notes on MW Petroleum Corporation (A)Why Should We Care A.docxCase Notes on MW Petroleum Corporation (A)Why Should We Care A.docx
Case Notes on MW Petroleum Corporation (A)Why Should We Care A.docxwendolynhalbert
 
IAQF report_Cornell Team
IAQF report_Cornell TeamIAQF report_Cornell Team
IAQF report_Cornell TeamJin Li
 
The Effectiveness of interest rate swaps
The Effectiveness of interest rate swapsThe Effectiveness of interest rate swaps
The Effectiveness of interest rate swapsRoy Meekel
 
Chapter 9 on Valuation and Reporting in Organization
Chapter 9 on Valuation and Reporting in OrganizationChapter 9 on Valuation and Reporting in Organization
Chapter 9 on Valuation and Reporting in OrganizationFirdaus Fitri Zainal Abidin
 
Project2-SmartMoneyEffectAndMarkowitz
Project2-SmartMoneyEffectAndMarkowitzProject2-SmartMoneyEffectAndMarkowitz
Project2-SmartMoneyEffectAndMarkowitzShabai Chen
 
Tracking Variation in Systemic Risk-2 8-3
Tracking Variation in Systemic Risk-2 8-3Tracking Variation in Systemic Risk-2 8-3
Tracking Variation in Systemic Risk-2 8-3edward kane
 
Stochastic Loss Reserving-General Insurance
Stochastic Loss Reserving-General InsuranceStochastic Loss Reserving-General Insurance
Stochastic Loss Reserving-General InsuranceSyed Danish Ali
 
EAD Parameter : A stochastic way to model the Credit Conversion Factor
EAD Parameter : A stochastic way to model the Credit Conversion FactorEAD Parameter : A stochastic way to model the Credit Conversion Factor
EAD Parameter : A stochastic way to model the Credit Conversion FactorGenest Benoit
 
Designing and pricing guarantee options in de fined contribution pension plans
Designing and pricing guarantee options in defined contribution pension plansDesigning and pricing guarantee options in defined contribution pension plans
Designing and pricing guarantee options in de fined contribution pension plansStavros A. Zenios
 

Similar to Stochastic programming models for asset liability management scenario generation (20)

03_AJMS_155_18_RA.pdf
03_AJMS_155_18_RA.pdf03_AJMS_155_18_RA.pdf
03_AJMS_155_18_RA.pdf
 
03_AJMS_155_18_RA.pdf
03_AJMS_155_18_RA.pdf03_AJMS_155_18_RA.pdf
03_AJMS_155_18_RA.pdf
 
A Short Glimpse Intrododuction to Multi-Period Fuzzy Bond Imunization for Con...
A Short Glimpse Intrododuction to Multi-Period Fuzzy Bond Imunization for Con...A Short Glimpse Intrododuction to Multi-Period Fuzzy Bond Imunization for Con...
A Short Glimpse Intrododuction to Multi-Period Fuzzy Bond Imunization for Con...
 
Chronology
ChronologyChronology
Chronology
 
Retirement saving with contribution payments and labor income as a benchmark ...
Retirement saving with contribution payments and labor income as a benchmark ...Retirement saving with contribution payments and labor income as a benchmark ...
Retirement saving with contribution payments and labor income as a benchmark ...
 
Credit risk models
Credit risk modelsCredit risk models
Credit risk models
 
Loan valuation
Loan valuationLoan valuation
Loan valuation
 
RADRmarket risk premiumLicheng This premium is taken from the.docx
RADRmarket risk premiumLicheng This premium is taken from the.docxRADRmarket risk premiumLicheng This premium is taken from the.docx
RADRmarket risk premiumLicheng This premium is taken from the.docx
 
Ssrn 16 trang Eo
Ssrn 16 trang EoSsrn 16 trang Eo
Ssrn 16 trang Eo
 
Case Notes on MW Petroleum Corporation (A)Why Should We Care A.docx
Case Notes on MW Petroleum Corporation (A)Why Should We Care A.docxCase Notes on MW Petroleum Corporation (A)Why Should We Care A.docx
Case Notes on MW Petroleum Corporation (A)Why Should We Care A.docx
 
IAQF report_Cornell Team
IAQF report_Cornell TeamIAQF report_Cornell Team
IAQF report_Cornell Team
 
The Effectiveness of interest rate swaps
The Effectiveness of interest rate swapsThe Effectiveness of interest rate swaps
The Effectiveness of interest rate swaps
 
Modelling Non-Life Insurance
Modelling Non-Life InsuranceModelling Non-Life Insurance
Modelling Non-Life Insurance
 
Chapter 9 on Valuation and Reporting in Organization
Chapter 9 on Valuation and Reporting in OrganizationChapter 9 on Valuation and Reporting in Organization
Chapter 9 on Valuation and Reporting in Organization
 
Project2-SmartMoneyEffectAndMarkowitz
Project2-SmartMoneyEffectAndMarkowitzProject2-SmartMoneyEffectAndMarkowitz
Project2-SmartMoneyEffectAndMarkowitz
 
Tracking Variation in Systemic Risk-2 8-3
Tracking Variation in Systemic Risk-2 8-3Tracking Variation in Systemic Risk-2 8-3
Tracking Variation in Systemic Risk-2 8-3
 
Stochastic Loss Reserving-General Insurance
Stochastic Loss Reserving-General InsuranceStochastic Loss Reserving-General Insurance
Stochastic Loss Reserving-General Insurance
 
EAD Parameter : A stochastic way to model the Credit Conversion Factor
EAD Parameter : A stochastic way to model the Credit Conversion FactorEAD Parameter : A stochastic way to model the Credit Conversion Factor
EAD Parameter : A stochastic way to model the Credit Conversion Factor
 
Designing and pricing guarantee options in de fined contribution pension plans
Designing and pricing guarantee options in defined contribution pension plansDesigning and pricing guarantee options in defined contribution pension plans
Designing and pricing guarantee options in de fined contribution pension plans
 
Ffm905
Ffm905Ffm905
Ffm905
 

More from Nicha Tatsaneeyapan

How To Shift Consumer Behaviors to be more sustainable; a literature review a...
How To Shift Consumer Behaviors to be more sustainable; a literature review a...How To Shift Consumer Behaviors to be more sustainable; a literature review a...
How To Shift Consumer Behaviors to be more sustainable; a literature review a...Nicha Tatsaneeyapan
 
An ethical approach to data privacy protection
An ethical approach to data privacy protectionAn ethical approach to data privacy protection
An ethical approach to data privacy protectionNicha Tatsaneeyapan
 
Linkages between extreme stock market and currency returns
Linkages between extreme stock market and currency returnsLinkages between extreme stock market and currency returns
Linkages between extreme stock market and currency returnsNicha Tatsaneeyapan
 
Incentives and risk taking in hedge funds
Incentives and risk taking in hedge fundsIncentives and risk taking in hedge funds
Incentives and risk taking in hedge fundsNicha Tatsaneeyapan
 
Loss-aversion and household portfolio choice
Loss-aversion and household portfolio choiceLoss-aversion and household portfolio choice
Loss-aversion and household portfolio choiceNicha Tatsaneeyapan
 
Estimating ambiguity preferences and perceptions in multiple prior models: Ev...
Estimating ambiguity preferences and perceptions in multiple prior models: Ev...Estimating ambiguity preferences and perceptions in multiple prior models: Ev...
Estimating ambiguity preferences and perceptions in multiple prior models: Ev...Nicha Tatsaneeyapan
 
Forecasting the US housing market
Forecasting the US housing marketForecasting the US housing market
Forecasting the US housing marketNicha Tatsaneeyapan
 
Options and earnings announcements: an empirical study of volatility,trading ...
Options and earnings announcements: an empirical study of volatility,trading ...Options and earnings announcements: an empirical study of volatility,trading ...
Options and earnings announcements: an empirical study of volatility,trading ...Nicha Tatsaneeyapan
 
Early Warning Systems for Currency Crises: A Multivariate Extreme Value Appr...
Early Warning Systems for Currency Crises:  A Multivariate Extreme Value Appr...Early Warning Systems for Currency Crises:  A Multivariate Extreme Value Appr...
Early Warning Systems for Currency Crises: A Multivariate Extreme Value Appr...Nicha Tatsaneeyapan
 
Incentives and Risk Taking in Hedge Funds *
Incentives and Risk Taking in Hedge Funds *Incentives and Risk Taking in Hedge Funds *
Incentives and Risk Taking in Hedge Funds *Nicha Tatsaneeyapan
 
The effect of VaR-based risk management on asset prices and the volatility s...
The effect of VaR-based risk management on asset prices  and the volatility s...The effect of VaR-based risk management on asset prices  and the volatility s...
The effect of VaR-based risk management on asset prices and the volatility s...Nicha Tatsaneeyapan
 
Model Uncertainty and Exchange Rate Forecasting
Model Uncertainty and Exchange Rate ForecastingModel Uncertainty and Exchange Rate Forecasting
Model Uncertainty and Exchange Rate ForecastingNicha Tatsaneeyapan
 
HIGH-PERFORMANCE COMPUTING FOR ASSET-LIABILITY MANAGEMENT
HIGH-PERFORMANCE COMPUTING FOR ASSET-LIABILITY MANAGEMENTHIGH-PERFORMANCE COMPUTING FOR ASSET-LIABILITY MANAGEMENT
HIGH-PERFORMANCE COMPUTING FOR ASSET-LIABILITY MANAGEMENTNicha Tatsaneeyapan
 
Endogenous Price Bubbles in a Multi-Agent System of the Housing Market
Endogenous Price Bubbles in a Multi-Agent System of the Housing MarketEndogenous Price Bubbles in a Multi-Agent System of the Housing Market
Endogenous Price Bubbles in a Multi-Agent System of the Housing MarketNicha Tatsaneeyapan
 
Comparisons of Foreign Multinationals and Local Firms in Asian Manufacturing...
Comparisons of Foreign Multinationals and Local  Firms in Asian Manufacturing...Comparisons of Foreign Multinationals and Local  Firms in Asian Manufacturing...
Comparisons of Foreign Multinationals and Local Firms in Asian Manufacturing...Nicha Tatsaneeyapan
 
Wage differentials between_foreign_multinationals_
Wage differentials between_foreign_multinationals_Wage differentials between_foreign_multinationals_
Wage differentials between_foreign_multinationals_Nicha Tatsaneeyapan
 
Variations in human resource management in asian countries mnc home country a...
Variations in human resource management in asian countries mnc home country a...Variations in human resource management in asian countries mnc home country a...
Variations in human resource management in asian countries mnc home country a...Nicha Tatsaneeyapan
 
Sterilization costs and exchange rate targeting∗
Sterilization costs and exchange rate targeting∗Sterilization costs and exchange rate targeting∗
Sterilization costs and exchange rate targeting∗Nicha Tatsaneeyapan
 
Comparisons of Foreign Multinationals and Local Firms in Asian Manufacturing...
Comparisons of Foreign Multinationals and Local  Firms in Asian Manufacturing...Comparisons of Foreign Multinationals and Local  Firms in Asian Manufacturing...
Comparisons of Foreign Multinationals and Local Firms in Asian Manufacturing...Nicha Tatsaneeyapan
 
The Investment Climate for Japanese Manufacturing MNCs in Asia: ICSEAD's In...
The Investment Climate for  Japanese Manufacturing MNCs in Asia:  ICSEAD's In...The Investment Climate for  Japanese Manufacturing MNCs in Asia:  ICSEAD's In...
The Investment Climate for Japanese Manufacturing MNCs in Asia: ICSEAD's In...Nicha Tatsaneeyapan
 

More from Nicha Tatsaneeyapan (20)

How To Shift Consumer Behaviors to be more sustainable; a literature review a...
How To Shift Consumer Behaviors to be more sustainable; a literature review a...How To Shift Consumer Behaviors to be more sustainable; a literature review a...
How To Shift Consumer Behaviors to be more sustainable; a literature review a...
 
An ethical approach to data privacy protection
An ethical approach to data privacy protectionAn ethical approach to data privacy protection
An ethical approach to data privacy protection
 
Linkages between extreme stock market and currency returns
Linkages between extreme stock market and currency returnsLinkages between extreme stock market and currency returns
Linkages between extreme stock market and currency returns
 
Incentives and risk taking in hedge funds
Incentives and risk taking in hedge fundsIncentives and risk taking in hedge funds
Incentives and risk taking in hedge funds
 
Loss-aversion and household portfolio choice
Loss-aversion and household portfolio choiceLoss-aversion and household portfolio choice
Loss-aversion and household portfolio choice
 
Estimating ambiguity preferences and perceptions in multiple prior models: Ev...
Estimating ambiguity preferences and perceptions in multiple prior models: Ev...Estimating ambiguity preferences and perceptions in multiple prior models: Ev...
Estimating ambiguity preferences and perceptions in multiple prior models: Ev...
 
Forecasting the US housing market
Forecasting the US housing marketForecasting the US housing market
Forecasting the US housing market
 
Options and earnings announcements: an empirical study of volatility,trading ...
Options and earnings announcements: an empirical study of volatility,trading ...Options and earnings announcements: an empirical study of volatility,trading ...
Options and earnings announcements: an empirical study of volatility,trading ...
 
Early Warning Systems for Currency Crises: A Multivariate Extreme Value Appr...
Early Warning Systems for Currency Crises:  A Multivariate Extreme Value Appr...Early Warning Systems for Currency Crises:  A Multivariate Extreme Value Appr...
Early Warning Systems for Currency Crises: A Multivariate Extreme Value Appr...
 
Incentives and Risk Taking in Hedge Funds *
Incentives and Risk Taking in Hedge Funds *Incentives and Risk Taking in Hedge Funds *
Incentives and Risk Taking in Hedge Funds *
 
The effect of VaR-based risk management on asset prices and the volatility s...
The effect of VaR-based risk management on asset prices  and the volatility s...The effect of VaR-based risk management on asset prices  and the volatility s...
The effect of VaR-based risk management on asset prices and the volatility s...
 
Model Uncertainty and Exchange Rate Forecasting
Model Uncertainty and Exchange Rate ForecastingModel Uncertainty and Exchange Rate Forecasting
Model Uncertainty and Exchange Rate Forecasting
 
HIGH-PERFORMANCE COMPUTING FOR ASSET-LIABILITY MANAGEMENT
HIGH-PERFORMANCE COMPUTING FOR ASSET-LIABILITY MANAGEMENTHIGH-PERFORMANCE COMPUTING FOR ASSET-LIABILITY MANAGEMENT
HIGH-PERFORMANCE COMPUTING FOR ASSET-LIABILITY MANAGEMENT
 
Endogenous Price Bubbles in a Multi-Agent System of the Housing Market
Endogenous Price Bubbles in a Multi-Agent System of the Housing MarketEndogenous Price Bubbles in a Multi-Agent System of the Housing Market
Endogenous Price Bubbles in a Multi-Agent System of the Housing Market
 
Comparisons of Foreign Multinationals and Local Firms in Asian Manufacturing...
Comparisons of Foreign Multinationals and Local  Firms in Asian Manufacturing...Comparisons of Foreign Multinationals and Local  Firms in Asian Manufacturing...
Comparisons of Foreign Multinationals and Local Firms in Asian Manufacturing...
 
Wage differentials between_foreign_multinationals_
Wage differentials between_foreign_multinationals_Wage differentials between_foreign_multinationals_
Wage differentials between_foreign_multinationals_
 
Variations in human resource management in asian countries mnc home country a...
Variations in human resource management in asian countries mnc home country a...Variations in human resource management in asian countries mnc home country a...
Variations in human resource management in asian countries mnc home country a...
 
Sterilization costs and exchange rate targeting∗
Sterilization costs and exchange rate targeting∗Sterilization costs and exchange rate targeting∗
Sterilization costs and exchange rate targeting∗
 
Comparisons of Foreign Multinationals and Local Firms in Asian Manufacturing...
Comparisons of Foreign Multinationals and Local  Firms in Asian Manufacturing...Comparisons of Foreign Multinationals and Local  Firms in Asian Manufacturing...
Comparisons of Foreign Multinationals and Local Firms in Asian Manufacturing...
 
The Investment Climate for Japanese Manufacturing MNCs in Asia: ICSEAD's In...
The Investment Climate for  Japanese Manufacturing MNCs in Asia:  ICSEAD's In...The Investment Climate for  Japanese Manufacturing MNCs in Asia:  ICSEAD's In...
The Investment Climate for Japanese Manufacturing MNCs in Asia: ICSEAD's In...
 

Recently uploaded

CALL ON ➥8923113531 🔝Call Girls Gomti Nagar Lucknow best sexual service
CALL ON ➥8923113531 🔝Call Girls Gomti Nagar Lucknow best sexual serviceCALL ON ➥8923113531 🔝Call Girls Gomti Nagar Lucknow best sexual service
CALL ON ➥8923113531 🔝Call Girls Gomti Nagar Lucknow best sexual serviceanilsa9823
 
The Economic History of the U.S. Lecture 17.pdf
The Economic History of the U.S. Lecture 17.pdfThe Economic History of the U.S. Lecture 17.pdf
The Economic History of the U.S. Lecture 17.pdfGale Pooley
 
High Class Call Girls Nashik Maya 7001305949 Independent Escort Service Nashik
High Class Call Girls Nashik Maya 7001305949 Independent Escort Service NashikHigh Class Call Girls Nashik Maya 7001305949 Independent Escort Service Nashik
High Class Call Girls Nashik Maya 7001305949 Independent Escort Service NashikCall Girls in Nagpur High Profile
 
Instant Issue Debit Cards - High School Spirit
Instant Issue Debit Cards - High School SpiritInstant Issue Debit Cards - High School Spirit
Instant Issue Debit Cards - High School Spiritegoetzinger
 
Solution Manual for Principles of Corporate Finance 14th Edition by Richard B...
Solution Manual for Principles of Corporate Finance 14th Edition by Richard B...Solution Manual for Principles of Corporate Finance 14th Edition by Richard B...
Solution Manual for Principles of Corporate Finance 14th Edition by Richard B...ssifa0344
 
The Economic History of the U.S. Lecture 30.pdf
The Economic History of the U.S. Lecture 30.pdfThe Economic History of the U.S. Lecture 30.pdf
The Economic History of the U.S. Lecture 30.pdfGale Pooley
 
Malad Call Girl in Services 9892124323 | ₹,4500 With Room Free Delivery
Malad Call Girl in Services  9892124323 | ₹,4500 With Room Free DeliveryMalad Call Girl in Services  9892124323 | ₹,4500 With Room Free Delivery
Malad Call Girl in Services 9892124323 | ₹,4500 With Room Free DeliveryPooja Nehwal
 
Log your LOA pain with Pension Lab's brilliant campaign
Log your LOA pain with Pension Lab's brilliant campaignLog your LOA pain with Pension Lab's brilliant campaign
Log your LOA pain with Pension Lab's brilliant campaignHenry Tapper
 
Russian Call Girls In Gtb Nagar (Delhi) 9711199012 💋✔💕😘 Naughty Call Girls Se...
Russian Call Girls In Gtb Nagar (Delhi) 9711199012 💋✔💕😘 Naughty Call Girls Se...Russian Call Girls In Gtb Nagar (Delhi) 9711199012 💋✔💕😘 Naughty Call Girls Se...
Russian Call Girls In Gtb Nagar (Delhi) 9711199012 💋✔💕😘 Naughty Call Girls Se...shivangimorya083
 
Quarter 4- Module 3 Principles of Marketing
Quarter 4- Module 3 Principles of MarketingQuarter 4- Module 3 Principles of Marketing
Quarter 4- Module 3 Principles of MarketingMaristelaRamos12
 
20240429 Calibre April 2024 Investor Presentation.pdf
20240429 Calibre April 2024 Investor Presentation.pdf20240429 Calibre April 2024 Investor Presentation.pdf
20240429 Calibre April 2024 Investor Presentation.pdfAdnet Communications
 
TEST BANK For Corporate Finance, 13th Edition By Stephen Ross, Randolph Weste...
TEST BANK For Corporate Finance, 13th Edition By Stephen Ross, Randolph Weste...TEST BANK For Corporate Finance, 13th Edition By Stephen Ross, Randolph Weste...
TEST BANK For Corporate Finance, 13th Edition By Stephen Ross, Randolph Weste...ssifa0344
 
VIP Call Girls Service Dilsukhnagar Hyderabad Call +91-8250192130
VIP Call Girls Service Dilsukhnagar Hyderabad Call +91-8250192130VIP Call Girls Service Dilsukhnagar Hyderabad Call +91-8250192130
VIP Call Girls Service Dilsukhnagar Hyderabad Call +91-8250192130Suhani Kapoor
 
Instant Issue Debit Cards - School Designs
Instant Issue Debit Cards - School DesignsInstant Issue Debit Cards - School Designs
Instant Issue Debit Cards - School Designsegoetzinger
 
02_Fabio Colombo_Accenture_MeetupDora&Cybersecurity.pptx
02_Fabio Colombo_Accenture_MeetupDora&Cybersecurity.pptx02_Fabio Colombo_Accenture_MeetupDora&Cybersecurity.pptx
02_Fabio Colombo_Accenture_MeetupDora&Cybersecurity.pptxFinTech Belgium
 
Vip Call US 📞 7738631006 ✅Call Girls In Sakinaka ( Mumbai )
Vip Call US 📞 7738631006 ✅Call Girls In Sakinaka ( Mumbai )Vip Call US 📞 7738631006 ✅Call Girls In Sakinaka ( Mumbai )
Vip Call US 📞 7738631006 ✅Call Girls In Sakinaka ( Mumbai )Pooja Nehwal
 
The Economic History of the U.S. Lecture 21.pdf
The Economic History of the U.S. Lecture 21.pdfThe Economic History of the U.S. Lecture 21.pdf
The Economic History of the U.S. Lecture 21.pdfGale Pooley
 
Dharavi Russian callg Girls, { 09892124323 } || Call Girl In Mumbai ...
Dharavi Russian callg Girls, { 09892124323 } || Call Girl In Mumbai ...Dharavi Russian callg Girls, { 09892124323 } || Call Girl In Mumbai ...
Dharavi Russian callg Girls, { 09892124323 } || Call Girl In Mumbai ...Pooja Nehwal
 
Independent Call Girl Number in Kurla Mumbai📲 Pooja Nehwal 9892124323 💞 Full ...
Independent Call Girl Number in Kurla Mumbai📲 Pooja Nehwal 9892124323 💞 Full ...Independent Call Girl Number in Kurla Mumbai📲 Pooja Nehwal 9892124323 💞 Full ...
Independent Call Girl Number in Kurla Mumbai📲 Pooja Nehwal 9892124323 💞 Full ...Pooja Nehwal
 

Recently uploaded (20)

CALL ON ➥8923113531 🔝Call Girls Gomti Nagar Lucknow best sexual service
CALL ON ➥8923113531 🔝Call Girls Gomti Nagar Lucknow best sexual serviceCALL ON ➥8923113531 🔝Call Girls Gomti Nagar Lucknow best sexual service
CALL ON ➥8923113531 🔝Call Girls Gomti Nagar Lucknow best sexual service
 
The Economic History of the U.S. Lecture 17.pdf
The Economic History of the U.S. Lecture 17.pdfThe Economic History of the U.S. Lecture 17.pdf
The Economic History of the U.S. Lecture 17.pdf
 
High Class Call Girls Nashik Maya 7001305949 Independent Escort Service Nashik
High Class Call Girls Nashik Maya 7001305949 Independent Escort Service NashikHigh Class Call Girls Nashik Maya 7001305949 Independent Escort Service Nashik
High Class Call Girls Nashik Maya 7001305949 Independent Escort Service Nashik
 
Instant Issue Debit Cards - High School Spirit
Instant Issue Debit Cards - High School SpiritInstant Issue Debit Cards - High School Spirit
Instant Issue Debit Cards - High School Spirit
 
Solution Manual for Principles of Corporate Finance 14th Edition by Richard B...
Solution Manual for Principles of Corporate Finance 14th Edition by Richard B...Solution Manual for Principles of Corporate Finance 14th Edition by Richard B...
Solution Manual for Principles of Corporate Finance 14th Edition by Richard B...
 
The Economic History of the U.S. Lecture 30.pdf
The Economic History of the U.S. Lecture 30.pdfThe Economic History of the U.S. Lecture 30.pdf
The Economic History of the U.S. Lecture 30.pdf
 
Malad Call Girl in Services 9892124323 | ₹,4500 With Room Free Delivery
Malad Call Girl in Services  9892124323 | ₹,4500 With Room Free DeliveryMalad Call Girl in Services  9892124323 | ₹,4500 With Room Free Delivery
Malad Call Girl in Services 9892124323 | ₹,4500 With Room Free Delivery
 
Log your LOA pain with Pension Lab's brilliant campaign
Log your LOA pain with Pension Lab's brilliant campaignLog your LOA pain with Pension Lab's brilliant campaign
Log your LOA pain with Pension Lab's brilliant campaign
 
Russian Call Girls In Gtb Nagar (Delhi) 9711199012 💋✔💕😘 Naughty Call Girls Se...
Russian Call Girls In Gtb Nagar (Delhi) 9711199012 💋✔💕😘 Naughty Call Girls Se...Russian Call Girls In Gtb Nagar (Delhi) 9711199012 💋✔💕😘 Naughty Call Girls Se...
Russian Call Girls In Gtb Nagar (Delhi) 9711199012 💋✔💕😘 Naughty Call Girls Se...
 
Quarter 4- Module 3 Principles of Marketing
Quarter 4- Module 3 Principles of MarketingQuarter 4- Module 3 Principles of Marketing
Quarter 4- Module 3 Principles of Marketing
 
20240429 Calibre April 2024 Investor Presentation.pdf
20240429 Calibre April 2024 Investor Presentation.pdf20240429 Calibre April 2024 Investor Presentation.pdf
20240429 Calibre April 2024 Investor Presentation.pdf
 
TEST BANK For Corporate Finance, 13th Edition By Stephen Ross, Randolph Weste...
TEST BANK For Corporate Finance, 13th Edition By Stephen Ross, Randolph Weste...TEST BANK For Corporate Finance, 13th Edition By Stephen Ross, Randolph Weste...
TEST BANK For Corporate Finance, 13th Edition By Stephen Ross, Randolph Weste...
 
VIP Call Girls Service Dilsukhnagar Hyderabad Call +91-8250192130
VIP Call Girls Service Dilsukhnagar Hyderabad Call +91-8250192130VIP Call Girls Service Dilsukhnagar Hyderabad Call +91-8250192130
VIP Call Girls Service Dilsukhnagar Hyderabad Call +91-8250192130
 
Instant Issue Debit Cards - School Designs
Instant Issue Debit Cards - School DesignsInstant Issue Debit Cards - School Designs
Instant Issue Debit Cards - School Designs
 
02_Fabio Colombo_Accenture_MeetupDora&Cybersecurity.pptx
02_Fabio Colombo_Accenture_MeetupDora&Cybersecurity.pptx02_Fabio Colombo_Accenture_MeetupDora&Cybersecurity.pptx
02_Fabio Colombo_Accenture_MeetupDora&Cybersecurity.pptx
 
Veritas Interim Report 1 January–31 March 2024
Veritas Interim Report 1 January–31 March 2024Veritas Interim Report 1 January–31 March 2024
Veritas Interim Report 1 January–31 March 2024
 
Vip Call US 📞 7738631006 ✅Call Girls In Sakinaka ( Mumbai )
Vip Call US 📞 7738631006 ✅Call Girls In Sakinaka ( Mumbai )Vip Call US 📞 7738631006 ✅Call Girls In Sakinaka ( Mumbai )
Vip Call US 📞 7738631006 ✅Call Girls In Sakinaka ( Mumbai )
 
The Economic History of the U.S. Lecture 21.pdf
The Economic History of the U.S. Lecture 21.pdfThe Economic History of the U.S. Lecture 21.pdf
The Economic History of the U.S. Lecture 21.pdf
 
Dharavi Russian callg Girls, { 09892124323 } || Call Girl In Mumbai ...
Dharavi Russian callg Girls, { 09892124323 } || Call Girl In Mumbai ...Dharavi Russian callg Girls, { 09892124323 } || Call Girl In Mumbai ...
Dharavi Russian callg Girls, { 09892124323 } || Call Girl In Mumbai ...
 
Independent Call Girl Number in Kurla Mumbai📲 Pooja Nehwal 9892124323 💞 Full ...
Independent Call Girl Number in Kurla Mumbai📲 Pooja Nehwal 9892124323 💞 Full ...Independent Call Girl Number in Kurla Mumbai📲 Pooja Nehwal 9892124323 💞 Full ...
Independent Call Girl Number in Kurla Mumbai📲 Pooja Nehwal 9892124323 💞 Full ...
 

Stochastic programming models for asset liability management scenario generation

  • 1. Scenario generation and stochastic programming models for asset liability management q Roy Kouwenberg Econometric Institute, Erasmus University Rotterdam, P.O. Box 1738, 3000 DR Rotterdam, The Netherlands Abstract In this paper, we develop and test scenario generation methods for asset liability management models. We propose a multi-stage stochastic programming model for a Dutch pension fund. Both randomly sampled event trees and event trees ®tting the mean and the covariance of the return distribution are used for generating the coecients of the sto- chastic program. In order to investigate the performance of the model and the scenario generation procedures we conduct rolling horizon simulations. The average cost and the risk of the stochastic programming policy are compared to the results of a simple ®xed mix model. We compare the average switching behavior of the optimal investment policies. Our results show that the performance of the multi-stage stochastic program could be improved drastically by choosing an appropriate scenario generation method. Ó 2001 Elsevier Science B.V. All rights reserved. Keywords: Stochastic programming; Finance; Asset liability management; Scenarios 1. Introduction In this paper, we develop and test scenario generation methods for asset liability management models. As an application we consider the ®nan- cial planning problem of a large Dutch pension fund. The planning horizon of most pension funds stretches out for decades, as a result of the long term commitment to pay bene®ts to the retirees. However, funds should also reckon with short term solvency requirements. The trade-o€ between long term gains and short term losses should be made carefully, while anticipating future adjust- ments of the policy. This setting therefore seems to be suited for a stochastic programming approach with dynamic portfolio strategies. Stochastic pro- gramming models have been applied to ®nancial planning problems by Carino et al. (1994), Consigli and Dempster (1998), Golub et al. (1995), Kusy and Ziemba (1986) and Mulvey and Vla- dimirou (1992). In this paper, we propose a stochastic pro- gramming model for asset liability management for pension funds based upon Carino et al. (1994) and Dert (1995). We investigate the topic of European Journal of Operational Research 134 (2001) 279±292 www.elsevier.com/locate/dsw q Research partially supported through contract ``HPC- Finance'' (no. 951139) of the European Comission. Partial support also provided by the ``HPC-Finance'' partner institu- tions: Universities of Bergamo (IT), Cambridge (UK), Calabria (IT), Charles (CZ), Cyprus (CY), Erasmus (ND), Technion (IL) and the ``Centro per il Calcolo Parallelo e i Supercalcolatori'' (IT). E-mail address: kouwenberg@few.eur.nl (R. Kouwenberg). 0377-2217/01/$ - see front matter Ó 2001 Elsevier Science B.V. All rights reserved. PII: S 0 3 7 7 - 2 2 1 7 ( 0 0 ) 0 0 2 6 1 - 7
  • 2. scenario generation by considering both randomly sampled event trees and event trees that ®t the mean and the covariance of the underlying distri- bution in each node. We use rolling horizon sim- ulations to measure the performance of the stochastic programming model and the scenario generation methods. The results are compared to a benchmark ®xed mix model. We show that the optimal solution of the stochastic program based on a randomly sampled tree promises spurious pro®ts and results in extensive asset mix switching. A simple adjustment to the random sampling procedure similar to Carino et al. (1994) greatly improves the performance of the model. Even better performance is achieved by ®tting the ®rst few moments of the underlying distribution in each node (H oyland and Wallace, 1996). Only with the latter method for constructing event trees, the stochastic programming model dominates the ®xed mix benchmark. 2. Generating scenarios 2.1. Scenarios for the liabilities All quantitative models considered in this pa- per, will be applied to the planning problem of a large Dutch pension fund. The goal of this pension fund is to provide its participants with bene®ts equal to 70% of their ®nal salary. The actual bene®t payment depends on the number of years a retiree has been building up rights, by paying contributions to the fund. Each year the earned rights of a participant k are determined by Ok…t† ˆ 1:75% dk Sk…t† 100 70 PP…t† ; …1† where dk is the number of years participant k has been building up rights, Sk…t† the salary of the participant at time t and PP…t† is the public pension at time t. If a retired participant has built up rights for 40 years (from age 25±65), then he will receive a bene®t payment (including the public pension) equal to 70% of his ®nal salary. To avoid depre- ciation of this real amount, the pension fund in- creases the bene®ts of the retirees each year with the general increase of wages. The earned rights of participants who have stopped building up rights but are not yet retired are also indexed with the wage increase. 1 However, in times of ®nancial distress the pension fund is not obliged to pursue these expensive adjustments. Given the pension scheme in (1), the value of the liabilities is now determined as the present value of the expected bene®t payments (2). Regu- latory authorities in the Netherlands check the solvency requirements by comparing the liabilities to asset value of the fund. Note that in (2) the current earned rights are discounted. The future increases of the earned rights due to wage in¯ation are ignored. These expected real payments are discounted with a constant actuarial rate of 4%, as speci®ed by the regulatory authorities. Lk…t† ˆ X 1 jˆmaxf1;65 lktg Ok…t† 1 1 ‡ r j p …j† lkt ; …2† where Ok…t† are the earned rights of participant k, r the actuarial discount rate, lkt the age of partici- pant k at time t and p …j† lkt is the probability that a person of age lkt will be alive in j years time. To generate scenarios for the uncertain devel- opment of the liabilities and the bene®t payments, future values of the earned rights should be de- termined. An important ®rst step is to estimate the future status of the participants: how many par- ticipants will be retired and working? The method of Boender (1997) uses a Markov model, which updates the status of each participant year by year according to assumed mortality rates, retirement rates and job termination rates. The second step is to specify the future real wages, ignoring general price and wage in¯ation. Using (1) and (2), the future value of the earned rights, the real bene®ts and the real liabilities are determined. The average over 100 simulation runs of the Markov model has been computed in order to estimate the expected real values of the bene®ts and the liabilities. 1 E.g., participants who have changed jobs and are now aliated with another pension fund. 280 R. Kouwenberg / European Journal of Operational Research 134 (2001) 279±292
  • 3. 2.2. Economic scenarios The economic scenarios should provide infor- mation about future asset returns in order to evaluate investment policies for the pension fund. As the scope of asset liability management is lim- ited to long term strategic decisions, a small set of asset classes should be sucient. Moreover, each scenario should contain a time series of wage in- creases in order to transform the real expected values of the bene®ts and liabilities into nominal values. To generate these time series, we will use a vector autoregressive model (VAR model): ht ˆ c ‡ Xht 1 ‡ t; t N…0; R†; t ˆ 1; . . . ; T; …3† hit ˆ ln…1 ‡ rit†; i ˆ 1; . . . ; I; t ˆ 1; . . . ; T ; …4† where I is the number of time series, rit the discrete rate of change of variable i in year t, ht is a fI 1g vector of continuously compounded rates, c the fI 1g vector of coecients, X the fI Ig matrix of coecients, t the fI 1g vector of error terms and R is a fI Ig covariance matrix. The asset classes considered in this study are deposits, bonds, real estate and stocks. Annual observations of the total asset returns and the general wage increase from 1956 to 1994 are used to estimate the coecients of the VAR model. Table 1 displays descriptive statistics of the time series and Table 2 displays the correlation matrix. The speci®cation of the VAR model should be chosen carefully, because the asset returns are generated to implement a ®nancial optimization model. To avoid any problems with unstable and spurious predictability of returns, we never use lagged variables to model the returns of bonds, real estate and stocks in the VAR model (Table 3). The time series of the return on deposits and the increase of the wage level are modeled by a ®rst- order autoregressive process. The VAR model is estimated by the method of iterative weighted least-squares. Table 4 displays the estimated cor- relation matrix of the residuals. Future returns for ®nancial planning models can be constructed by sampling from the error distribution of the VAR model and applying the estimated equations of Table 3. After the VAR model has been used to generate a random sample of returns, nominal values for the wages, the liabilities and the bene®ts are determined by indexing the real expected val- ues each year with the projected annual wage in- crease. 2 3. Asset liability management 3.1. Costs, risk and stability As pointed out, we consider a pension fund that provides a de®ned bene®t pension scheme to its retirees. To fund this pension scheme, the plan sponsor each year pays a contribution to the fund. Next the pension fund has to decide how to invest these contributions, in order to meet short term solvency requirements and to ful®ll its long term obligations. Therefore, the goal of asset liability management for pension funds is to ®nd a Table 1 Statistics, time series 1956±1994a Mean S.D. Skewness Kurtosis Wages 0.061 0.044 0.434 2.169 Deposits 0.055 0.025 0.286 2.430 Bonds 0.061 0.063 0.247 3.131 Real estate 0.081 0.112 )0.492 7.027 Stocks 0.102 0.170 0.096 2.492 a Wages is the rate of change of the Dutch general wage level. The time series deposits is based on the average of the 3-month borrowing rate for government agencies. In each year a pre- mium of 0:5% has been subtracted, because the pension fund will have to lend cash to commercial banks. The asset class bonds represents the total return of a roll-over investment in long term Dutch government bonds. Real estate consists of total returns of the property fund Rodamco. Due to some outliers speci®c to this fund in 1993 and 1994, the time series has an exceptionally high kurtosis. Stocks is the total return of the internationally diversi®ed mutual fund Robeco. All time series were provided by Ortec Consultants. 2 At this moment the commercial system of Ortec cannot generate scenarios in the tree-shaped structure, needed to implement multi-stage stochastic programming models. There- fore, some small sacri®ces in the modeling process had to be made. Ideally, the Markov model should generate the wages, the bene®ts and the liabilities conditionally for each set of economic projections. R. Kouwenberg / European Journal of Operational Research 134 (2001) 279±292 281
  • 4. investment policy and a contribution policy. One might argue that the level of the contributions is not controlled by the pension fund, but by the plan sponsor and the participants instead. However, the ¯exibility of the contribution rates determines the capability of the pension fund to deal with huge losses on the asset portfolio. Restricted contribu- tion policies will limit the amount invested in risky assets, if the pension fund wants to keep up with the solvency requirements. In our opinion, this interdependence between the contribution policy and the investment policy should be modeled ex- plicitly to provide valuable insight. In the Netherlands, contributions to the pen- sion fund are usually a ®xed percentage of the wage of each participant. We refer to this per- centage as the contribution rate. In practice a steep increase of the contribution rate should be avoi- ded, as this would immediately decrease the pro®ts or income of the plan sponsor. Due to this reluc- Table 3 Coecients of the VAR-modela ln…1 ‡ wagest† ˆ 0:018 + 0:693 ln…1 ‡ wagest 1† ‡ e1t r1t ˆ 0:030 …2:058† …5:789† ln…1 ‡ depositst† ˆ 0:020 + 0:644 ln…1 ‡ depositst 1† ‡ e2t r2t ˆ 0:017 …2:865† …5:448† ln…1 ‡ bondst† ˆ 0:058 + e3t r3t ˆ 0:060 …6:241† ln…1 ‡ real estatet† ˆ 0:072 + e5t r5t ˆ 0:112 …4:146† ln…1 ‡ stockst† ˆ 0:086 + e6t r6t ˆ 0:159 …3:454† a Estimated with interative weighted least-squares, annually 1956±1994, t-statistics in parentheses. For the purpose of generating plausible scenarios the coecient of the bond returns in the VAR model will be increased with 1:0%. Note that the average total return of bonds is quite low in the time period 1956±1994: 6:1%. This is partly due to the low post World-War-II interest rates, that start to return to `regular' levels in 1956 and 1957. If these two years are excluded the average bond return increases to 6:7%. Table 4 Residual correlations of VAR-model Wages Deposits Bonds Real estate Stocks Wages 1 Deposits 0.227 1 Bonds )0.152 )0.268 1 Real estate )0.008 )0.179 0.343 1 Stocks )0.389 )0.516 0.383 0.331 1 Table 2 Correlations, annually 1956±1994 Wages Deposits Bonds Real estate Stocks Wages 1 Deposits )0.059 1 Bonds )0.127 0.259 1 Real estate 0.162 )0.053 0.360 1 Stocks )0.296 )0.157 0.379 0.326 1 282 R. Kouwenberg / European Journal of Operational Research 134 (2001) 279±292
  • 5. tance to increase the contribution rates, it might occur that the value of the assets temporarily drops below the liabilities (underfunding). The pension fund is allowed to built up a surplus in order to stabilize the contribution rate, while avoiding de®cits. To measure the variability of the contribution rate, we use the mean absolute dif- ference (7). To measure both the probability and the level of de®cits we use the second downside moment of the funding ratio (6), with the thresh- old at 1. The funding ratio is the ratio of assets to liabilities and therefore it seems plausible to start measuring risk if the funding ratio is less than 1. Finally, the average contribution rate (5) repre- sents the costs of the pension plan. The asset lia- bility management model for pension funds should provide insight in the optimal trade-o€ between these three measures, representing costs, risk and stability. Costs : Mcr ˆ X S sˆ1 1 S X T tˆ1 crts T ! ; …5† Risk : Dm2 ˆ X S sˆ1 1 S X T tˆ1 maxf0; 1 Ftsg … † 2 T ! ; …6† Stability : Madcr ˆ X S sˆ1 1 S X T tˆ2 jcrts crt 1;sj T 1 ! ; …7† where Mcr is the mean contribution rate, Dm2 the second downside moment of the funding ratio, Madcr the mean absolute di€erence of the contri- bution rates, crts the contribution rate at the be- ginning of year t, Fts the funding ratio at the end of year t, T the planning horizon and S is the number of scenarios. 3.2. Fixed mix model In the Netherlands most pension funds use a decision support system based on simulation and optimization, in order to provide insight in the planning problem and to estimate expected costs and risk (Boender, 1997). Currently the optimi- zation part of the decision support system uses a ®xed asset mix and a decision rule for setting contribution rates. The ®xed mix investment strategy assumes that the weights of the asset mix are restored each year to pre-speci®ed target proportions. Eqs. (8) and (9) describe a simple decision rule for setting contributions to the pension fund. The funding rule determines a weighted average of the target contribution rate cr and the rate that restores the funding ratio to the target level F . The smoothness of the dy- namic adjustments can be controlled by the pa- rameter a. crts ˆ cr ‡ a zrts … cr †; …8† zrts ˆ F … Ft 1;s† Lt 1;s Sts ; …9† where cr is the target contribution rate, zrts the contribution rate that lifts the funding ratio to F , Fts the funding ratio at the end of year t, Sts the sum of the wages of the participants at the beginning of year t, Lts the value of liabilities at the end of year t and a 2 f0; 1g is the adjustment weight. The ®xed mix model incorporates a bi-linear constraint for determining the asset value and could be solved by applying the global optimiza- tion procedure of Floudas and Visweswaran (1993). Boender (1997) uses a local search algo- rithm to ®nd (sub-)optimal investment policies for pension funds, while taking into account realistic funding rules and risk measures. However, the number of decision variables should be small, in order to avoid overwhelming solution times. Fixed mix models could determine dynamic investment policies by including decision rules that change the composition of the ®xed mix according to state variables like the current interest rate and the ex- pected growth of the liabilities. This approach is used by Boender (1997) and Brennan et al. (1997). Note that in discrete time these models could be based on a set of independently generated sce- narios. Each scenario is a particular path of states from the initial time period to the planning hori- zon (Fig. 1). R. Kouwenberg / European Journal of Operational Research 134 (2001) 279±292 283
  • 6. 3.3. Stochastic programming approach A stochastic programming model is based upon an event tree for the key random variables (Fig. 2). Each node of the event tree has multiple successors, in order to model the process of in- formation being revealed progressively through time. The stochastic programming approach will determine an optimal decision for each node of the event tree, given the information available at that point. These optimal decisions will be de- termined without exploiting hindsight, because there are multiple succeeding nodes. If a sto- chastic programming model is formulated then the optimal policy will be tailor-made to ®t the condition of the pension fund in each state, while anticipating the optimal adjustment of the policy later on. Moreover, a trade-o€ between short term and long term costs is made. Stochastic programming models have been applied to asset liability management by Carino et al. (1994), Consigli and Dempster (1998), Dert (1995), Kusy and Ziemba (1986), Mulvey and Vladimirou (1992) and Zenios (1995). We will now introduce a stochastic program- ming model for asset liability management for pension funds, based upon Dert (1995). The model of Dert (1995) includes chance constraints for the solvency of pension funds, which severely complicate numerical solutions. Following Ca- rino et al. (1994), we penalize de®cits in the objective function to avoid these computational diculties. The model is presented in compact form, which means that the structure of the event tree is not described by a set of constraints but instead is contained implicitly in the de®ni- tion of the model. We change the notation from a set of scenarios s 2 f1; . . . ; Sg to the nodes of the event tree n 2 f1; . . . ; Ntg. 3 Nt denotes the number of nodes of the event tree at time t, n 2 f1; . . . ; Ntg is a particular node in this set and ^ n is the predecessor of node n at time t 1. First a list of variables, coecients and param- eters is provided. De®nition of variables Atn portfolio value at the end of year t Xh itn amount invested in asset class i at the beginning of year t Xb itn amount bought of asset class i at the beginning of year t Xs itn amount sold of asset class i at the beginning of year t ml tn cash lent at the beginning of year t mb tn cash borrowed at the beginning of t crtn the contribution rate at the beginning of year t Ztn de®cit relative to the minimum funding ratio in year t crend n contribution rate at the planning horizon needed to lift the funding level to F end De®nition of random coecients Btn bene®t payments in year t Ltn liabilities at the end of year t Stn total wages of the participants at the begin- ning of year t rtn return on risky assets in year t rl tn lending rate in year t rb tn borrowing rate in year t Fig. 2. Event tree. Fig. 1. Linear scenario structure. 3 In an event tree a scenario represents a unique path from the initial node up to the planning horizon. 284 R. Kouwenberg / European Journal of Operational Research 134 (2001) 279±292
  • 7. 3.3.1. Objective The objective of the model is to minimize the sum of the average contribution rates, while taking into account the risk aversion of the pension fund and the state of the fund at the planning horizon. Risk aversion is modeled with a quadratic penalty on de®cits Ztn in the objective function (second downside moment of the funding ratio). To mea- sure the ®nal wealth of the pension fund, the funding ratio is restored to the target level F end at the planning horizon by setting the contribution rate at crend s . Without this ®nal contribution, end e€ects could occur and moreover it would be dif- ®cult to compare solutions. min X T 1 tˆ0 X Nt nˆ1 crtn Nt ! ‡ k X T tˆ1 X Nt nˆ1 1 Nt Ztn Ltn 2 ! ‡ X NT nˆ1 1 NT crend n : …10† 3.3.2. Cash balance equation The cash balance equation speci®es that the cash in¯ow (including borrowing, assets sold and contributions) should be equal to the cash out¯ow (including lending, assets bought and bene®t pay- ments). Transaction costs on buying and selling of assets are incorporated. mb tn ml tn ‡ …1 ‡ rl tn†ml t 1;^ n …1 ‡ rb tn†mb t 1;^ n ‡ crtnStn Btn ‡ X I iˆ1 …1 cs i †Xs itn X I iˆ1 …1 ‡ cb i †Xb itn ˆ 0; n ˆ 1; . . . ; Nt; t ˆ 1; . . . ; T 1; …11† mb 01 ml 01 ‡ mini ‡ cr01S01 B01 ‡ X I iˆ1 …1 cs i †Xs i01 X I iˆ1 …1 ‡ cb i †Xb i01 ˆ 0: …12† 3.3.3. Asset inventory equation The asset inventory equation speci®es that the amount invested in an asset class at the beginning of a period is equal to the amount invested at the end of the previous period adjusted for buying and selling. Xh itn ˆ …1 ‡ ritn†Xh i;t 1;^ n Xs itn ‡ Xb itn; i ˆ 1; . . . ; I; t ˆ 1; . . . ; T 1; n ˆ 1; . . . ; Nt; …13† Xh i01 ˆ Xini i Xs i01 ‡ Xb i01; i ˆ 1; . . . ; I: …14† 3.3.4. Total asset value at the end of a period This equation speci®es the total asset value at the end of a period, which is used to measure de®cits. Atn ˆ X I iˆ1 Xh i;t 1;^ n…1 ‡ ritn† ‡ …1 ‡ rl tn†ml t 1;^ n …1 ‡ rb tn†mb t 1;^ n; t ˆ 1; . . . ; T; n ˆ 1; . . . ; Nt: …15† 3.3.5. Measuring de®cits and ®nal wealth Whenever at the end of the year the funding ratio is less than the minimum level F min , de®cits are measured and penalized in the objective. At the end of the horizon the funding ratio should be greater than F end . The contribution rate crend n is set to lift the funding ratio to this target level. In this way we avoid end e€ects and measure the ®nal wealth of the pension fund. De®nition of model parameters Xini i initial amount invested in asset class i mini initial cash position crini initial contribution rate crlo=up lower/upper bound of the contribution rate dcrlo=up lower/upper bound of the decrease/ increase of the contribution rate c b=s i proportional transaction costs on buying/selling of asset class i F min minimum funding ratio F end target funding ratio at the planning horizon w lo=up i lower/upper bound of the weights of the asset mix k parameter for specifying risk aversion R. Kouwenberg / European Journal of Operational Research 134 (2001) 279±292 285
  • 8. Atn P F min Ltn Ztn; t ˆ 1; . . . ; T; n ˆ 1; . . . ; Nt; …16† ATn P F end LTn crend n STn; n ˆ 1; . . . ; NT ; …17† Ztn P 0; t ˆ 1; . . . ; T; n ˆ 1; . . . ; Nt; crend n P 0; n ˆ 1; . . . ; NT : …18† 3.3.6. Policy restrictions for the contribution rates The level and the change of the contribution rate are bounded, as speci®ed by the pension fund. crlo 6 crtn 6 crup ; t ˆ 0; . . . ; T 1; n ˆ 1; . . . ; Nt; …19† dcrlo 6 crtn crt 1;^ n 6 dcrup ; t ˆ 1; . . . ; T 1; n ˆ 1; . . . ; Nt: …20† 3.4. Policy restrictions for the asset mix The weights of the asset mix are bounded, as speci®ed by the pension fund. wlo i X I iˆ1 Xh itn 6 Xh itn 6 wup i X I iˆ1 Xh itn; i ˆ 1; . . . ; I; t ˆ 0; . . . ; T 1; n ˆ 1; . . . ; Nt: …21† 4. Constructing event trees 4.1. Random sampling In the previous section, we introduced a sto- chastic programming model for ALM of pension funds. The stochastic program is based upon an event tree, describing the return distributions and the development of the liabilities. In this section, we will present methods to construct event trees. First, we consider random sampling from the error distribution of the VAR model. We applied ran- dom sampling to construct an event tree with a planning horizon of 5 years and a branching structure of 1-10-6-6-4-4. This event tree has one initial node at time 0 and 10 succeeding nodes at time 1. Each node at time 1 has 6 succeeding nodes at time 2; . . . ; resulting in 10 6 6 4 4 ˆ 5760 nodes at time period 5. The stochastic programming model of the pre- vious section has been solved with this randomly sampled event tree as input. The borrowing and lending variables mb tn and ml tn are ®xed at zero in order to limit the number of variables. The size of the model formulated as a compact LP-problem is: 24 614 constraints, 32 100 variables and 96 586 (0.012%) non-zeros in the constraint matrix. Due to the exponential growth of the number of nodes in the event tree, the number of variables and constraints is huge. Note that the constraint matrix is very sparse: 0.012% ®ll-in. The special structure of the problem could be exploited by interior point methods (Birge and Qi, 1988) or a specialized de- composition method (Birge, 1985; Rockafellar, 1991). For the time being however, the stochastic programming model is solved as a large LP-prob- lem using the interior point algorithm HOPDM (Gondzio, 1995) on a Sun Sparcstation. It takes 11 seconds to generate the sparse data-structures of the problem with a C-code, while the solution time of the model is 298 seconds. The parameters of the model are displayed in Table 5. The initial funding ratio and the initial contribution rate are set to 1.07 and 0.12. 4 The minimum funding ratio is 1:00. If the funding ratio drops below this value de®cits are penalized in the objective, with the risk aversion parameter equal to 4. The target funding ratio at the horizon is 1:15. At the planning horizon the contribution rate crend s is paid to lift the funding ratio to this level. The upper and lower bounds of the contribution rate are set to 0:10 and 0:25. The decrease and the increase of the contribution rate are limited by 4 If the initial contributions and the initial cash position are added, then the funding ratio is 1:15. The initial contribution rate is a decision variable in the stochastic programming model, however it is ®xed at 0:12 in order to facilitate comparisons with the ®xed mix model. 286 R. Kouwenberg / European Journal of Operational Research 134 (2001) 279±292
  • 9. 0:08 and 0:04. The asset weights are forced to be in the range f0; 1g. Transaction costs of 1% are imposed on buying and selling of assets. However, these costs are ignored in the initial node in order to investigate how the optimal initial asset mix changes as a function of risk aversion. Table 6 contains information about the optimal solution of the stochastic programming model. First, the initial asset mix is displayed, which is the part of the solution that could be implemented. In this case, the model recommends the pension fund to invest 100% of its initial wealth in stocks. The mean absolute change of the asset weights is 0.37%, indicating major changes in the asset mix through time. The next part of the table shows that the optimal objective value is 0.2294 and that the average contribution rate equals 1.26%. Given the excessive switching behavior, the optimal solution should be looked at with some suspicion. This might be explained by considering the sparse branching structure of the event tree. At each time period there are no more than 10 states to represent the underlying conditional distribu- tion of 5 time series. Moreover, these states are sampled randomly. As a result, the mean and co- variance matrix will not be correctly speci®ed in most nodes of the tree. Next, in each node the optimizer chooses an investment strategy having the best return and downside risk characteristics but based on limited and incorrect information. An obvious way to deal with this problem is to increase the number of nodes in the randomly sampled event tree. However, the stochastic pro- gram might become computationally intractable due to the exponential growth rate of the tree. Alternatively, the switching of asset weights might be bounded by adding linear constraints to the model. Though the solutions might appear more reasonable in this case, the forces driving the op- timizer remain unreasonable. Klaassen (1998) proposes a fundamental ap- proach to deal with arbitrage opportunities and spurious pro®ts in stochastic programming models for ®nancial planning. The approach of Klaassen (1998) requires a ®ne-grained event tree without arbitrage opportunities and a corresponding risk neutral probability measure. The risk neutral tree is aggregated while preserving the no-arbitrage property. However, this method seems to ignore the properties of the `regular' probabilities and distri- butions. A better approach might be to increase the eciency of the random sampling procedure by reducing the variance of the samples. Carino et al. (1994) use a clustering technique which shrinks a large sample of return vectors, while ®tting the mean and the variance exactly and preserving in- formation about higher order moments. 4.2. Adjusted random sampling We will now consider an adjusted random sampling technique. Assuming an even number of nodes, we apply antithetic sampling in order to ®t every odd moment of the underlying distribution. Table 6 Solution of SP model: Random samplinga Initial asset mix Bonds Real Stocks 0.00 0.00 1.00 Switching Bonds Real Stocks (average absolute deviation) 0.31 0.37 0.42 Objective value 0.2294 Mean contribution rate (Mcr) 0.0126 Downside risk (Dm2) 0.0302 MAD contribution rates (Madcr) 0.0539 a The parameters of the model are displayed in Table 5. The switching behaviour of the optimal asset policy through time is measured by the average absolute change of the asset weights. Dm2 is the second downside moment of the funding ratio. MAD measures the average absolute change of the contribution rates. Table 5 Parameters of the stochastic programming model crini crlo crup dcrlo dcrup F ini F end wlo wup k cb cs 0.12 )0.10 0.25 )0.08 0.04 1.00 1.15 0.00 1.00 4.00 0.01 0.01 R. Kouwenberg / European Journal of Operational Research 134 (2001) 279±292 287
  • 10. For example, if there are 10 succeeding nodes then we sample 5 vectors of error terms from the VAR model. The error terms for the 5 remaining nodes are identical but with opposite signs. Next the sample points of each variable are rescaled to ®t the variance, as in Carino et al. (1994). Table 7 displays the optimal solution of the stochastic programming model, based upon an event tree generated with the adjusted random sampling method. The optimal weight of stocks is 57% and average switching has decreased to 12.3%. Com- pared to Table 6 the average contribution rate jumps from 1.26% to 5.83%, while downside risk has increased. It seems clear that reducing the variance of a random sample and matching the mean can greatly reduce spurious pro®ts. The additional computational e€ort for adjusting the random sample is negligible. 4.3. Fitting the mean and the covariance matrix An alternative approach is to construct an event tree that ®ts the ®rst few moments of the underlying distribution by solving a non-linear optimization problem (Fleten et al., 1998). The decision variables of the optimization problem are the returns and the probabilities of the event tree, while the objective function and the constraints enforce the desired statistical properties. If all nodes of the event tree are considered simulta- neously as in H oyland and Wallace (1996), then it might take longer to construct a desirable event tree than to solve the stochastic programming model. Therefore, we simplify the problem and apply the tree construction method node by node in a forward recursion, while assuming the Mar- kov property for the timeseries. As the random generating process for our ALM problem is a VAR model (4), the Markov property holds. As an example, we write down the equations for a set of disturbances that ®t the residual covari- ance matrix of the VAR-process R. The proba- bilities are uniform in order to ease comparison with random sampling. Let i 2 f1; . . . ; Ig denote a random variable that is modeled by the VAR- process, for example the stock index return. A total of M succeeding nodes at time t are available to describe the conditional distribution of these random variables in a particular node at time t 1. We de®ne the disturbance uim as the real- ization in node m for the ith element of the vector t. Eq. (22) speci®es that the average of these dis- turbances should be zero. Eq. (23) speci®es that the disturbances should have a covariance matrix equal to R. 1 M X M mˆ1 uim ˆ 0 8i 2 f1; . . . ; Ig; …22† 1 …M 1† X M mˆ1 uimujm ˆ Rij 8i; j 2 f1; . . . ; Ig; …23† where uim is the disturbance for random variable i 2 f1; . . . ; Ig in node m 2 f1; . . . ; Mg. By using this ®xed set of disturbances in each node and applying the VAR-equation recursively, we generate an event tree that ®ts the time-varying conditional expectation and the covariance matrix of the distribution. Obtaining a solution to the non-linear system (22) and (23) might be dicult, specially when higher order moments like skew- ness and kurtosis are included. Like H oyland and Wallace (1996), we solve a non-linear optimization model that penalizes deviations from the desired moments in the objective function. Starting points are randomly sampled from the underlying distri- bution. The adjustment procedure of the previous sections could be applied to speedup convergence. We have applied this method to construct a ®t- ted 1-10-6-6-4-4 event tree. All probabilities are Table 7 Solution of SP model: Adjusted random sampling Initial asset mix Bonds Real Stocks 0.00 0.43 0.57 Switching Bonds Real Stocks (average absolute deviation) 0.16 0.09 0.12 Objective value 0.5013 Mean contribution rate (Mcr) 0.0583 Downside risk (Dm2) 0.0375 MAD contribution rates (Madcr) 0.0500 288 R. Kouwenberg / European Journal of Operational Research 134 (2001) 279±292
  • 11. uniform in order to ease comparison with the random sampling methods. With 4 succeeding nodes the mean and covariance matrix are ®tted, while with 6 or 10 succeeding nodes we also ®t the skewness and the kurtosis. Table 8 displays the optimal solution of the stochastic programming model based upon the ®tted event tree. The initial asset mix now consists of 33% stocks, 30% real estate and 37% bonds. Average switching of asset weights has been re- duced to 6%, while the average contribution rate equals 6.24%. It is hard to compare the quality of the optimal solutions based upon di€erent scenario generation methods, by solving the ALM-model just once. In Section 5, we will use rolling horizon simulations to investigate the issue of constructing event trees. 5. Rolling horizon simulations 5.1. Methodology The previous section demonstrates that the optimal solution of the stochastic program model depends on the method for constructing event trees. In order to test these methods empirically, we now perform rolling horizon simulations. We include a simple ®xed mix model in these test as a benchmark for the performance of the stochastic programming model. Golub et al. (1995) compare stochastic programming models for money man- agement to alternative planning models with a similar simulation framework. Fleten et al. (1998) use simulations for comparing the performance of a stochastic program and a ®xed model for a life insurance ALM problem. The purpose of the rolling horizon simulations is to investigate the results of implementing the optimal decisions of a model every year. We start by generating one path of realized returns for the next 5 years. At time zero we solve a ®xed mix or a stochastic programming model with a planning horizon of 5 years. We implement the initial op- timal decisions of the model and calculate the asset value of the pension fund at the end of the ®rst year. Next, the model is solved given the current state of the pension and with a planning horizon of 4 years. The optimal initial decisions are again implemented. This process is repeated until we know the ®nal state of the pension at end of year 5. By generating a large number of `realized return paths', we can estimate the average costs and risk of the planning model. The simulation process is now described formally: 1. Sample a path of realized returns for the peri- ods 1 to T. Start at the beginning of the initial period: t ˆ 1. 2. Construct an event tree conditional on the real- izations of the returns and the wage increase at the end of period t 1. Solve the stochastic programming model using this event tree and a planning horizon of T t ‡ 1 years, given the state of the pension fund at the end of pe- riod t 1. 3. Use the realized returns for period t to deter- mine the state of the pension fund at the end of period t, if the optimal initial decisions are implemented. 4. If t T, then t ˆ t ‡ 1 and return to step 2. 5. Store the average contribution rate and infor- mation about underfunding for this particular simulation run. Return to step 1, unless the number of simulation runs is sucient. A ®xed mix model is included in the simulation tests as a benchmark for the stochastic program- ming model. The ®xed model consists of the same equations as the stochastic programming model, but with additional linear constraints (24) for re- storing the asset weights to ®xed proportions every year. As the model is solved each year the resulting investment strategy will be dynamic, however these Table 8 Solution of SP model: Fitted tree Initial asset mix Bonds Real Stocks 0.37 0.30 0.33 Switching Bonds Real Stocks (average absolute deviation) 0.08 0.05 0.06 Objective value 0.5213 Mean contribution rate (Mcr) 0.0624 Downside risk (Dm2) 0.0346 MAD contribution rates (Madcr) 0.0494 R. Kouwenberg / European Journal of Operational Research 134 (2001) 279±292 289
  • 12. adjustments are not anticipated. The contribution rates for the ®xed mix model are set by the linear decision rule ((8) and (9)). First, we will consider a ®xed mix model with parameters a ˆ 1, cr ˆ 0:14 and F ˆ 1:15 for the funding rule. Second, the parameters a and cr will be optimized. The opti- mal ®xed mix and contribution rule parameters are determined by a brute force heuristic approach (grid search). wfixed i ˆ Xh itn X I jˆ1 Xh jtn; , i ˆ 1; . . . ; I; t ˆ 0; . . . ; T 1; n ˆ 1; . . . ; Nt; …24† where wfixed i is the ®xed weight for asset i. For the simulations a horizon of 5 years is used. At the end of the simulation run, total costs are computed by adding the sum of the contribution rates over 5 years and the equalizing contribution rate that lifts the ®nal funding ratio to 1:15 (if the ®nal funding ratio is below this level). Risk is measured by the second downside moment of the funding ratio in each simulation run. We use an antithetic sample of 1000 sce- narios for the simulations. The parameters of the models have the same values as in the previous section (Table 5). For the stochastic program- ming model event trees of size 1-10-6-6-4-4 are generated. 5 The ®xed ®x model is solved with a set of 500 linear scenarios (1-500-1-1-...). The simulations are repeated for seven levels of risk aversion k. 5.2. Results Table 9 shows the results of the rolling horizon simulations. For seven levels of risk aversion k the average costs, the average risk and the average asset mix switching over the simulation runs are reported. Figs. 3 and 4 display the average costs±risk combi- nations for the 7 risk aversion levels, connected by straight lines. In this way an ecient frontier of costs versus risk has been constructed. In Fig. 3 the benchmark for the stochastic programming models is the ®xed mix model with pre-speci®ed coecients for the funding rule, while in Fig. 4 the coecients of the funding rule have been optimized. The results show that the stochastic program- ming model with a randomly sampled event tree performs poorly. The performance improves drastically if the mean and variance of the random samples are adjusted. Even better results are achieved by the stochastic programming model based on ®tted event trees. Only with the latter method for constructing event trees the stochastic programming model strictly dominates the ®xed model with an optimal funding rule (Fig. 4). Table 9 shows that the average asset mix switching of the stochastic programming model with random sampling lies between 23.5% and 28.4%. With the adjusted random sampling method switching de- creases to 7.4±10.5%. The tree ®tting method fur- ther stabilizes the optimal decisions, with average switching levels between 2.5% and 7.7%. The performance of the adjusted random sam- pling method is quite close to the tree ®tting pro- cedure, with the largest deviations concentrated at high levels of risk aversion. This might be ex- plained by the additional information about co- variance, skewness and kurtosis included in the ®tted tree. The clustering technique of Carino et al. (1994) might improve performance, because in- formation about higher order moments is aggre- gated and extracted from a large random sample. The results of the simulations indicate that at least the ®rst few moments of the return distribution should be matched for the multi-stage stochastic programming ALM model proposed in this paper. Note that the stochastic programming model with adjusted random sampling and ®tted event trees outperforms the ®xed mix benchmark with a pre-speci®ed contribution rule (Fig. 3). To make sure that this result was not biased by the particular choice of parameters, we added the parameters a and cr of the contribution rule to the set of decision variables of the ®xed mix model. Fig. 4 shows that the performance of the ®xed mix model improves in 5 In the ®rst year of a simulation run the planning horizon of the model is 5 years and the size of the event tree is 1-10-6-6-4-4. In the second year of a simulation run the planning horizon of the model is 4 years and the size of the event tree is 1-10-6-6- 4; . . . ; in the ®fth year of a simulation run the size of the event tree is 1-10. 290 R. Kouwenberg / European Journal of Operational Research 134 (2001) 279±292
  • 13. Table 9 Rolling horizon simulationsa Stochastic programming model with random sampling Lambda 0 2 5 8 20 32 128 Costs 0.506 0.548 0.557 0.552 0.581 0.591 0.616 Risk 0.137 0.084 0.063 0.059 0.048 0.044 0.036 Switching 0.284 0.282 0.270 0.267 0.247 0.248 0.235 Stochastic programming model with adjusted random sampling Lambda 0 2 5 8 20 32 128 Costs 0.447 0.486 0.515 0.528 0.559 0.572 0.607 Risk 0.146 0.062 0.044 0.038 0.030 0.027 0.023 Switching 0.098 0.074 0.074 0.081 0.090 0.094 0.105 Stochastic programming model with tree ®tting Lambda 0 2 5 8 20 32 128 Costs 0.445 0.483 0.506 0.517 0.539 0.550 0.581 Risk 0.150 0.061 0.043 0.037 0.029 0.026 0.021 Switching 0.077 0.041 0.033 0.032 0.027 0.026 0.025 Fixed mix model Lambda 0 2 5 8 20 32 128 Costs 0.513 0.522 0.531 0.536 0.551 0.558 0.565 Risk 0.058 0.047 0.041 0.038 0.034 0.034 0.033 Switching 0.079 0.045 0.031 0.026 0.022 0.021 0.019 Fixed mix model with optimal funding rule Lambda 0 2 5 8 20 32 128 Costs 0.484 0.506 0.523 0.531 0.554 0.567 0.595 Risk 0.097 0.052 0.040 0.034 0.027 0.024 0.020 Switching 0.079 0.040 0.029 0.025 0.020 0.020 0.017 a Results are based on 1000 simulation scenarios for a horizon of 5 years, constructed with antithetic sampling. Costs represents the sum of the average contribution rates and the average ®nal contribution rate. Risk is the second downside moment of the funding ratio. Switching denotes the average absolute change of asset weights. Fig. 3. Ecient frontier of costs versus downside risk. Fig. 4. Ecient frontier of costs versus downside risk. R. Kouwenberg / European Journal of Operational Research 134 (2001) 279±292 291
  • 14. this case, however the stochastic programming model with ®tted event trees still outperforms the benchmark. At high levels of risk aversion the sto- chastic programming model and the ®xed mix model are quite close. This is reasonable as dynamic investment strategies might become less important at high levels of risk aversion (merely 3% average asset mix switching with ®tted trees). 6. Conclusions In this paper, we developed and tested methods to construct event trees for ALM models. We proposed a stochastic programming model for a Dutch pension fund. To construct event trees for the stochastic programming model we used ran- dom sampling, an adjusted random sampling ap- proach and a tree ®tting method. Rolling horizon simulations indicate that the random sampling approach might lead to excessive asset mix switching and spurious pro®ts. We considered an antithetic random sampling method that matches every odd moment of the distribution and the variance. The adjusted random sampling proce- dure considerably reduced the asset mix switching and drastically improved the performance of the ALM model. Next we proposed a tree ®tting technique based upon H oyland and Wallace (1996). The tree ®tting procedure slightly outper- formed the adjusted random sampling technique. Moreover, the stochastic programming ALM model with ®tted event trees strictly dominated the ®xed mix benchmark with an optimized funding rule. At low levels of risk aversion the dynamic investment strategies of the stochastic program- ming ALM model clearly resulted in a better tradeo€ between costs and risk than the ®xed mix ALM model. References Birge, J.R., 1985. Decomposition and partitioning methods for multi-stage stochastic linear programs. Operations Research 33, 989±1007. Birge, J.R., Qi, L., 1988. Computing block-angular Karmarkar projections with applications to stochastic programming. Management Science 34, 1472±1479. Boender, G.C.E., 1997. A hybrid simulation/optimisation scenario model for asset/liability management. European Journal of Operational Research 99, 126±135. Brennan, M.J., Schwartz, E.S., Lagnado, R., 1997. Strategic asset allocation. Journal of Economic Dynamics and Control 21, 1377±1403. Carino, D.R., Kent, T., Myers, D.H., Stacy, C., Sylvanus, M., Turner, A.L., Watanabe, K., Ziemba, W.T., 1994. The Russel±Yasuda Kasai model: An asset liability model for a Japanese insurance company using multistage stochastic programming. Interfaces 24 (1), 29±49. Consigli, G., Dempster, M.A.H., 1998. Dynamic stochastic programming for asset±liability management. Annals of Operations Research 81, 131±161. Dert, C.L., 1995. Asset liability management for pension funds: A multistage chance constrained programming approach, Ph.D. thesis, Erasmus University Rotterdam. Fleten, S.-E., H oyland, K., Wallace, S.W., 1998. The perfor- mance of stochastic dynamic and ®xed mix portfolio models. Department of Economics and Technology Man- agement, Norwegian University of Science and Technology. Floudas, C.A., Visweswaran, V., 1993. Primal±relaxed dual global optimization approach. Journal of Optimization Theory and Applications 78, 187±225. Golub, B., Holmer, M., McKendall, R., Pohlman, L., Zenios, S.A., 1995. A stochastic programming model for money management. European Journal of Operational Research 85, 282±296. Gondzio, J., 1995. HOPDM (version 2.12) ± a fast LP solver based on a primal±dual interior point method. European Journal of Operational Research 85, 221±225. H oyland, K., Wallace, S.W., 1996. Generating scenario trees for multi stage problems. Department of Economics and Technology Management, Norwegian University of Science and Technology. Klaassen, P., 1998. Financial asset-pricing theory and stochas- tic programming models for asset±liability management: A synthesis. Management Science 44, 31±48. Kusy, M.I., Ziemba, W.T., 1986. A bank asset and liability model. Operations Research 34, 356±376. Mulvey, J.M., Vladimirou, H., 1992. Stochastic network planning for ®nancial planning problems. Management Science 38, 1642±1664. Rockafellar, R.T., Wets, R.J.-B., 1991. Scenario and policy aggregation in optimization under uncertainty. Mathemat- ics of Operations Research 16, 119±147. Zenios, S.A., 1995. Asset/liability management under uncer- tainty for ®xed income securities. Annals of Operations Research 59, 77±98. 292 R. Kouwenberg / European Journal of Operational Research 134 (2001) 279±292