SlideShare a Scribd company logo
1 of 48
Economic Growth:
The Short Run vs. the Long Run
Time
National
economic
output
Actual output
Potential output
Business cycles
in the short run
Economic growth
in the long run
Downswing
Upswing
The crisis of 1997-98
is irrelevant to Asia’s
long-term growth potential.
Economic Growth:
The Short Run vs. the Long Run
To analyze the movements of actual output
from year to year, viz., in the short run
Need short-run macroeconomic theory
Keynesian or neoclassical
To analyze the path of potential output over
long periods
Need modern theory of economic growth
Neoclassical or endogenous
The Neoclassical Theory of
Exogenous Economic Growth
Traces the rate of growth of output
per capita to a single source:
Technological progress
Hence, economic growth in the
long run is immune to economic
policy, good or bad.
“To change the rate of growth of real
output per head you have to change the
rate of technical progress.”
ROBERT M. SOLOW
The New Theory of Endogenous
Economic Growth
Traces the rate of growth of output per
capita to three main sources:
Saving
Efficiency
Depreciation
“The proximate causes of economic growth are
the effort to economize, the accumulation of
knowledge, and the accumulation of capital.”
W. ARTHUR LEWIS
Exogenous vs. Endogenous
Growth
The neoclassical view
that economic growth in the long run is merely a
matter of technology
The new view
that long-run growth depends on saving,
efficiency, and depreciation is more illuminating.
A Simple Model of
Endogenous Growth
Four building blocks:
 S = I
Saving equals investment in equilibrium.
 S = sY
Saving is proportional to income.
 I = K + K
Investment involves addition to capital stock.
 Y = EK
Output depends on quality and quantity of capital.
A Simple Model of
Endogenous Growth
Implication:
 g = sE - 
Rate of economic growth equals
 Saving rate
times
 Efficiency (i.e., the output/capital ratio)
minus
 Depreciation
Endogenous Growth in the
Harrod-Domar Model
You may recognize the
endogenous growth model as
a reinterpretation of the
Harrod-Domar model
where growth depends on
A. the saving rate
B. the capital/output ratio
C. the depreciation rate
Sources of Endogenous
Growth I
Saving
Important implication for economic policy:
Economic stability with low inflation and positive real
interest rates spurs saving, which is good for growth.
Sources of Endogenous
Growth I
100
400
300
200
1965 1990
East Asia
OECD
Africa
Income
per capita
Sources of Endogenous
Growth II
Depreciation
The effect of depreciation on growth is related
to that of saving and investment on growth.
Unprofitable investment in the past reduces
the quality of capital and makes it depreciate
more rapidly, necessitating more replacement
investment to make up for economic and
physical wear and tear.
The more national saving has to be set aside
for replacement investment, the less will be
available for the buildup of new capital.
Investment: Quantity and
Quality
Compare Botswana and Tanzania:
In Botswana, the share of State-Owned
Enterprises in total investment fell from
16% in 1985-90 to 12% in 1990-97.
In Tanzania, the SOE share of investment
fell from 46% in 1985-90 to 23% in
1990-97.
This is probably a good sign.
Privatization helps improve investment.
Investment: Quantity and
Quality
Investment quality, however, is not
only a question of public vs. private
enterprise.
Sound banking is also important.
It takes sound commercial banks,
usually privately owned banks
motivated by profit rather than by
political concerns, to channel
household savings into high-quality
investment.
Sources of Endogenous
Growth III
Efficiency
Also fits real world experience quite well
Technical progress is good for growth because it allows
us to squeeze more output out of given inputs.
And that is exactly what increased efficiency is all
about!
Thus, technology is best viewed as an aspect of
general economic efficiency.
Important implication for economic policy:
Everything that increases economic efficiency, no
matter what, is also good for growth.
Sources of Endogenous
Growth III
Five sources of increased efficiency
1. Liberalization of prices and trade increases
efficiency, which is good for growth.
2. Stabilization reduces the inefficiency associated
with inflation, which is good for growth.
3. Privatization reduces the inefficiency associated
with state-owned enterprises, which …
4. Education makes the labor force more efficient.
5. Technological progress also enhances efficiency.
The possibilities are virtually endless!
Sources of Endogenous
Growth III
This is good news.
If growth were merely a matter of technology,
we would not be able to do much about it …
… except to follow technology-friendly policies by
supporting R&D and such.
But if growth depends on saving and efficiency,
there are things that we can do, in the private
sector as well as through the public sector, to
foster rapid economic growth.
Because everything that is good for saving and
efficiency is also good for growth.
What to Do to Encourage
Economic Growth
Maintain strong incentives to save
Keep inflation low and real interest rates positive
Maintain financial system in good health
so as to channel saving into high-quality investment
Foster efficiency
1. Liberal price and trade regimes
2. Low inflation
3. Strong private sector
4. More and better education
5. Limited, or well managed, natural resources
Liberalization and Economic
Growth
Liberalization of prices means that markets,
not bureaucrats, are allowed to set prices.
Mixed market economy is more efficient than
central planning.
 Compare former Soviet Union with the US and Europe
Liberalization of trade allows specialization
according to comparative advantage.
Free trade is more efficient than self-sufficiency.
 North Korea and Cuba vs. Hong Kong and Singapore
Applies to trade in goods, services, capital.
1
Liberalization Increases
Economic Efficiency
G
E
C
Traditional
output
Modern output
H
D Domestic,
distorted
price ratio
O
Liberalization Increases
Economic Efficiency
G
F
A B
C
Output
gain
Traditional
output
Modern output
D
H
E
Price
distortion
World price ratio
Domestic,
distorted
price ratio
If output gain = E and
price distortion = c,
then E = mc2
OC = modern output
CA = traditional output
OA = total output
O
Liberalization Increases
Economic Efficiency
G
F
A B
C
Output
gain
Traditional
output
Modern output
D
H
E
Price
distortion
World price ratio
Domestic,
distorted
price ratio
O
J K
Imports
Exports
Welfare
gain
Liberalization Increases
Economic Efficiency
G
F
A B
C
Traditional
output
Modern output
D
H
E
Price
distortion
O
J
Welfare
gain
M
N
Q
Transition
takes time:
From E to F
via M, N,
and Q
Liberalization Increases
Economic Efficiency
D
G
F
E
A
B
Price
distortion
J
O
H
World price
ratio
C
AB = static gain
BC = dynamic gain
AC = AB + BC = total gain
Productivity
gain
K
Welfare
gain
Traditional
output
Modern output
Growth and Trade,
1965-98
105
countries
-6
-4
-2
0
2
4
6
8
10
0 50 100 150 200 250 300 350
Trade (% of ppp-adjusted GDP)
Growth
per
capita
(%
per
year)
NB: UAE, Hong Kong, and Singapore.
Singapore
Hong Kong
United Arab Emirates
China
Korea
Botswana
Each 50 percentage point increase
in the trade ratio is associated
with an increase in per capita
growth by almost 1% per year.
Growth and Trade,
1965-98
32 sub-
Saharan
African
countries
-6
-4
-2
0
2
4
6
8
10
0 20 40 60 80 100
Trade (% of ppp-adjusted GDP)
Growth
per
capita
(%
per
year) Each 20 percentage point
increase in the trade ratio is
associated with an increase in per
capita growth by 1% per year.
Growth and Foreign Direct
Investment, 1965-98
100
countries
-4
-2
0
2
4
6
8
10
0 2 4 6 8 10 12 14
Foreign direct investment (% of ppp-adjusted GDP)
Growth
per
capita
(%
per
year)
Qualification: Relationship rests on Botswana and Singapore.
Botswana
Singapore
Each three percentage
point increase in the
FDI ratio is associated
with an increase in
per capita growth by
almost 1% per year.
Growth and Foreign Direct
Investment, 1965-98
-4
-2
0
2
4
6
8
10
0 2 4 6 8
Foreign direct investment (% of ppp-adjusted GDP)
Growth
per
capita
(%
per
year) Each one percentage point increase in the
FDI ratio is associated with an increase in
per capita growth by almost 1% per year.
31 sub-
Saharan
African
countries
Relationship depends on the inclusion of Botswana.
Botswana
Stabilization and Economic
Growth
Stabilization of prices means that distortions
associated with inflation are reduced.
 Inflation distorts the choice between real and
financial capital by punishing money holdings,
and thus creates inefficiency in production.
 Inflation thus involves a tax, the inflation tax.
An inefficient tax compared with most other taxes.
 Inflation also creates uncertainly which tends
to discourage trade and investment.
 Inflation also tends to result in overvaluation
of currency, thus hurting exports and growth.
2
Stabilization Increases
Economic Efficiency
Financial capital
Real
capital
Undistorted
price ratio
G
F
E
A
Inflation
distortion
45°
Output after
Output before
Distorted
price ratio
C
D
H
O B
Output
gain
If output gain = E and
inflation distortion = c,
then, again, E = mc2
Privatization and Economic
Growth
Privatization means that profit-oriented
owners and able managers are allowed to
direct enterprises.
Profit motive replaces political considerations as
the guiding principle of business operations.
Profit-maximizing owners generally want to appoint
managers and staff on merit rather than on the
basis of political connections, for example.
Private enterprise is generally more efficient
than state-owned enterprises.
3
Privatization Increases
Economic Efficiency
Private output
Public
output
Undistorted
price ratio
D
G
Distorted
price ratio
F
E
A B
N
Price and
quality
distortion
H
O
J
K
45°
Output
gain
Same Story Time and
Again
Free trade is good for growth
Reduces the inefficiency that results from
restrictions on trade
Price stability is good for growth
Reduces inefficiency resulting from inflation
Privatization is good for growth
Reduces inefficiency resulting from SOEs
Education is good for growth
Reduces the inefficiency that results from
inadequate education
Same Story Time and
Again
Can describe this by simple arithmetic
The efficiency gain from eliminating an
economic distortion (trade restrictions,
inflation, unnecessary state intervention,
insufficient education) is directly
proportional to the square of the
distortion:
E = mc2
E stands for efficiency gain, m is a multiplicative
constant, and c is the distortion
E = mc2
If the distortion is substantial (severe
trade restrictions, high inflation, big SOE
sector, poor education), then reducing or
eliminating the distortion can increase
efficiency and growth a great deal.
We can see this by plugging appropriate
numbers into the formula and also by
econometric research, where the theory
is compared with experience (i.e.,
economic statistics).
Education and Economic
Growth
Education means a better trained and hence
more efficient work force.
 Need to provide primary and secondary
education to all, especially females
 Need to provide tertiary education to a greatly
increased number of people
 Need increased public commitment to education
 This requires both increased public expenditure
on education and probably also increased scope
for private sector involvement in education.
4
Growth and Education,
1965-98
86
countries
-4
-2
0
2
4
6
8
10
0 20 40 60 80 100 120 140
Secondary-school enrolment 1980-97 (%)
Growth
per
capita
(%
per
year)
An increase in
secondary-school
enrolment by 40%
of each cohort goes
along with an
increase in per
capita growth by
1% per year.
Growth and Education,
1965-98
-6
-4
-2
0
2
4
6
8
10
0 1 2 3 4 5 6 7 8
Public expenditure on education (% of GNP)
Growth
per
capita
(%
per
year) Each two percentage point
increase in the education
expenditure ratio is associated
with an increase in per capita
growth by about 1% per year.
33 sub-
Saharan
African
countries
Natural Resources and
Economic Growth
Natural resources, if not well managed,
may turn out to be, at best, a mixed
blessing.
Three possible channels
 Education
 Dutch disease
 Rent seeking
What is the evidence?
5
Natural Resources and
Economic Growth 1965-98
Abundant natural resources, if not well managed,
appear harmful to growth.
-4
-2
0
2
4
6
8
10
0 10 20 30 40 50 60
Share of natural capital in national wealth (%)
Growth
per
capita
(%
per
year)
86
countries
A ten percentage point
increase in the natural
capital share goes along
with a decrease in per
capita growth by nearly
1% per year.
Natural Resources and
Education
90
countries
0
1
2
3
4
5
6
7
8
9
0 10 20 30 40 50 60
Share of natural capital in national wealth (%)
Public
expenditure
on
education
(%
of
GNP) An 18 percentage point
increase in the natural
capital share is associated
with a decrease in public
expenditure on education
by 1% of GNP.
Abundant
natural
resources
appear to
crowd out
human
resources.
Natural Resources and
Corruption
Abundant
natural
resources
appear to
go along
with
corruption.
0
1
2
3
4
5
6
7
8
9
10
0 5 10 15 20 25
Share of natural capital in national wealth (%)
Corruption
index
New Zealand
45
countries
What Is the Upshot?
Economic growth responds to public
policy.
In particular, by encouraging
saving and investment of high quality
foreign trade and investment
education
... the government can help foster
rapid economic growth.
Sir Arthur Lewis Got It Right
Since the second world
war it has become
quite clear that rapid
economic growth is
available to those
countries with
adequate natural
resources which make
the effort to achieve it.
W. ARTHUR LEWIS
(1968)
What Else?
These lessons are borne out by experience
from around the world.
Additional lessons:
Too much inflation hurts saving, investment,
and trade — and thereby also growth.
Too much SOE activity hurts the quality of
investment and education — and growth.
Too much agriculture and, more generally,
natural resource dependence, if not well
managed, hurts education and trade — and
thereby also growth.
Too rapid population growth also tends to
impede economic growth.
Reservations
Even so, the question of rapid growth is, of
course, a bit more complicated.
We also need to address a host of political,
social, and cultural questions as well as
questions of natural conditions, climate,
and public health — which would take us
too far afield.
But the main point remains:
 To grow or not to grow is in large measure a
matter of choice.
 Many of the constraints on growth are man-
made, and can be removed.
In Conclusion: It Can Be
Done
Economic growth makes a difference,
especially in poor countries.
A question literally of life and death
And not only in poor countries,
for there is poverty amid plenty in rich countries
Recall the main point of Gunnar Myrdal’s Asian
Drama (1968):
It was that the Asian economies were incapable of
rapid economic growth!
New growth theory suggests that similar claims
about Africa will also be proven wrong.
In Conclusion: It Can Be
Done
There has been much progress in economic
policy and performance around the world in
the 1990s.
Growth-friendly reforms have been widely
embraced
among ordinary people and politicians across the
political spectrum, not only in Asia, but also,
increasingly, in other parts of the world, including
Africa.
Yet, various special interest groups try to
resist.
‘Reformers have the
idea that change can be
achieved by brute
sanity.’
George Bernard Shaw
To grow or not to grow
is in large measure a
matter of choice.
These slides can be viewed on my website:
www.hi.is/~gylfason/copenhagen.ppt
In Conclusion: It Can Be
Done

More Related Content

Similar to endogenous 1.ppt

Week 9 slides growth&business cycle [core]
Week 9 slides  growth&business cycle [core]Week 9 slides  growth&business cycle [core]
Week 9 slides growth&business cycle [core]Nicooooleeee
 
Week9slidesgrowthbusinesscyclecore 130605145537-phpapp02
Week9slidesgrowthbusinesscyclecore 130605145537-phpapp02Week9slidesgrowthbusinesscyclecore 130605145537-phpapp02
Week9slidesgrowthbusinesscyclecore 130605145537-phpapp02ANDISIWE MKWAMBI
 
28 things about economics
28 things about economics28 things about economics
28 things about economicsGon1440
 
Inflation and small and medium enterprises growth in ogbomoso
Inflation and small and medium enterprises growth in ogbomosoInflation and small and medium enterprises growth in ogbomoso
Inflation and small and medium enterprises growth in ogbomosoAlexander Decker
 
Causes of Economic Growth
Causes of Economic GrowthCauses of Economic Growth
Causes of Economic GrowthHugo OGrady
 
Economics chapters 7 to 11
Economics chapters  7 to 11Economics chapters  7 to 11
Economics chapters 7 to 11Kayra Terrazas
 
Ch 12 presentation
Ch 12 presentationCh 12 presentation
Ch 12 presentationkrobinette
 
Aggregate Supply / Aggregate Demand Model
Aggregate Supply / Aggregate Demand ModelAggregate Supply / Aggregate Demand Model
Aggregate Supply / Aggregate Demand ModelKaysee Das
 
The impact of foreign direct investment [fdi] on poverty reduction in nigeria
The impact of foreign direct investment [fdi] on poverty reduction in nigeriaThe impact of foreign direct investment [fdi] on poverty reduction in nigeria
The impact of foreign direct investment [fdi] on poverty reduction in nigeriaAlexander Decker
 
Macro diagrams and definitions
Macro diagrams and definitionsMacro diagrams and definitions
Macro diagrams and definitions12jostma
 

Similar to endogenous 1.ppt (18)

25
2525
25
 
Inflation.pdf
Inflation.pdfInflation.pdf
Inflation.pdf
 
Week 9 slides growth&business cycle [core]
Week 9 slides  growth&business cycle [core]Week 9 slides  growth&business cycle [core]
Week 9 slides growth&business cycle [core]
 
Week9slidesgrowthbusinesscyclecore 130605145537-phpapp02
Week9slidesgrowthbusinesscyclecore 130605145537-phpapp02Week9slidesgrowthbusinesscyclecore 130605145537-phpapp02
Week9slidesgrowthbusinesscyclecore 130605145537-phpapp02
 
28 things about economics
28 things about economics28 things about economics
28 things about economics
 
Causes
CausesCauses
Causes
 
Inflation and its impact
Inflation and its impactInflation and its impact
Inflation and its impact
 
Essay About Economy
Essay About EconomyEssay About Economy
Essay About Economy
 
Essay About Economy
Essay About EconomyEssay About Economy
Essay About Economy
 
Inflation and small and medium enterprises growth in ogbomoso
Inflation and small and medium enterprises growth in ogbomosoInflation and small and medium enterprises growth in ogbomoso
Inflation and small and medium enterprises growth in ogbomoso
 
Causes of Economic Growth
Causes of Economic GrowthCauses of Economic Growth
Causes of Economic Growth
 
National income
National incomeNational income
National income
 
Economics chapters 7 to 11
Economics chapters  7 to 11Economics chapters  7 to 11
Economics chapters 7 to 11
 
Ch 12 presentation
Ch 12 presentationCh 12 presentation
Ch 12 presentation
 
Business cycles
Business cyclesBusiness cycles
Business cycles
 
Aggregate Supply / Aggregate Demand Model
Aggregate Supply / Aggregate Demand ModelAggregate Supply / Aggregate Demand Model
Aggregate Supply / Aggregate Demand Model
 
The impact of foreign direct investment [fdi] on poverty reduction in nigeria
The impact of foreign direct investment [fdi] on poverty reduction in nigeriaThe impact of foreign direct investment [fdi] on poverty reduction in nigeria
The impact of foreign direct investment [fdi] on poverty reduction in nigeria
 
Macro diagrams and definitions
Macro diagrams and definitionsMacro diagrams and definitions
Macro diagrams and definitions
 

More from NanoSana

Lecture 1 (1).ppt
Lecture 1 (1).pptLecture 1 (1).ppt
Lecture 1 (1).pptNanoSana
 
978129.PPT
978129.PPT978129.PPT
978129.PPTNanoSana
 
solow%20lecture11.pptx
solow%20lecture11.pptxsolow%20lecture11.pptx
solow%20lecture11.pptxNanoSana
 
3377928.ppt
3377928.ppt3377928.ppt
3377928.pptNanoSana
 
solow lecture.ppt
solow lecture.pptsolow lecture.ppt
solow lecture.pptNanoSana
 
history expectation and growth 1.ppt
history expectation and growth 1.ppthistory expectation and growth 1.ppt
history expectation and growth 1.pptNanoSana
 
transportation_model.ppt
transportation_model.ppttransportation_model.ppt
transportation_model.pptNanoSana
 
Economic theories and perspectives on development1 (1).ppt
Economic theories and perspectives on development1 (1).pptEconomic theories and perspectives on development1 (1).ppt
Economic theories and perspectives on development1 (1).pptNanoSana
 
KOSHI PCMD M & E .ppt
KOSHI PCMD M & E .pptKOSHI PCMD M & E .ppt
KOSHI PCMD M & E .pptNanoSana
 
ch11lect-project-management.ppt
ch11lect-project-management.pptch11lect-project-management.ppt
ch11lect-project-management.pptNanoSana
 
Business_5-JLang.ppt
Business_5-JLang.pptBusiness_5-JLang.ppt
Business_5-JLang.pptNanoSana
 
3c66a73971f4307a1e447e4bf76e0c3d_MIT1_040s09_lec02.pdf
3c66a73971f4307a1e447e4bf76e0c3d_MIT1_040s09_lec02.pdf3c66a73971f4307a1e447e4bf76e0c3d_MIT1_040s09_lec02.pdf
3c66a73971f4307a1e447e4bf76e0c3d_MIT1_040s09_lec02.pdfNanoSana
 
42da6c0a8a35bb6c9e0bbb89ad429678_MIT1_040s09_lec01.pdf
42da6c0a8a35bb6c9e0bbb89ad429678_MIT1_040s09_lec01.pdf42da6c0a8a35bb6c9e0bbb89ad429678_MIT1_040s09_lec01.pdf
42da6c0a8a35bb6c9e0bbb89ad429678_MIT1_040s09_lec01.pdfNanoSana
 
M3_S0_overview-PFP_180916_KSD.pptx
M3_S0_overview-PFP_180916_KSD.pptxM3_S0_overview-PFP_180916_KSD.pptx
M3_S0_overview-PFP_180916_KSD.pptxNanoSana
 

More from NanoSana (18)

Lecture 1 (1).ppt
Lecture 1 (1).pptLecture 1 (1).ppt
Lecture 1 (1).ppt
 
978129.PPT
978129.PPT978129.PPT
978129.PPT
 
solow%20lecture11.pptx
solow%20lecture11.pptxsolow%20lecture11.pptx
solow%20lecture11.pptx
 
3377928.ppt
3377928.ppt3377928.ppt
3377928.ppt
 
solow lecture.ppt
solow lecture.pptsolow lecture.ppt
solow lecture.ppt
 
history expectation and growth 1.ppt
history expectation and growth 1.ppthistory expectation and growth 1.ppt
history expectation and growth 1.ppt
 
transportation_model.ppt
transportation_model.ppttransportation_model.ppt
transportation_model.ppt
 
Economic theories and perspectives on development1 (1).ppt
Economic theories and perspectives on development1 (1).pptEconomic theories and perspectives on development1 (1).ppt
Economic theories and perspectives on development1 (1).ppt
 
KOSHI PCMD M & E .ppt
KOSHI PCMD M & E .pptKOSHI PCMD M & E .ppt
KOSHI PCMD M & E .ppt
 
ch11lect-project-management.ppt
ch11lect-project-management.pptch11lect-project-management.ppt
ch11lect-project-management.ppt
 
Business_5-JLang.ppt
Business_5-JLang.pptBusiness_5-JLang.ppt
Business_5-JLang.ppt
 
3c66a73971f4307a1e447e4bf76e0c3d_MIT1_040s09_lec02.pdf
3c66a73971f4307a1e447e4bf76e0c3d_MIT1_040s09_lec02.pdf3c66a73971f4307a1e447e4bf76e0c3d_MIT1_040s09_lec02.pdf
3c66a73971f4307a1e447e4bf76e0c3d_MIT1_040s09_lec02.pdf
 
42da6c0a8a35bb6c9e0bbb89ad429678_MIT1_040s09_lec01.pdf
42da6c0a8a35bb6c9e0bbb89ad429678_MIT1_040s09_lec01.pdf42da6c0a8a35bb6c9e0bbb89ad429678_MIT1_040s09_lec01.pdf
42da6c0a8a35bb6c9e0bbb89ad429678_MIT1_040s09_lec01.pdf
 
lec11.ppt
lec11.pptlec11.ppt
lec11.ppt
 
M3_S0_overview-PFP_180916_KSD.pptx
M3_S0_overview-PFP_180916_KSD.pptxM3_S0_overview-PFP_180916_KSD.pptx
M3_S0_overview-PFP_180916_KSD.pptx
 
lec3.ppt
lec3.pptlec3.ppt
lec3.ppt
 
lec4.ppt
lec4.pptlec4.ppt
lec4.ppt
 
lec6.ppt
lec6.pptlec6.ppt
lec6.ppt
 

Recently uploaded

Accessible design: Minimum effort, maximum impact
Accessible design: Minimum effort, maximum impactAccessible design: Minimum effort, maximum impact
Accessible design: Minimum effort, maximum impactdawncurless
 
Hybridoma Technology ( Production , Purification , and Application )
Hybridoma Technology  ( Production , Purification , and Application  ) Hybridoma Technology  ( Production , Purification , and Application  )
Hybridoma Technology ( Production , Purification , and Application ) Sakshi Ghasle
 
Organic Name Reactions for the students and aspirants of Chemistry12th.pptx
Organic Name Reactions  for the students and aspirants of Chemistry12th.pptxOrganic Name Reactions  for the students and aspirants of Chemistry12th.pptx
Organic Name Reactions for the students and aspirants of Chemistry12th.pptxVS Mahajan Coaching Centre
 
Call Girls in Dwarka Mor Delhi Contact Us 9654467111
Call Girls in Dwarka Mor Delhi Contact Us 9654467111Call Girls in Dwarka Mor Delhi Contact Us 9654467111
Call Girls in Dwarka Mor Delhi Contact Us 9654467111Sapana Sha
 
BASLIQ CURRENT LOOKBOOK LOOKBOOK(1) (1).pdf
BASLIQ CURRENT LOOKBOOK  LOOKBOOK(1) (1).pdfBASLIQ CURRENT LOOKBOOK  LOOKBOOK(1) (1).pdf
BASLIQ CURRENT LOOKBOOK LOOKBOOK(1) (1).pdfSoniaTolstoy
 
call girls in Kamla Market (DELHI) 🔝 >༒9953330565🔝 genuine Escort Service 🔝✔️✔️
call girls in Kamla Market (DELHI) 🔝 >༒9953330565🔝 genuine Escort Service 🔝✔️✔️call girls in Kamla Market (DELHI) 🔝 >༒9953330565🔝 genuine Escort Service 🔝✔️✔️
call girls in Kamla Market (DELHI) 🔝 >༒9953330565🔝 genuine Escort Service 🔝✔️✔️9953056974 Low Rate Call Girls In Saket, Delhi NCR
 
Presiding Officer Training module 2024 lok sabha elections
Presiding Officer Training module 2024 lok sabha electionsPresiding Officer Training module 2024 lok sabha elections
Presiding Officer Training module 2024 lok sabha electionsanshu789521
 
URLs and Routing in the Odoo 17 Website App
URLs and Routing in the Odoo 17 Website AppURLs and Routing in the Odoo 17 Website App
URLs and Routing in the Odoo 17 Website AppCeline George
 
The basics of sentences session 2pptx copy.pptx
The basics of sentences session 2pptx copy.pptxThe basics of sentences session 2pptx copy.pptx
The basics of sentences session 2pptx copy.pptxheathfieldcps1
 
microwave assisted reaction. General introduction
microwave assisted reaction. General introductionmicrowave assisted reaction. General introduction
microwave assisted reaction. General introductionMaksud Ahmed
 
Science 7 - LAND and SEA BREEZE and its Characteristics
Science 7 - LAND and SEA BREEZE and its CharacteristicsScience 7 - LAND and SEA BREEZE and its Characteristics
Science 7 - LAND and SEA BREEZE and its CharacteristicsKarinaGenton
 
Presentation by Andreas Schleicher Tackling the School Absenteeism Crisis 30 ...
Presentation by Andreas Schleicher Tackling the School Absenteeism Crisis 30 ...Presentation by Andreas Schleicher Tackling the School Absenteeism Crisis 30 ...
Presentation by Andreas Schleicher Tackling the School Absenteeism Crisis 30 ...EduSkills OECD
 
POINT- BIOCHEMISTRY SEM 2 ENZYMES UNIT 5.pptx
POINT- BIOCHEMISTRY SEM 2 ENZYMES UNIT 5.pptxPOINT- BIOCHEMISTRY SEM 2 ENZYMES UNIT 5.pptx
POINT- BIOCHEMISTRY SEM 2 ENZYMES UNIT 5.pptxSayali Powar
 
How to Configure Email Server in Odoo 17
How to Configure Email Server in Odoo 17How to Configure Email Server in Odoo 17
How to Configure Email Server in Odoo 17Celine George
 
Enzyme, Pharmaceutical Aids, Miscellaneous Last Part of Chapter no 5th.pdf
Enzyme, Pharmaceutical Aids, Miscellaneous Last Part of Chapter no 5th.pdfEnzyme, Pharmaceutical Aids, Miscellaneous Last Part of Chapter no 5th.pdf
Enzyme, Pharmaceutical Aids, Miscellaneous Last Part of Chapter no 5th.pdfSumit Tiwari
 
SOCIAL AND HISTORICAL CONTEXT - LFTVD.pptx
SOCIAL AND HISTORICAL CONTEXT - LFTVD.pptxSOCIAL AND HISTORICAL CONTEXT - LFTVD.pptx
SOCIAL AND HISTORICAL CONTEXT - LFTVD.pptxiammrhaywood
 
Software Engineering Methodologies (overview)
Software Engineering Methodologies (overview)Software Engineering Methodologies (overview)
Software Engineering Methodologies (overview)eniolaolutunde
 

Recently uploaded (20)

Accessible design: Minimum effort, maximum impact
Accessible design: Minimum effort, maximum impactAccessible design: Minimum effort, maximum impact
Accessible design: Minimum effort, maximum impact
 
Hybridoma Technology ( Production , Purification , and Application )
Hybridoma Technology  ( Production , Purification , and Application  ) Hybridoma Technology  ( Production , Purification , and Application  )
Hybridoma Technology ( Production , Purification , and Application )
 
Organic Name Reactions for the students and aspirants of Chemistry12th.pptx
Organic Name Reactions  for the students and aspirants of Chemistry12th.pptxOrganic Name Reactions  for the students and aspirants of Chemistry12th.pptx
Organic Name Reactions for the students and aspirants of Chemistry12th.pptx
 
Call Girls in Dwarka Mor Delhi Contact Us 9654467111
Call Girls in Dwarka Mor Delhi Contact Us 9654467111Call Girls in Dwarka Mor Delhi Contact Us 9654467111
Call Girls in Dwarka Mor Delhi Contact Us 9654467111
 
BASLIQ CURRENT LOOKBOOK LOOKBOOK(1) (1).pdf
BASLIQ CURRENT LOOKBOOK  LOOKBOOK(1) (1).pdfBASLIQ CURRENT LOOKBOOK  LOOKBOOK(1) (1).pdf
BASLIQ CURRENT LOOKBOOK LOOKBOOK(1) (1).pdf
 
call girls in Kamla Market (DELHI) 🔝 >༒9953330565🔝 genuine Escort Service 🔝✔️✔️
call girls in Kamla Market (DELHI) 🔝 >༒9953330565🔝 genuine Escort Service 🔝✔️✔️call girls in Kamla Market (DELHI) 🔝 >༒9953330565🔝 genuine Escort Service 🔝✔️✔️
call girls in Kamla Market (DELHI) 🔝 >༒9953330565🔝 genuine Escort Service 🔝✔️✔️
 
Presiding Officer Training module 2024 lok sabha elections
Presiding Officer Training module 2024 lok sabha electionsPresiding Officer Training module 2024 lok sabha elections
Presiding Officer Training module 2024 lok sabha elections
 
URLs and Routing in the Odoo 17 Website App
URLs and Routing in the Odoo 17 Website AppURLs and Routing in the Odoo 17 Website App
URLs and Routing in the Odoo 17 Website App
 
Código Creativo y Arte de Software | Unidad 1
Código Creativo y Arte de Software | Unidad 1Código Creativo y Arte de Software | Unidad 1
Código Creativo y Arte de Software | Unidad 1
 
The basics of sentences session 2pptx copy.pptx
The basics of sentences session 2pptx copy.pptxThe basics of sentences session 2pptx copy.pptx
The basics of sentences session 2pptx copy.pptx
 
microwave assisted reaction. General introduction
microwave assisted reaction. General introductionmicrowave assisted reaction. General introduction
microwave assisted reaction. General introduction
 
Science 7 - LAND and SEA BREEZE and its Characteristics
Science 7 - LAND and SEA BREEZE and its CharacteristicsScience 7 - LAND and SEA BREEZE and its Characteristics
Science 7 - LAND and SEA BREEZE and its Characteristics
 
Presentation by Andreas Schleicher Tackling the School Absenteeism Crisis 30 ...
Presentation by Andreas Schleicher Tackling the School Absenteeism Crisis 30 ...Presentation by Andreas Schleicher Tackling the School Absenteeism Crisis 30 ...
Presentation by Andreas Schleicher Tackling the School Absenteeism Crisis 30 ...
 
Staff of Color (SOC) Retention Efforts DDSD
Staff of Color (SOC) Retention Efforts DDSDStaff of Color (SOC) Retention Efforts DDSD
Staff of Color (SOC) Retention Efforts DDSD
 
POINT- BIOCHEMISTRY SEM 2 ENZYMES UNIT 5.pptx
POINT- BIOCHEMISTRY SEM 2 ENZYMES UNIT 5.pptxPOINT- BIOCHEMISTRY SEM 2 ENZYMES UNIT 5.pptx
POINT- BIOCHEMISTRY SEM 2 ENZYMES UNIT 5.pptx
 
How to Configure Email Server in Odoo 17
How to Configure Email Server in Odoo 17How to Configure Email Server in Odoo 17
How to Configure Email Server in Odoo 17
 
Model Call Girl in Bikash Puri Delhi reach out to us at 🔝9953056974🔝
Model Call Girl in Bikash Puri  Delhi reach out to us at 🔝9953056974🔝Model Call Girl in Bikash Puri  Delhi reach out to us at 🔝9953056974🔝
Model Call Girl in Bikash Puri Delhi reach out to us at 🔝9953056974🔝
 
Enzyme, Pharmaceutical Aids, Miscellaneous Last Part of Chapter no 5th.pdf
Enzyme, Pharmaceutical Aids, Miscellaneous Last Part of Chapter no 5th.pdfEnzyme, Pharmaceutical Aids, Miscellaneous Last Part of Chapter no 5th.pdf
Enzyme, Pharmaceutical Aids, Miscellaneous Last Part of Chapter no 5th.pdf
 
SOCIAL AND HISTORICAL CONTEXT - LFTVD.pptx
SOCIAL AND HISTORICAL CONTEXT - LFTVD.pptxSOCIAL AND HISTORICAL CONTEXT - LFTVD.pptx
SOCIAL AND HISTORICAL CONTEXT - LFTVD.pptx
 
Software Engineering Methodologies (overview)
Software Engineering Methodologies (overview)Software Engineering Methodologies (overview)
Software Engineering Methodologies (overview)
 

endogenous 1.ppt

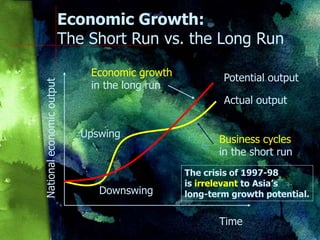
  • 1. Economic Growth: The Short Run vs. the Long Run Time National economic output Actual output Potential output Business cycles in the short run Economic growth in the long run Downswing Upswing The crisis of 1997-98 is irrelevant to Asia’s long-term growth potential.
  • 2. Economic Growth: The Short Run vs. the Long Run To analyze the movements of actual output from year to year, viz., in the short run Need short-run macroeconomic theory Keynesian or neoclassical To analyze the path of potential output over long periods Need modern theory of economic growth Neoclassical or endogenous
  • 3. The Neoclassical Theory of Exogenous Economic Growth Traces the rate of growth of output per capita to a single source: Technological progress Hence, economic growth in the long run is immune to economic policy, good or bad. “To change the rate of growth of real output per head you have to change the rate of technical progress.” ROBERT M. SOLOW
  • 4. The New Theory of Endogenous Economic Growth Traces the rate of growth of output per capita to three main sources: Saving Efficiency Depreciation “The proximate causes of economic growth are the effort to economize, the accumulation of knowledge, and the accumulation of capital.” W. ARTHUR LEWIS
  • 5. Exogenous vs. Endogenous Growth The neoclassical view that economic growth in the long run is merely a matter of technology The new view that long-run growth depends on saving, efficiency, and depreciation is more illuminating.
  • 6. A Simple Model of Endogenous Growth Four building blocks:  S = I Saving equals investment in equilibrium.  S = sY Saving is proportional to income.  I = K + K Investment involves addition to capital stock.  Y = EK Output depends on quality and quantity of capital.
  • 7. A Simple Model of Endogenous Growth Implication:  g = sE -  Rate of economic growth equals  Saving rate times  Efficiency (i.e., the output/capital ratio) minus  Depreciation
  • 8. Endogenous Growth in the Harrod-Domar Model You may recognize the endogenous growth model as a reinterpretation of the Harrod-Domar model where growth depends on A. the saving rate B. the capital/output ratio C. the depreciation rate
  • 9. Sources of Endogenous Growth I Saving Important implication for economic policy: Economic stability with low inflation and positive real interest rates spurs saving, which is good for growth.
  • 10. Sources of Endogenous Growth I 100 400 300 200 1965 1990 East Asia OECD Africa Income per capita
  • 11. Sources of Endogenous Growth II Depreciation The effect of depreciation on growth is related to that of saving and investment on growth. Unprofitable investment in the past reduces the quality of capital and makes it depreciate more rapidly, necessitating more replacement investment to make up for economic and physical wear and tear. The more national saving has to be set aside for replacement investment, the less will be available for the buildup of new capital.
  • 12. Investment: Quantity and Quality Compare Botswana and Tanzania: In Botswana, the share of State-Owned Enterprises in total investment fell from 16% in 1985-90 to 12% in 1990-97. In Tanzania, the SOE share of investment fell from 46% in 1985-90 to 23% in 1990-97. This is probably a good sign. Privatization helps improve investment.
  • 13. Investment: Quantity and Quality Investment quality, however, is not only a question of public vs. private enterprise. Sound banking is also important. It takes sound commercial banks, usually privately owned banks motivated by profit rather than by political concerns, to channel household savings into high-quality investment.
  • 14. Sources of Endogenous Growth III Efficiency Also fits real world experience quite well Technical progress is good for growth because it allows us to squeeze more output out of given inputs. And that is exactly what increased efficiency is all about! Thus, technology is best viewed as an aspect of general economic efficiency. Important implication for economic policy: Everything that increases economic efficiency, no matter what, is also good for growth.
  • 15. Sources of Endogenous Growth III Five sources of increased efficiency 1. Liberalization of prices and trade increases efficiency, which is good for growth. 2. Stabilization reduces the inefficiency associated with inflation, which is good for growth. 3. Privatization reduces the inefficiency associated with state-owned enterprises, which … 4. Education makes the labor force more efficient. 5. Technological progress also enhances efficiency. The possibilities are virtually endless!
  • 16. Sources of Endogenous Growth III This is good news. If growth were merely a matter of technology, we would not be able to do much about it … … except to follow technology-friendly policies by supporting R&D and such. But if growth depends on saving and efficiency, there are things that we can do, in the private sector as well as through the public sector, to foster rapid economic growth. Because everything that is good for saving and efficiency is also good for growth.
  • 17. What to Do to Encourage Economic Growth Maintain strong incentives to save Keep inflation low and real interest rates positive Maintain financial system in good health so as to channel saving into high-quality investment Foster efficiency 1. Liberal price and trade regimes 2. Low inflation 3. Strong private sector 4. More and better education 5. Limited, or well managed, natural resources
  • 18. Liberalization and Economic Growth Liberalization of prices means that markets, not bureaucrats, are allowed to set prices. Mixed market economy is more efficient than central planning.  Compare former Soviet Union with the US and Europe Liberalization of trade allows specialization according to comparative advantage. Free trade is more efficient than self-sufficiency.  North Korea and Cuba vs. Hong Kong and Singapore Applies to trade in goods, services, capital. 1
  • 20. Liberalization Increases Economic Efficiency G F A B C Output gain Traditional output Modern output D H E Price distortion World price ratio Domestic, distorted price ratio If output gain = E and price distortion = c, then E = mc2 OC = modern output CA = traditional output OA = total output O
  • 21. Liberalization Increases Economic Efficiency G F A B C Output gain Traditional output Modern output D H E Price distortion World price ratio Domestic, distorted price ratio O J K Imports Exports Welfare gain
  • 22. Liberalization Increases Economic Efficiency G F A B C Traditional output Modern output D H E Price distortion O J Welfare gain M N Q Transition takes time: From E to F via M, N, and Q
  • 23. Liberalization Increases Economic Efficiency D G F E A B Price distortion J O H World price ratio C AB = static gain BC = dynamic gain AC = AB + BC = total gain Productivity gain K Welfare gain Traditional output Modern output
  • 24. Growth and Trade, 1965-98 105 countries -6 -4 -2 0 2 4 6 8 10 0 50 100 150 200 250 300 350 Trade (% of ppp-adjusted GDP) Growth per capita (% per year) NB: UAE, Hong Kong, and Singapore. Singapore Hong Kong United Arab Emirates China Korea Botswana Each 50 percentage point increase in the trade ratio is associated with an increase in per capita growth by almost 1% per year.
  • 25. Growth and Trade, 1965-98 32 sub- Saharan African countries -6 -4 -2 0 2 4 6 8 10 0 20 40 60 80 100 Trade (% of ppp-adjusted GDP) Growth per capita (% per year) Each 20 percentage point increase in the trade ratio is associated with an increase in per capita growth by 1% per year.
  • 26. Growth and Foreign Direct Investment, 1965-98 100 countries -4 -2 0 2 4 6 8 10 0 2 4 6 8 10 12 14 Foreign direct investment (% of ppp-adjusted GDP) Growth per capita (% per year) Qualification: Relationship rests on Botswana and Singapore. Botswana Singapore Each three percentage point increase in the FDI ratio is associated with an increase in per capita growth by almost 1% per year.
  • 27. Growth and Foreign Direct Investment, 1965-98 -4 -2 0 2 4 6 8 10 0 2 4 6 8 Foreign direct investment (% of ppp-adjusted GDP) Growth per capita (% per year) Each one percentage point increase in the FDI ratio is associated with an increase in per capita growth by almost 1% per year. 31 sub- Saharan African countries Relationship depends on the inclusion of Botswana. Botswana
  • 28. Stabilization and Economic Growth Stabilization of prices means that distortions associated with inflation are reduced.  Inflation distorts the choice between real and financial capital by punishing money holdings, and thus creates inefficiency in production.  Inflation thus involves a tax, the inflation tax. An inefficient tax compared with most other taxes.  Inflation also creates uncertainly which tends to discourage trade and investment.  Inflation also tends to result in overvaluation of currency, thus hurting exports and growth. 2
  • 29. Stabilization Increases Economic Efficiency Financial capital Real capital Undistorted price ratio G F E A Inflation distortion 45° Output after Output before Distorted price ratio C D H O B Output gain If output gain = E and inflation distortion = c, then, again, E = mc2
  • 30. Privatization and Economic Growth Privatization means that profit-oriented owners and able managers are allowed to direct enterprises. Profit motive replaces political considerations as the guiding principle of business operations. Profit-maximizing owners generally want to appoint managers and staff on merit rather than on the basis of political connections, for example. Private enterprise is generally more efficient than state-owned enterprises. 3
  • 31. Privatization Increases Economic Efficiency Private output Public output Undistorted price ratio D G Distorted price ratio F E A B N Price and quality distortion H O J K 45° Output gain
  • 32. Same Story Time and Again Free trade is good for growth Reduces the inefficiency that results from restrictions on trade Price stability is good for growth Reduces inefficiency resulting from inflation Privatization is good for growth Reduces inefficiency resulting from SOEs Education is good for growth Reduces the inefficiency that results from inadequate education
  • 33. Same Story Time and Again Can describe this by simple arithmetic The efficiency gain from eliminating an economic distortion (trade restrictions, inflation, unnecessary state intervention, insufficient education) is directly proportional to the square of the distortion: E = mc2 E stands for efficiency gain, m is a multiplicative constant, and c is the distortion
  • 34. E = mc2 If the distortion is substantial (severe trade restrictions, high inflation, big SOE sector, poor education), then reducing or eliminating the distortion can increase efficiency and growth a great deal. We can see this by plugging appropriate numbers into the formula and also by econometric research, where the theory is compared with experience (i.e., economic statistics).
  • 35. Education and Economic Growth Education means a better trained and hence more efficient work force.  Need to provide primary and secondary education to all, especially females  Need to provide tertiary education to a greatly increased number of people  Need increased public commitment to education  This requires both increased public expenditure on education and probably also increased scope for private sector involvement in education. 4
  • 36. Growth and Education, 1965-98 86 countries -4 -2 0 2 4 6 8 10 0 20 40 60 80 100 120 140 Secondary-school enrolment 1980-97 (%) Growth per capita (% per year) An increase in secondary-school enrolment by 40% of each cohort goes along with an increase in per capita growth by 1% per year.
  • 37. Growth and Education, 1965-98 -6 -4 -2 0 2 4 6 8 10 0 1 2 3 4 5 6 7 8 Public expenditure on education (% of GNP) Growth per capita (% per year) Each two percentage point increase in the education expenditure ratio is associated with an increase in per capita growth by about 1% per year. 33 sub- Saharan African countries
  • 38. Natural Resources and Economic Growth Natural resources, if not well managed, may turn out to be, at best, a mixed blessing. Three possible channels  Education  Dutch disease  Rent seeking What is the evidence? 5
  • 39. Natural Resources and Economic Growth 1965-98 Abundant natural resources, if not well managed, appear harmful to growth. -4 -2 0 2 4 6 8 10 0 10 20 30 40 50 60 Share of natural capital in national wealth (%) Growth per capita (% per year) 86 countries A ten percentage point increase in the natural capital share goes along with a decrease in per capita growth by nearly 1% per year.
  • 40. Natural Resources and Education 90 countries 0 1 2 3 4 5 6 7 8 9 0 10 20 30 40 50 60 Share of natural capital in national wealth (%) Public expenditure on education (% of GNP) An 18 percentage point increase in the natural capital share is associated with a decrease in public expenditure on education by 1% of GNP. Abundant natural resources appear to crowd out human resources.
  • 41. Natural Resources and Corruption Abundant natural resources appear to go along with corruption. 0 1 2 3 4 5 6 7 8 9 10 0 5 10 15 20 25 Share of natural capital in national wealth (%) Corruption index New Zealand 45 countries
  • 42. What Is the Upshot? Economic growth responds to public policy. In particular, by encouraging saving and investment of high quality foreign trade and investment education ... the government can help foster rapid economic growth.
  • 43. Sir Arthur Lewis Got It Right Since the second world war it has become quite clear that rapid economic growth is available to those countries with adequate natural resources which make the effort to achieve it. W. ARTHUR LEWIS (1968)
  • 44. What Else? These lessons are borne out by experience from around the world. Additional lessons: Too much inflation hurts saving, investment, and trade — and thereby also growth. Too much SOE activity hurts the quality of investment and education — and growth. Too much agriculture and, more generally, natural resource dependence, if not well managed, hurts education and trade — and thereby also growth. Too rapid population growth also tends to impede economic growth.
  • 45. Reservations Even so, the question of rapid growth is, of course, a bit more complicated. We also need to address a host of political, social, and cultural questions as well as questions of natural conditions, climate, and public health — which would take us too far afield. But the main point remains:  To grow or not to grow is in large measure a matter of choice.  Many of the constraints on growth are man- made, and can be removed.
  • 46. In Conclusion: It Can Be Done Economic growth makes a difference, especially in poor countries. A question literally of life and death And not only in poor countries, for there is poverty amid plenty in rich countries Recall the main point of Gunnar Myrdal’s Asian Drama (1968): It was that the Asian economies were incapable of rapid economic growth! New growth theory suggests that similar claims about Africa will also be proven wrong.
  • 47. In Conclusion: It Can Be Done There has been much progress in economic policy and performance around the world in the 1990s. Growth-friendly reforms have been widely embraced among ordinary people and politicians across the political spectrum, not only in Asia, but also, increasingly, in other parts of the world, including Africa. Yet, various special interest groups try to resist.
  • 48. ‘Reformers have the idea that change can be achieved by brute sanity.’ George Bernard Shaw To grow or not to grow is in large measure a matter of choice. These slides can be viewed on my website: www.hi.is/~gylfason/copenhagen.ppt In Conclusion: It Can Be Done