Download as PDF, PPTX


![20
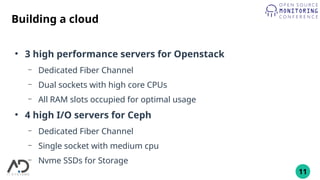
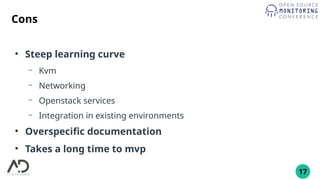
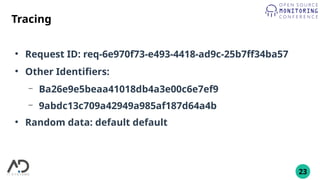
Placement logs
●
2022-11-09 10:03:15.070 25 INFO placement.requestlog [req-6e970f73-e493-4418-ad9c-25b7ff34ba57
ba26e9e5beaa41018db4a3e00c6e7ef9 9abdc13c709a42949a985af187d64a4b - default default] 10.XX.XX.XX "GET
/resource_providers/480ccd47-c2c0-4a49-8972-b1486598f6e9/allocations" status: 200 len: 575 microversion: 1.0
●
2022-11-09 10:03:15.097 24 INFO placement.requestlog [req-d1118868-c205-4b38-8567-eb1c7db17811
ba26e9e5beaa41018db4a3e00c6e7ef9 9abdc13c709a42949a985af187d64a4b - default default] 10.XX.XX.XX "GET
/resource_providers?in_tree=480ccd47-c2c0-4a49-8972-b1486598f6e9" status: 200 len: 817 microversion: 1.14
●
2022-11-09 10:03:15.123 22 INFO placement.requestlog [req-e77ad21e-ead7-4b5e-9e03-b3350b188234
ba26e9e5beaa41018db4a3e00c6e7ef9 9abdc13c709a42949a985af187d64a4b - default default] 10.XX.XX.XX "GET
/resource_providers/480ccd47-c2c0-4a49-8972-b1486598f6e9/inventories" status: 200 len: 410 microversion: 1.0
●
2022-11-09 10:03:15.143 23 INFO placement.requestlog [req-7e8f0090-69f7-4b5c-b63d-6d8aeffa6312
ba26e9e5beaa41018db4a3e00c6e7ef9 9abdc13c709a42949a985af187d64a4b - default default] 10.XX.XX.XX "GET
/resource_providers/480ccd47-c2c0-4a49-8972-b1486598f6e9/aggregates" status: 200 len: 54 microversion: 1.19
●
2022-11-09 10:03:15.178 21 INFO placement.requestlog [req-416b2d05-eebc-4fac-b75d-10c02c7df252
ba26e9e5beaa41018db4a3e00c6e7ef9 9abdc13c709a42949a985af187d64a4b - default default] 10.XX.XX.XX "GET
/resource_providers/480ccd47-c2c0-4a49-8972-b1486598f6e9/traits" status: 200 len: 1593 microversion: 1.6](https://image.slidesharecdn.com/privatecloud-221124095720-a936e9aa/85/OSMC-2022-Let-s-build-a-private-cloud-how-hard-can-it-be-by-Kevin-Honka-20-320.jpg)
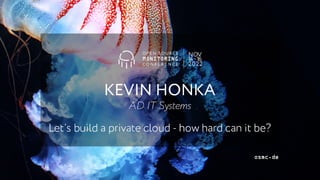
![21
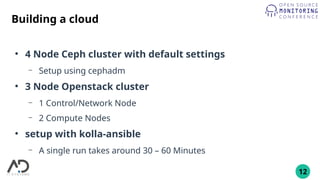
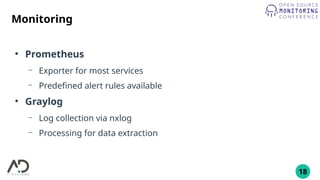
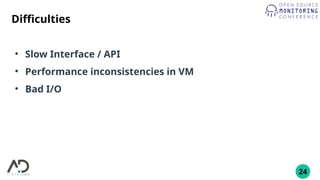
Placement logs
●
2022-11-09 10:03:15.070 25 INFO placement.requestlog
[req-6e970f73-e493-4418-ad9c-25b7ff34ba57
ba26e9e5beaa41018db4a3e00c6e7ef9
9abdc13c709a42949a985af187d64a4b - default default]
10.XX.XX.XX "GET /resource_providers/480ccd47-c2c0-4a49-
8972-b1486598f6e9/allocations" status: 200 len: 575
microversion: 1.0](https://image.slidesharecdn.com/privatecloud-221124095720-a936e9aa/85/OSMC-2022-Let-s-build-a-private-cloud-how-hard-can-it-be-by-Kevin-Honka-21-320.jpg)

The document outlines the process of building a private cloud, detailing concepts like hardware requirements, software options, and setup configurations using OpenStack and Ceph. It discusses the pros and cons of private clouds, including potential difficulties such as slow interfaces and performance inconsistencies. Monitoring strategies are also provided, with an emphasis on using tools like Prometheus and Grafana for effective oversight.