Perceived Quality and Sustainability in Additive Manufacturing
1. This work is sponsored by Professor Barbara Linke, the
principle investigator of the Manufacturing and Sustainable
Technologies Research Laboratory (MASTeR). The author
would like to thank all of the fellow lab members in
MASTeR for their advice, especially the 3D printing team
who collaborated this project: Aaron Li and Farhad
Ghadamli. In addition, Steven Lucero from the Translating
Engineering Advances to Medicine (TEAM) lab gave much
advice and helped to fabricate these parts.
Perceived Quality and Sustainability in Additive Manufacturing
Myron Lam
Department of Mechanical and Aerospace Engineering, University of California, Davis
ResultsIntroduction Methods
Background
Additive manufacturing (AM) is a trending topic in
sustainability because of its versatility in creating complex
parts with a quality that resembles that of a traditionally
manufactured part, potentially with lower resource and
energy demands.
Methods of Additive Manufacturing Studied
• Fused Deposition Modeling (FDM) – a filament is
passed through a heated nozzle and deposited on a
table to cool. This term is trademarked by Stratasys
when the company commercialized the process.
• Stereolithography (SLA) – liquid photopolymer resin is
cured using a UV laser
• PolyJet – A process developed by Stratasys similar to
an inkjet printer that jets curable liquid photopolymer
to a build tray
Types of Materials
• ABS – a common thermoplastic with good strength
• PLA – a biodegradable thermoplastic derived from
renewable resources
• VeroClear – a standard clear plastic used in PolyJet
• Digital material – certain PolyJet printers can make
composite materials with predetermined mechanical
properties
Why Study Perceived Quality?
Perceived quality is considered in this study because:
• It can give insight to people’s perception of a part on
what they think is a high build quality.
• In personal 3D printers, the end user is more inclined
to use settings to prototype a part that is aesthetically
pleasing.
• The ultimate goal of manufacturing is to create a part
that someone will purchase.
Workpiece Features
Several samples were manufactured with different AM
techniques to compare roughness, sensory quality and
process sustainability. The dimensions of the benchmark
samples are 38.1 mm x 38.1 mm x 38.1 mm (1.5” x 1.5” x
1.5”).
Each sample contained the following features, as shown
in Figure 2:
Perceived Quality
Users were presented with five samples shown in Figure 3 following the survey procedure. The results of the sensory
assessment is shown in Figure 4. The hedonic assessment ranks the overall part quality. The tactile assessment involves
feeling particular surfaces to judge their roughness. The visual assessment requires ranking the pieces only by sight without
touching the parts.
Sustainability Analysis
A cost analysis and energy measurement were conducted. Figure 5 compares the cost to manufacture each part, and
Figure 6 compares the energy consumed in making each part.
Sample Machine
AM
process
Material
Layer
thickness
Fill
Rate
Color
I
Makerbot
Replicator
FDM PLA 100
microns
15% Translucent
II
Makerbot
Replicator
2X
FDM ABS 100
microns
10% Black
III
Formlabs
Form 1+
SLA UV curing
resin
50
microns
100% Translucent
IV
Stratasys
Objet260
PolyJet VeroClear 32
microns
100% Translucent
V
Stratasys
Objet260
PolyJet Digital
material
16
microns
100% Blue
Figure 2: Different views of the sample workpiece.
Top: front view. Bottom: rear view.
• Bullet Shape
• Cones
• Hollow cylinder
• Square base
• Slot downwards
• Slope
• Hemisphere
• Slot upwards
• Thin Wall
Different additive manufacturing processes and
materials are studied, and the configuration of each
sample is shown in Table 1.
VIVIIIIII
5
4
3
2
1
TactileAssessmentScore
1.96429
2.46429
3.17857 3.25
4.14286
B
Conf. Interval (±0.95)
Tactile
Acknowledgments
VIVIIIIII
5
4
3
2
1
HedonicAssessmentScore
2.42857 2.46429
3.53571
2.96429
3.60714
A
Conf. Interval (±0.95)
Hedonic
VIVIIIIII
5
4
3
2
1
VisualAssessmentScore
1.53571
1.71429
3.75
3.89286
4.10714
C
Conf. Interval (±0.95)
Visual
Conclusion
• The highest ranked AM process is Polyjet.
• Polyjet samples had the highest manufacturing cost
and environmental impact.
• FDM samples were manufactured with the lowest
cost and had the smallest energy footprint.
• In future work social sustainability can be evaluated
by studying people’s access to affordable additive
manufacturing, as well as any hazards in the lab
environment to manufacture parts.
(A) (B) (C)
Figure 4: Ranking of the sensory assessment obtained from experimental sessions: (A) hedonic tactile impression, (B) tactile assessment of
surface roughness, and (C) visual assessment of surface roughness. Average ± 95% confidence interval (n=32 assessors). Score 1 = the least
preferred / roughest sample; 5 = the most preferred / smoothest sample.
(I) (II) (III) (IV) (V)
Figure 3: The five samples that were presented to the experiment subjects.
Table 1: Specifications of AM process used to make each sample.
Survey Procedure
1. The experimental subject is briefed on the method of
ranking each workpiece.
2. The subject places his or her hands inside a
cardboard box while the experimenter gives each
piece to be felt in a random order.
3. The subject reports his or her opinion of the parts.
4. All five parts are displayed to the subject, and the
subject would rank the appearance of each
workpiece, without feeling the surface.
0
20
40
60
80
100
120
140
I II III IV V
SpecificEnergy(kWh/kg)
Sample
Specific Process Energy
Figure 5: Cost vs. sample. These values are determined by considering
the electricity, machine, material and laboratory overhead.
Figure 6: Energy consumed vs. sample. These values were determined by
multiplying the power consumption of the machine by the build time.
0
10
20
30
40
I II III IV V
Cost($)
Sample
Total Cost
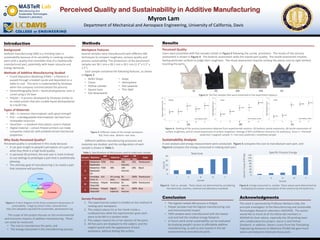
Figure 1: A Venn Diagram of the three constituent dimensions of
sustainability. Image by Johann Dréo, retrieved from
http://en.wikipedia.org/wiki/File:Sustainable_development.svg
The scope of this project focuses on the environmental
and economic impacts of additive manufacturing. These
can easily be measured:
• The cost to manufacture the parts, and
• The energy consumed in the manufacturing process.