
Recommended
Recommended
More Related Content
Similar to WSP-ESI-Ghana-brochure.pdf
Similar to WSP-ESI-Ghana-brochure.pdf (20)
Recently uploaded
Recently uploaded (20)
WSP-ESI-Ghana-brochure.pdf
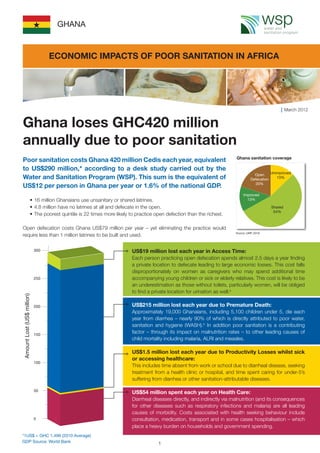
- 1. Poor sanitation costs Ghana 420 million Cedis each year, equivalent to US$290 million,* according to a desk study carried out by the Water and Sanitation Program (WSP). This sum is the equivalent of US$12 per person in Ghana per year or 1.6% of the national GDP. • 16 million Ghanaians use unsanitary or shared latrines. • 4.8 million have no latrines at all and defecate in the open. • The poorest quintile is 22 times more likely to practice open defection than the richest. Open defecation costs Ghana US$79 million per year – yet eliminating the practice would require less than 1 million latrines to be built and used. Ghana loses GHC420 million annually due to poor sanitation Ghana sanitation coverage March 2012 GHANA US$19 million lost each year in Access Time: Each person practicing open defecation spends almost 2.5 days a year finding a private location to defecate leading to large economic losses. This cost falls disproportionately on women as caregivers who may spend additional time accompanying young children or sick or elderly relatives. This cost is likely to be an underestimation as those without toilets, particularly women, will be obliged to find a private location for urination as well.a US$215 million lost each year due to Premature Death: Approximately 19,000 Ghanaians, including 5,100 children under 5, die each year from diarrhea – nearly 90% of which is directly attributed to poor water, sanitation and hygiene (WASH).b In addition poor sanitation is a contributing factor – through its impact on malnutrition rates – to other leading causes of child mortality including malaria, ALRI and measles. US$1.5 million lost each year due to Productivity Losses whilst sick or accessing healthcare: This includes time absent from work or school due to diarrheal disease, seeking treatment from a health clinic or hospital, and time spent caring for under-5’s suffering from diarrhea or other sanitation-attributable diseases. US$54 million spent each year on Health Care: Diarrheal diseases directly, and indirectly via malnutrition (and its consequences for other diseases such as respiratory infections and malaria) are all leading causes of morbidity. Costs associated with health seeking behaviour include consultation, medication, transport and in some cases hospitalisation – which place a heavy burden on households and government spending. Unimproved 13% Open Defecation 20% Improved 13% Shared 54% Source: (JMP, 2010) ECONOMIC IMPACTS OF POOR SANITATION IN AFRICA *1US$ = GHC 1.499 (2010 Average) GDP Source: World Bank 1
- 2. The economic burden of poor sanitation falls most heavily on the poorest In costs quantified by the study, open defecation costs more per person than any other type of unimproved sanitation; the additional costs are mainly due to the time taken to find a safe, private location for defecation. Costs associated with shared sanitation are likely to be higher than shown if time taken to reach and queue at a public latrine as well as user-fees were added. As it is not possible to estimate the proportion of public latrine users in the shared latrine category these costs are not included. Health costs cannot easily be assigned across latrine categories.c Sanitation or lack thereof is a public health issue – people are affected by their neighbours and communities sanitation status as well as their own, and the costs of open defecation are felt throughout the community.d Open defecation also has considerable social costs. Loss of dignity and privacy or risk of physical attack and sexual violence may not be easily valued in monetary units, but these issues are the reality when sanitation facilities are not available. Open defecation costs more than fixed-point sanitation EQUITY The costs of poor sanitation are inequitably distributed with the highest economic burden falling disproportionately on the poorest. The average cost associated with poor sanitation, constitutes a much greater proportion of a poor person’s income than that of a wealthier person. Access to sanitation alone demonstrates inequities; the poorest 20% of the population are 22 times more likely to practice open defecation than the wealthiest 20% of the population. For the poorest therefore, poverty is a double- edged sword – not only are they more likely to have poor sanitation but they have to pay proportionately more for the negative effects it has. Graph: Cost per capita of unimproved sanitation as % of income by wealth quintile Graph: Cost per capita of different types of unimproved sanitation 2
- 3. Epidemic outbreak costs: Fecal contamination of the environment is the root cause of an annual average of 1,800 cases of cholera affecting Ghana.1 The cost of the necessary WASH response is estimated to be US$1.2 million each year. However the economic implications of a cholera outbreak go beyond the immediate health system response – there are also costs related to productivity loss and premature death, diverting expenditures from other essential items and leading to losses in trade and tourism revenue. Funeral costs: Calculations for the cost of premature death do not take into account funeral costs, which are borne directly by households and can be significant across Africa. One study in South Africa found that on average, households spend the equivalent of a year’s total expenditure on food and groceries on funerals (measured at median household expenditure). In Ghana, annual sanitation - related funeral costs (discounted against future funeral costs) are estimated at US$2.9 million. Water Pollution: The adverse impact of unsafe excreta disposal on water resources is not included in the cost estimation as figures are not available for Africa. Where this affects drinking water supply, water supply and treatment costs for drinking and other domestic uses will add to the costs associated with poor sanitation. Cognitive development: The model does not attempt to capture the long-term economic losses related to the adverse effects of poor sanitation on cognitive development. Early childhood diarrhea contributes to under nutrition, stunting and wasting which are associated with malnutrition and in turn with reduced long-term cognitive development.e Infection with soil-transmitted helminths is also an important cause of impairment in intellectual and cognitive development.2 Tourism: Tourism can be a significant source of income, employment and foreign currency. There are multiple factors that contribute to travel and tourism competitiveness. The WEF3 Travel and Tourism competitiveness report ranks countries according to 75 indicators, one of which is sanitation status. Based on the current contribution of travel and tourism to GDP addressing sanitation in Ghana could lead to an increase in travel and tourism of an estimated US$8.5 million annually. Re-use: Although not included in this model, recycling of excreta is an option that could bring potential economic benefit. The value of excreta re-use is likely to increase in the future as word phosphate reserves continue to decline. The figure of US$290 million is likely to underestimate the true cost of the current sanitation situation in Ghana. The following costs are likely to be significant, but are more difficult and expensive to estimate, and therefore have not been precisely valued: ADDITIONAL COSTS 3
- 4. The 2nd AMCOW Country Status Overview (CSO2f )scorecard for Ghana (which assesses the transformation of inputs - finance - into services) identifies budget and uptake as particular bottlenecks along the rural service delivery pathway and planning, budget and use in the pathway for urban sanitation. Rural Sanitation and Hygiene Scorecard (CSO2) Urban Sanitation and Hygiene Scorecard (CSO2) Allocate higher investments to sanitation Current sanitation investment in Ghana is less than 0.1% GDP:4 which is lower than several estimates for what is required.5 Increased investments in sanitation and hygiene promotion are required not only to realise health and welfare benefits of sanitation but also to avert large economic losses. Green - building blocks that are largely in place, acting as a driver on service delivery. CSO2 scorecard colour code: Red - building blocks that are inadequate, constituting a barrier to service delivery and a priority for reform. Yellow - building blocks that are a drag on service delivery and require attention. WHAT NEEDS TO BE DONE Address bottlenecks in the service delivery pathway Financing will be more efficiently used if shortcomings in budgets, planning, uptake and use are addressed (for further details see CSO2 Ghana). Target investments to the poorest Sanitation inequity should be addressed through specific strategies to address the sanitation needs of the poorest. Prioritise elimination of open defecation Open defecation not only has higher costs than any other sanitation practise, it has considerable adverse social impacts. Low cost and effective ways of stopping open defecation need to be scaled up. TURNING FINANCE INTO SANITATION SERVICES 4
- 5. Traditionally, sanitation has not received the priority it deserves. It has not been widely recognized how good sanitation policies and practices can underpin socio-economic development and environmental protection. This study provides an estimation of economic impacts on populations without access to improved sanitation in order to provide information on the losses to society of the current sanitation situation. While not all these economic impacts can be immediately recovered from improved sanitation practices, it provides a perspective on the economic gains that are available to countries through a range of policies to mitigate these impacts over the longer term. Underlying data sets to estimate economic impacts are weak; the study therefore uses objectively verified data sources and conservative numbers to estimate economic impacts. Several impacts have been excluded due to lack of data (see page 3). Therefore the total costs of poor sanitation in this report are likely to be a significant under estimate. Study Methods Data used for these estimates was in large part derived from Demographic and Health Surveys (DHS), Multiple Indicator Cluster Surveys (MICS) and the Joint Monitoring Programme for Water Supply and Sanitation (JMP). Health care costs: included outpatient and inpatient costs and patient travel costs, estimated using disease rates and treatment seeking behaviour from DHS and MICS, and unit costs of health services from WHO-CHOICE. Health-related productivity costs: average length of time spent incapacitated was 2 days (diarrhea), 5 days (respiratory infection) and 4 days (malaria). While infants are not productive, their sickness leads to diversion of carers from other activities (2 hours per day). Time value is the same as access time costs (see below). Mortality costs: number of deaths from WHO statistics - 88% of diarrheal deaths attributed to fecal-oral route. Indirect deaths via increased malnutrition rates (respiratory infections, measles and malaria) were estimated using attributable fractions based on data from WHO. The value of a premature death was estimated using human capital approach – the discounted future income of a working person, using the Notes: a Urination was not included in the model due to the complexity of the issue and absence of data. b According to WHO 88% of diarrhea cases are attributable to poor environmental factors, essentially originating from poor excreta management (Pruess et al). According to best scientific evidence basic sanitation interventions can avert 36% of diarrhea cases and sanitation and hygiene combined can avert 45% cases. c There is a lack of scientific evidence to enable a distinction between the health impacts of different types of unimproved sanitation, however an attempt to do so was made through the disaggregation of diarrhea rates by unimproved category. d There is currently no scientific evidence concerning the level of coverage required for community-wide health benefits - this is an area that requires further research. e The potential effect of tropical enteropathy on child growth means that previous estimates of the extent to which this relationship exists may have been underestimate. Humphrey, Lancet 2009; 374: 1032–35. f For each country and subsector, the second AMCOW Country Status Overview (CSO2) explores the links between inputs (finance) and outcomes (coverage) GNP per capita to conservatively estimate the average economic contribution of a member of society. Time costs for accessing site of open defecation: extra travel time is based on the expert opinion of over 25 sector specialists. Time lost is valued at 30% of the Gross Domestic Product per capita for adults, and for children over 5 years of age at 15% of the GDP per capita. Funeral costs were estimated from funeral insurance policy benefits (7 African countries), adjusted based on a study showing that with-insurance spending on funerals was 37% more than without-insurance, and as all people die eventually, the future funeral costs were discounted to the present period and subtracted from the costs of holding a funeral now. Cholera WASH cost estimates are based on a combination of preparedness and response budgets.6 Costs included are limited to coordination, community WASH response and WASH in cholera treatment centers. Calculations use an attack rate of 2% and disease duration of 3-months. 5 Estimating the economic impacts of sanitation Notes and References through the lens of a ‘service delivery pathway’, to identify the major barriers that still constrain performance in each subsector. The CSO2 Scorecard is an assessment framework allowing identification of drivers and barriers in the ‘service delivery pathway’ of each sub-sector. ********************************************************************************** References: 1 WHO Global Health Atlas, Cholera cases 2005-09 2 Bethony et al, Lancet 2006; 367: 1521–32 3 World Economic Forum Travel and Tourism Competitiveness Report, 2011 4 In-country eThekwini monitoring, 2011 5 Africa Infrastructure Country Diagnostic Background Paper 13 (Phase 1), Climbing the Ladder – The State of Sanitation in Sub-Saharan Africa (2008), Second AMCOW Country Status Overview CSO2 (2011), eThekwini Declaration (2008) 6 Oxfam GB Haiti and Government of Kenya cholera preparedness and response budgets.
- 6. March 2012 The Water and Sanitation Program is a multi-donor partnership administered by the World Bank to support poor people in obtaining affordable, safe, and sustainable access to water and sanitation services. WSP MISSION: To support poor people in obtaining affordable, safe, and sustainable access to water and sanitation services. WSP FUNDING PARTNERS: WSP’s donors include Australia, Austria, Canada, Denmark, Finland, France, the Bill & Melinda Gates Foundation, Ireland, Luxembourg, Netherlands, Norway, Sweden, Switzerland, United Kingdom, United States, and the World Bank. ACKNOWLEDGEMENTS: The desk study on the Economics Impacts of Poor Sanitation in Africa was conducted by a team at WSP Africa: Yolande Coombes (WSP Task Manager), Guy Hutton (consultant), Sophie Hickling (consultant), Lewnida Sara (WSP), Alice Muthoni Kiama (consultant). The report prototype was peer reviewed by Oliver Cumming (London School of Hygiene and Tropical Medicine), Pete Kolsky (World Bank), Eddy Perez (WSP), Peregrine Swann (WHO/GLAAS), Sophie Trémolet (independent consultant), Michael Webster (World Bank). In Ghana, the prototype was reviewed and concept endorsed by Kweku Quansah, Programme Officer, Environmental Health and Sanitation Directorate, Ministry of Local Government and Rural Development; and, Suzzy Abaidoo, Water, Sanitation and Hygiene Coordinator, Ministry of Water Resources, Works and Housing. Editorial Direction: Toni Sittoni and Sylvia Maina PHOTO CREDITS: Front cover montage: ©WSP, UNICEF and WaterAid Back cover montage: ©WSP, Andreas Knapp and UNICEF This document is available online at www.wsp.org Design/Layout: Eric Lugaka DISCLAIMER: Water and Sanitation Program (WSP) reports are published to communicate the results of WSP’s work to the development community. Some sources cited may be informal documents that are not readily available. The findings, interpretations, and conclusions expressed herein are entirely those of the author and should not be attributed to the World Bank or its affiliated organizations, or to members of the Board of Executive Directors of the World Bank or the governments they represent. The World Bank does not guarantee the accuracy of the data included in this work. The boundaries, colors, denominations, and other information shown on any map in this work do not imply any judgment on the part of the World Bank Group concerning the legal status of any territory or the endorsement or acceptance of such boundaries. The material in this publication is copyrighted. Requests for permission to reproduce portions of it should be sent to wsp@worldbank.org. WSP encourages the dissemination of its work and will normally grant permission promptly. For more information, please visit www.wsp.org © 2012 Water and Sanitation Program