SlideShare a Scribd company logo
1 of 12
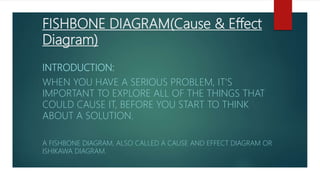
FISHBONE DIAGRAM(Cause & Effect
Diagram)
INTRODUCTION:
WHEN YOU HAVE A SERIOUS PROBLEM, IT'S
IMPORTANT TO EXPLORE ALL OF THE THINGS THAT
COULD CAUSE IT, BEFORE YOU START TO THINK
ABOUT A SOLUTION.
A FISHBONE DIAGRAM, ALSO CALLED A CAUSE AND EFFECT DIAGRAM OR
ISHIKAWA DIAGRAM.
IT IS A VISUALIZATION TOOL FOR CATEGORIZING THE
POTENTIAL CAUSES OF A PROBLEM IN ORDER TO IDENTIFY ITS
ROOT CAUSES.
A FISHBONE DIAGRAM IS USEFUL IN BRAINSTORMING SESSIONS
TO FOCUS CONVERSATION.
ONE CAN USED IT FOR
• DISCOVER THE ROOT CAUSE OF A PROBLEM
• UNCOVER BOTTLENECKS IN YOUR PROCESSES.
• IDENTIFY WHERE AND WHY A PROCESS ISN'T WORKING
STRUCTURE
• THE DESIGN OF THE DIAGRAM
LOOKS MUCH LIKE A SKELETON
OF A FISH.
• FISHBONE DIAGRAMS ARE
TYPICALLY WORKED RIGHT TO
LEFT, WITH EACH LARGE
OF THE FISH BRANCHING OUT
TO INCLUDE SMALLER BONES
CONTAINING MORE DETAIL.
Fishbone diagrams are used in the "analyze" phase of Six Sigma’s DMAIC (define, measure, analyze,
improve, control) approach to problem solving.
4 Reason to use Fish Bone Diagram
1) DISPLAY RELATIONSHIP
2) SHOW ALL CAUSES SIMULTANEOUSLY
3) FACILITATE BRAINSTORMING
4) HELP MAINTAIN TEAM FOCUS
HOW TO USE THE TOOL
STEP 1: IDENTIFY THE PROBLEM
FIRST, WRITE DOWN THE EXACT PROBLEM YOU FACE. WHERE APPROPRIATE, IDENTIFY WHO IS
INVOLVED, WHAT THE PROBLEM IS, AND WHEN AND WHERE IT OCCURS. THEN, WRITE THE PROBLEM
A BOX ON THE LEFT-HAND SIDE OF A LARGE SHEET OF PAPER, AND DRAW A LINE ACROSS THE
HORIZONTALLY FROM THE BOX. THIS ARRANGEMENT, LOOKING LIKE THE HEAD AND SPINE OF A
GIVES YOU SPACE TO DEVELOP IDEAS.
Step 2: Work Out the Major Factors Involved
Next, identify the factors that may be part of the problem. These may be systems, equipment, materials,
forces, people involved with the problem, and so on.
Try to draw out as many of these as possible. As a starting point, you can use models such as 7S or the 4 Ps.
Step 3: Identify Possible Causes
 Now, for each of the factors you considered in step 2, brainstorm possible causes of the problem that may
related to the factor.
 Show these possible causes as shorter lines coming off the "bones" of the diagram. Where a cause is large
complex, then it may be best to break it down into sub-causes. Show these as lines coming off each cause
STEP 4: ANALYZE YOUR DIAGRAM
BY THIS STAGE YOU SHOULD HAVE A DIAGRAM SHOWING ALL OF THE POSSIBLE CAUSES OF THE
PROBLEM THAT YOU CAN THINK OF.
DEPENDING ON THE COMPLEXITY AND IMPORTANCE OF THE PROBLEM, YOU CAN NOW
THE MOST LIKELY CAUSES FURTHER. THIS MAY INVOLVE SETTING UP INVESTIGATIONS, CARRYING
OUT SURVEYS, AND SO ON. THESE WILL BE DESIGNED TO TEST WHICH OF THESE POSSIBLE
ACTUALLY CONTRIBUTING TO THE PROBLEM
Traffic
congestion In
Karachi
Strategy
Staff Equipment
System
Uneducated Politics
System
improper
challan system
Improper
Pedistrian traffic rules
wrong planning
improper training
Uneducated
dishonest
lack
of CCTV
Unfit traffic signal
 TIP:
 A useful way to use this technique with a team is to write all of the possible causes of the problem
down on sticky notes. You can then group similar ones together on the diagram.
 This approach is sometimes called CEDAC (Cause and Effect Diagram with Additional Cards) and
was developed by Dr. Ryuji Fukuda, a Japanese expert on continuous improvement.
THANKS
ANY QUESTION??

More Related Content

What's hot

Ishikawa's Fish Bone
Ishikawa's Fish BoneIshikawa's Fish Bone
Ishikawa's Fish BonePrithvi Ghag
 
Fishbone Diagram, Ishikawa Diagram Training, Learn Fishbone in 3 Easy Steps
Fishbone Diagram, Ishikawa Diagram Training, Learn Fishbone in 3 Easy StepsFishbone Diagram, Ishikawa Diagram Training, Learn Fishbone in 3 Easy Steps
Fishbone Diagram, Ishikawa Diagram Training, Learn Fishbone in 3 Easy StepsBryan Len
 
Fishbone analysis 1108
Fishbone analysis 1108Fishbone analysis 1108
Fishbone analysis 1108Amit Pandey
 
Root Cause Analysis
Root Cause AnalysisRoot Cause Analysis
Root Cause Analysisgatelyw396
 
Root Cause Analysis
Root Cause AnalysisRoot Cause Analysis
Root Cause Analysismtalhausmani
 
Seven quality tools
Seven quality toolsSeven quality tools
Seven quality toolsPinky_0083
 
Pareto analysis
Pareto analysisPareto analysis
Pareto analysisHimanshu
 
Fishbone analysis
Fishbone analysisFishbone analysis
Fishbone analysisTarun Yadav
 
Cause and effect diagram
Cause and effect diagramCause and effect diagram
Cause and effect diagramCOEPD HR
 
Chapter 19 decision-making under risk
Chapter 19   decision-making under riskChapter 19   decision-making under risk
Chapter 19 decision-making under riskBich Lien Pham
 

What's hot (20)

Ishikawa's Fish Bone
Ishikawa's Fish BoneIshikawa's Fish Bone
Ishikawa's Fish Bone
 
Fishbone Diagram, Ishikawa Diagram Training, Learn Fishbone in 3 Easy Steps
Fishbone Diagram, Ishikawa Diagram Training, Learn Fishbone in 3 Easy StepsFishbone Diagram, Ishikawa Diagram Training, Learn Fishbone in 3 Easy Steps
Fishbone Diagram, Ishikawa Diagram Training, Learn Fishbone in 3 Easy Steps
 
Fishbone analysis 1108
Fishbone analysis 1108Fishbone analysis 1108
Fishbone analysis 1108
 
Root Cause Analysis
Root Cause AnalysisRoot Cause Analysis
Root Cause Analysis
 
Root Cause Analysis
Root Cause AnalysisRoot Cause Analysis
Root Cause Analysis
 
Seven quality tools
Seven quality toolsSeven quality tools
Seven quality tools
 
Cause and effect analysis
Cause and effect analysisCause and effect analysis
Cause and effect analysis
 
Pareto Diagram
Pareto DiagramPareto Diagram
Pareto Diagram
 
Pareto analysis
Pareto analysisPareto analysis
Pareto analysis
 
Fishbone analysis
Fishbone analysisFishbone analysis
Fishbone analysis
 
Process mapping
Process mappingProcess mapping
Process mapping
 
Root Cause Analysis (RCA)
Root Cause Analysis (RCA)Root Cause Analysis (RCA)
Root Cause Analysis (RCA)
 
Cause and effect diagram
Cause and effect diagramCause and effect diagram
Cause and effect diagram
 
Chapter 19 decision-making under risk
Chapter 19   decision-making under riskChapter 19   decision-making under risk
Chapter 19 decision-making under risk
 
Process Mapping
Process MappingProcess Mapping
Process Mapping
 
7 qc tools
7 qc tools7 qc tools
7 qc tools
 
#8 Root Cause Analysis
#8 Root Cause Analysis#8 Root Cause Analysis
#8 Root Cause Analysis
 
Pareto Analysis
Pareto AnalysisPareto Analysis
Pareto Analysis
 
Root cause analysis
Root cause analysisRoot cause analysis
Root cause analysis
 
Cause and Effect Diagram
Cause and Effect DiagramCause and Effect Diagram
Cause and Effect Diagram
 

Similar to Presentation fish bone Diagram

Cause & Effect Diagrams
Cause & Effect DiagramsCause & Effect Diagrams
Cause & Effect DiagramsNat Evans
 
New seven management tools
New seven management toolsNew seven management tools
New seven management toolsArun Kumar
 
New Seven Management Tools
New Seven Management ToolsNew Seven Management Tools
New Seven Management ToolsANNA UNIVERSITY
 
New seven management tools
New seven management toolsNew seven management tools
New seven management toolsANNA UNIVERSITY
 
Quality tools in JUST 2 HOURS !!
Quality tools in JUST 2 HOURS !!Quality tools in JUST 2 HOURS !!
Quality tools in JUST 2 HOURS !!The Jamilah H
 
Keys to Better Problem Solving
Keys to Better Problem SolvingKeys to Better Problem Solving
Keys to Better Problem SolvingMike Wicker
 
ОКСАНА ГОРОЩУК «Improving Quality Through Root Cause Analysis»
ОКСАНА ГОРОЩУК «Improving Quality Through Root Cause Analysis»ОКСАНА ГОРОЩУК «Improving Quality Through Root Cause Analysis»
ОКСАНА ГОРОЩУК «Improving Quality Through Root Cause Analysis»GoQA
 
Prinsip prinsip-metode-analisis-akar-masalah xxx
Prinsip prinsip-metode-analisis-akar-masalah xxxPrinsip prinsip-metode-analisis-akar-masalah xxx
Prinsip prinsip-metode-analisis-akar-masalah xxxNi Cko
 

Similar to Presentation fish bone Diagram (20)

Quality improvement tools
Quality improvement tools Quality improvement tools
Quality improvement tools
 
Cause & Effect Diagrams
Cause & Effect DiagramsCause & Effect Diagrams
Cause & Effect Diagrams
 
Ishikawa
IshikawaIshikawa
Ishikawa
 
Cause & Effect Diagrams
Cause & Effect DiagramsCause & Effect Diagrams
Cause & Effect Diagrams
 
Cause & effect diagrams
Cause & effect diagramsCause & effect diagrams
Cause & effect diagrams
 
Cause & effect diagrams
Cause & effect diagramsCause & effect diagrams
Cause & effect diagrams
 
New seven management tools
New seven management toolsNew seven management tools
New seven management tools
 
New Seven Management Tools
New Seven Management ToolsNew Seven Management Tools
New Seven Management Tools
 
New seven management tools
New seven management toolsNew seven management tools
New seven management tools
 
Root Cause Analysis
Root Cause AnalysisRoot Cause Analysis
Root Cause Analysis
 
Root Cause Analysis تحليل أسباب جذور المشكلة
Root Cause Analysis تحليل أسباب جذور المشكلةRoot Cause Analysis تحليل أسباب جذور المشكلة
Root Cause Analysis تحليل أسباب جذور المشكلة
 
Fishbone Diagram.pptx
Fishbone Diagram.pptxFishbone Diagram.pptx
Fishbone Diagram.pptx
 
Quality tools in JUST 2 HOURS !!
Quality tools in JUST 2 HOURS !!Quality tools in JUST 2 HOURS !!
Quality tools in JUST 2 HOURS !!
 
Brainstorming
BrainstormingBrainstorming
Brainstorming
 
Root Cause Analysis
Root Cause AnalysisRoot Cause Analysis
Root Cause Analysis
 
Root-Cause-Analysis.pptx
Root-Cause-Analysis.pptxRoot-Cause-Analysis.pptx
Root-Cause-Analysis.pptx
 
Keys to Better Problem Solving
Keys to Better Problem SolvingKeys to Better Problem Solving
Keys to Better Problem Solving
 
ОКСАНА ГОРОЩУК «Improving Quality Through Root Cause Analysis»
ОКСАНА ГОРОЩУК «Improving Quality Through Root Cause Analysis»ОКСАНА ГОРОЩУК «Improving Quality Through Root Cause Analysis»
ОКСАНА ГОРОЩУК «Improving Quality Through Root Cause Analysis»
 
Capa, root cause analysis, and risk management
Capa, root cause analysis, and risk managementCapa, root cause analysis, and risk management
Capa, root cause analysis, and risk management
 
Prinsip prinsip-metode-analisis-akar-masalah xxx
Prinsip prinsip-metode-analisis-akar-masalah xxxPrinsip prinsip-metode-analisis-akar-masalah xxx
Prinsip prinsip-metode-analisis-akar-masalah xxx
 

Recently uploaded

Call Us ≽ 8377877756 ≼ Call Girls In Shastri Nagar (Delhi)
Call Us ≽ 8377877756 ≼ Call Girls In Shastri Nagar (Delhi)Call Us ≽ 8377877756 ≼ Call Girls In Shastri Nagar (Delhi)
Call Us ≽ 8377877756 ≼ Call Girls In Shastri Nagar (Delhi)dollysharma2066
 
Heart Disease Prediction using machine learning.pptx
Heart Disease Prediction using machine learning.pptxHeart Disease Prediction using machine learning.pptx
Heart Disease Prediction using machine learning.pptxPoojaBan
 
Arduino_CSE ece ppt for working and principal of arduino.ppt
Arduino_CSE ece ppt for working and principal of arduino.pptArduino_CSE ece ppt for working and principal of arduino.ppt
Arduino_CSE ece ppt for working and principal of arduino.pptSAURABHKUMAR892774
 
IVE Industry Focused Event - Defence Sector 2024
IVE Industry Focused Event - Defence Sector 2024IVE Industry Focused Event - Defence Sector 2024
IVE Industry Focused Event - Defence Sector 2024Mark Billinghurst
 
Biology for Computer Engineers Course Handout.pptx
Biology for Computer Engineers Course Handout.pptxBiology for Computer Engineers Course Handout.pptx
Biology for Computer Engineers Course Handout.pptxDeepakSakkari2
 
complete construction, environmental and economics information of biomass com...
complete construction, environmental and economics information of biomass com...complete construction, environmental and economics information of biomass com...
complete construction, environmental and economics information of biomass com...asadnawaz62
 
Why does (not) Kafka need fsync: Eliminating tail latency spikes caused by fsync
Why does (not) Kafka need fsync: Eliminating tail latency spikes caused by fsyncWhy does (not) Kafka need fsync: Eliminating tail latency spikes caused by fsync
Why does (not) Kafka need fsync: Eliminating tail latency spikes caused by fsyncssuser2ae721
 
Gfe Mayur Vihar Call Girls Service WhatsApp -> 9999965857 Available 24x7 ^ De...
Gfe Mayur Vihar Call Girls Service WhatsApp -> 9999965857 Available 24x7 ^ De...Gfe Mayur Vihar Call Girls Service WhatsApp -> 9999965857 Available 24x7 ^ De...
Gfe Mayur Vihar Call Girls Service WhatsApp -> 9999965857 Available 24x7 ^ De...srsj9000
 
Oxy acetylene welding presentation note.
Oxy acetylene welding presentation note.Oxy acetylene welding presentation note.
Oxy acetylene welding presentation note.eptoze12
 
8251 universal synchronous asynchronous receiver transmitter
8251 universal synchronous asynchronous receiver transmitter8251 universal synchronous asynchronous receiver transmitter
8251 universal synchronous asynchronous receiver transmitterShivangiSharma879191
 
Instrumentation, measurement and control of bio process parameters ( Temperat...
Instrumentation, measurement and control of bio process parameters ( Temperat...Instrumentation, measurement and control of bio process parameters ( Temperat...
Instrumentation, measurement and control of bio process parameters ( Temperat...121011101441
 
Churning of Butter, Factors affecting .
Churning of Butter, Factors affecting  .Churning of Butter, Factors affecting  .
Churning of Butter, Factors affecting .Satyam Kumar
 
Application of Residue Theorem to evaluate real integrations.pptx
Application of Residue Theorem to evaluate real integrations.pptxApplication of Residue Theorem to evaluate real integrations.pptx
Application of Residue Theorem to evaluate real integrations.pptx959SahilShah
 
Correctly Loading Incremental Data at Scale
Correctly Loading Incremental Data at ScaleCorrectly Loading Incremental Data at Scale
Correctly Loading Incremental Data at ScaleAlluxio, Inc.
 
Concrete Mix Design - IS 10262-2019 - .pptx
Concrete Mix Design - IS 10262-2019 - .pptxConcrete Mix Design - IS 10262-2019 - .pptx
Concrete Mix Design - IS 10262-2019 - .pptxKartikeyaDwivedi3
 
An experimental study in using natural admixture as an alternative for chemic...
An experimental study in using natural admixture as an alternative for chemic...An experimental study in using natural admixture as an alternative for chemic...
An experimental study in using natural admixture as an alternative for chemic...Chandu841456
 

Recently uploaded (20)

Call Us ≽ 8377877756 ≼ Call Girls In Shastri Nagar (Delhi)
Call Us ≽ 8377877756 ≼ Call Girls In Shastri Nagar (Delhi)Call Us ≽ 8377877756 ≼ Call Girls In Shastri Nagar (Delhi)
Call Us ≽ 8377877756 ≼ Call Girls In Shastri Nagar (Delhi)
 
young call girls in Green Park🔝 9953056974 🔝 escort Service
young call girls in Green Park🔝 9953056974 🔝 escort Serviceyoung call girls in Green Park🔝 9953056974 🔝 escort Service
young call girls in Green Park🔝 9953056974 🔝 escort Service
 
young call girls in Rajiv Chowk🔝 9953056974 🔝 Delhi escort Service
young call girls in Rajiv Chowk🔝 9953056974 🔝 Delhi escort Serviceyoung call girls in Rajiv Chowk🔝 9953056974 🔝 Delhi escort Service
young call girls in Rajiv Chowk🔝 9953056974 🔝 Delhi escort Service
 
Heart Disease Prediction using machine learning.pptx
Heart Disease Prediction using machine learning.pptxHeart Disease Prediction using machine learning.pptx
Heart Disease Prediction using machine learning.pptx
 
Arduino_CSE ece ppt for working and principal of arduino.ppt
Arduino_CSE ece ppt for working and principal of arduino.pptArduino_CSE ece ppt for working and principal of arduino.ppt
Arduino_CSE ece ppt for working and principal of arduino.ppt
 
IVE Industry Focused Event - Defence Sector 2024
IVE Industry Focused Event - Defence Sector 2024IVE Industry Focused Event - Defence Sector 2024
IVE Industry Focused Event - Defence Sector 2024
 
Biology for Computer Engineers Course Handout.pptx
Biology for Computer Engineers Course Handout.pptxBiology for Computer Engineers Course Handout.pptx
Biology for Computer Engineers Course Handout.pptx
 
complete construction, environmental and economics information of biomass com...
complete construction, environmental and economics information of biomass com...complete construction, environmental and economics information of biomass com...
complete construction, environmental and economics information of biomass com...
 
Call Us -/9953056974- Call Girls In Vikaspuri-/- Delhi NCR
Call Us -/9953056974- Call Girls In Vikaspuri-/- Delhi NCRCall Us -/9953056974- Call Girls In Vikaspuri-/- Delhi NCR
Call Us -/9953056974- Call Girls In Vikaspuri-/- Delhi NCR
 
Exploring_Network_Security_with_JA3_by_Rakesh Seal.pptx
Exploring_Network_Security_with_JA3_by_Rakesh Seal.pptxExploring_Network_Security_with_JA3_by_Rakesh Seal.pptx
Exploring_Network_Security_with_JA3_by_Rakesh Seal.pptx
 
Why does (not) Kafka need fsync: Eliminating tail latency spikes caused by fsync
Why does (not) Kafka need fsync: Eliminating tail latency spikes caused by fsyncWhy does (not) Kafka need fsync: Eliminating tail latency spikes caused by fsync
Why does (not) Kafka need fsync: Eliminating tail latency spikes caused by fsync
 
Gfe Mayur Vihar Call Girls Service WhatsApp -> 9999965857 Available 24x7 ^ De...
Gfe Mayur Vihar Call Girls Service WhatsApp -> 9999965857 Available 24x7 ^ De...Gfe Mayur Vihar Call Girls Service WhatsApp -> 9999965857 Available 24x7 ^ De...
Gfe Mayur Vihar Call Girls Service WhatsApp -> 9999965857 Available 24x7 ^ De...
 
Oxy acetylene welding presentation note.
Oxy acetylene welding presentation note.Oxy acetylene welding presentation note.
Oxy acetylene welding presentation note.
 
8251 universal synchronous asynchronous receiver transmitter
8251 universal synchronous asynchronous receiver transmitter8251 universal synchronous asynchronous receiver transmitter
8251 universal synchronous asynchronous receiver transmitter
 
Instrumentation, measurement and control of bio process parameters ( Temperat...
Instrumentation, measurement and control of bio process parameters ( Temperat...Instrumentation, measurement and control of bio process parameters ( Temperat...
Instrumentation, measurement and control of bio process parameters ( Temperat...
 
Churning of Butter, Factors affecting .
Churning of Butter, Factors affecting  .Churning of Butter, Factors affecting  .
Churning of Butter, Factors affecting .
 
Application of Residue Theorem to evaluate real integrations.pptx
Application of Residue Theorem to evaluate real integrations.pptxApplication of Residue Theorem to evaluate real integrations.pptx
Application of Residue Theorem to evaluate real integrations.pptx
 
Correctly Loading Incremental Data at Scale
Correctly Loading Incremental Data at ScaleCorrectly Loading Incremental Data at Scale
Correctly Loading Incremental Data at Scale
 
Concrete Mix Design - IS 10262-2019 - .pptx
Concrete Mix Design - IS 10262-2019 - .pptxConcrete Mix Design - IS 10262-2019 - .pptx
Concrete Mix Design - IS 10262-2019 - .pptx
 
An experimental study in using natural admixture as an alternative for chemic...
An experimental study in using natural admixture as an alternative for chemic...An experimental study in using natural admixture as an alternative for chemic...
An experimental study in using natural admixture as an alternative for chemic...
 

Presentation fish bone Diagram

  • 1. FISHBONE DIAGRAM(Cause & Effect Diagram) INTRODUCTION: WHEN YOU HAVE A SERIOUS PROBLEM, IT'S IMPORTANT TO EXPLORE ALL OF THE THINGS THAT COULD CAUSE IT, BEFORE YOU START TO THINK ABOUT A SOLUTION. A FISHBONE DIAGRAM, ALSO CALLED A CAUSE AND EFFECT DIAGRAM OR ISHIKAWA DIAGRAM.
  • 2. IT IS A VISUALIZATION TOOL FOR CATEGORIZING THE POTENTIAL CAUSES OF A PROBLEM IN ORDER TO IDENTIFY ITS ROOT CAUSES. A FISHBONE DIAGRAM IS USEFUL IN BRAINSTORMING SESSIONS TO FOCUS CONVERSATION.
  • 3. ONE CAN USED IT FOR • DISCOVER THE ROOT CAUSE OF A PROBLEM • UNCOVER BOTTLENECKS IN YOUR PROCESSES. • IDENTIFY WHERE AND WHY A PROCESS ISN'T WORKING
  • 4. STRUCTURE • THE DESIGN OF THE DIAGRAM LOOKS MUCH LIKE A SKELETON OF A FISH. • FISHBONE DIAGRAMS ARE TYPICALLY WORKED RIGHT TO LEFT, WITH EACH LARGE OF THE FISH BRANCHING OUT TO INCLUDE SMALLER BONES CONTAINING MORE DETAIL.
  • 5. Fishbone diagrams are used in the "analyze" phase of Six Sigma’s DMAIC (define, measure, analyze, improve, control) approach to problem solving.
  • 6. 4 Reason to use Fish Bone Diagram 1) DISPLAY RELATIONSHIP 2) SHOW ALL CAUSES SIMULTANEOUSLY 3) FACILITATE BRAINSTORMING 4) HELP MAINTAIN TEAM FOCUS
  • 7. HOW TO USE THE TOOL STEP 1: IDENTIFY THE PROBLEM FIRST, WRITE DOWN THE EXACT PROBLEM YOU FACE. WHERE APPROPRIATE, IDENTIFY WHO IS INVOLVED, WHAT THE PROBLEM IS, AND WHEN AND WHERE IT OCCURS. THEN, WRITE THE PROBLEM A BOX ON THE LEFT-HAND SIDE OF A LARGE SHEET OF PAPER, AND DRAW A LINE ACROSS THE HORIZONTALLY FROM THE BOX. THIS ARRANGEMENT, LOOKING LIKE THE HEAD AND SPINE OF A GIVES YOU SPACE TO DEVELOP IDEAS.
  • 8. Step 2: Work Out the Major Factors Involved Next, identify the factors that may be part of the problem. These may be systems, equipment, materials, forces, people involved with the problem, and so on. Try to draw out as many of these as possible. As a starting point, you can use models such as 7S or the 4 Ps. Step 3: Identify Possible Causes  Now, for each of the factors you considered in step 2, brainstorm possible causes of the problem that may related to the factor.  Show these possible causes as shorter lines coming off the "bones" of the diagram. Where a cause is large complex, then it may be best to break it down into sub-causes. Show these as lines coming off each cause
  • 9. STEP 4: ANALYZE YOUR DIAGRAM BY THIS STAGE YOU SHOULD HAVE A DIAGRAM SHOWING ALL OF THE POSSIBLE CAUSES OF THE PROBLEM THAT YOU CAN THINK OF. DEPENDING ON THE COMPLEXITY AND IMPORTANCE OF THE PROBLEM, YOU CAN NOW THE MOST LIKELY CAUSES FURTHER. THIS MAY INVOLVE SETTING UP INVESTIGATIONS, CARRYING OUT SURVEYS, AND SO ON. THESE WILL BE DESIGNED TO TEST WHICH OF THESE POSSIBLE ACTUALLY CONTRIBUTING TO THE PROBLEM
  • 10. Traffic congestion In Karachi Strategy Staff Equipment System Uneducated Politics System improper challan system Improper Pedistrian traffic rules wrong planning improper training Uneducated dishonest lack of CCTV Unfit traffic signal
  • 11.  TIP:  A useful way to use this technique with a team is to write all of the possible causes of the problem down on sticky notes. You can then group similar ones together on the diagram.  This approach is sometimes called CEDAC (Cause and Effect Diagram with Additional Cards) and was developed by Dr. Ryuji Fukuda, a Japanese expert on continuous improvement.