1. Turning Moment Diagrams
and Flywheel
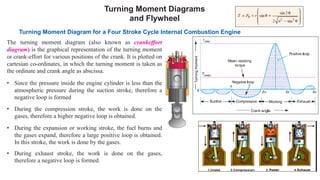
Turning Moment Diagram for a Four Stroke Cycle Internal Combustion Engine
• Since the pressure inside the engine cylinder is less than the
atmospheric pressure during the suction stroke, therefore a
negative loop is formed
• During the compression stroke, the work is done on the
gases, therefore a higher negative loop is obtained.
• During the expansion or working stroke, the fuel burns and
the gases expand, therefore a large positive loop is obtained.
In this stroke, the work is done by the gases.
• During exhaust stroke, the work is done on the gases,
therefore a negative loop is formed.
The turning moment diagram (also known as crankeffort
diagram) is the graphical representation of the turning moment
or crank-effort for various positions of the crank. It is plotted on
cartesian co-ordinates, in which the turning moment is taken as
the ordinate and crank angle as abscissa.
2. Turning Moment Diagram for a Single Cylinder
Double Acting Steam Engine
• From the above expression, we see that the turning moment (T ) is zero,
when the crank angle (θ) is zero. It is maximum when the crank angle is
90° and it is again zero when crank angle is 180°.
• This is shown by the curve abc shown in Fig and it represents the turning
moment diagram for outstroke. The curve cde is the turning moment
diagram for instroke and is somewhat similar to the curve abc.
• Since the work done is the product of the turning moment and the angle
turned, therefore the area of the turning moment diagram represents the
work done per revolution.
• In actual practice, the engine is assumed to work against the mean
resisting torque, as shown by a horizontal line AF. The height of the
ordinate aA represents the mean height of the turning moment diagram.
• Since it is assumed that the work done by the turning moment per
revolution is equal to the work done against the mean resisting torque,
therefore the area of the rectangle aAFe is proportional to the work
done against the mean resisting torque.
3. Notes:
1. When the turning moment is positive (i.e. when the engine torque
is more than the mean resisting torque) as shown between points B
and C (or D and E) in Fig. the crankshaft accelerates and the work is
done by the steam.
2. When the turning moment is negative (i.e. when the engine torque
is less than the mean resisting torque) as shown between points C and
D in Fig. 16.1, the crankshaft retards and the work is done on the
steam.
3. If , T = Torque on the crankshaft at any instant, and
Tmean = Mean resisting torque.
Then accelerating torque on the rotating parts of the engine
= T – Tmean
4. If (T –Tmean) is positive, the flywheel accelerates and if (T – Tmean)
is negative, then the flywheel retards.
4. Turning Moment Diagram for a Multi-cylinder Engine
The cranks, in case of three cylinders, are usually placed at 120°
to each other.
A separate turning moment diagram for a compound
steam engine having three cylinders and the resultant turning
moment diagram is shown in Fig.
The resultant turning moment diagram is the sum of the turning
moment diagrams for the three cylinders.
5.
6. Fluctuation of Energy
The fluctuation of energy may be determined by the turning moment
diagram for one complete cycle of operation. Consider the turning moment
diagram for a single cylinder double acting steam engine as shown in Fig.
We see that the mean resisting torque line AF cuts the turning moment
diagram at points B, C, D and E. When the crank moves from a to p, the
work done by the engine is equal to the area aBp, whereas the energy
required is represented by the area aABp.
In other words, the engine has done less work (equal to the area a AB)
than the requirement. This amount of energy is taken from the flywheel
and hence the speed of the flywheel decreases.
Now the crank moves from p to q, the work done by the engine is equal to
the area pBbCq, whereas the requirement of energy is represented by the
area pBCq. Therefore, the engine has done more work than the
requirement. This excess work (equal to the area BbC) is stored in the
flywheel and hence the speed of the flywheel increases while the crank
moves from p to q.
The variations of energy above and below the
mean resisting torque line are called fluctuations
of energy. The areas BbC, CcD, DdE, etc.
represent fluctuations of energy.
7. The difference between the maximum and the minimum
energies is known as maximum fluctuation of energy.
A little consideration will show that the engine has a maximum
speed either at q or at s. This is due to the fact that the flywheel
absorbs energy while the crank moves from p to q and from r to s.
On the other hand, the engine has a minimum speed either at p or at
r. The reason is that the flywheel gives out some of its energy when
the crank moves from a to p and q to r.
8. Determination of Maximum Fluctuation of Energy
A turning moment diagram for a multi-cylinder engine is shown by a wavy curve in Fig. The horizontal line AG represents the
mean torque line. Let a1, a3, a5 be the areas above the mean torque line and a2, a4 and a6 be the areas below the mean torque
line. These areas represent some quantity of energy which is either added or subtracted from the energy of the moving parts of
the engine.
9. Coefficient of Fluctuation of Energy
It may be defined as the ratio of the maximum fluctuation of energy to the work done per cycle. Mathematically, coefficient
of fluctuation of energy,
The work done per cycle (in N-m or joules) may be obtained by using the following two relations :
• Since the work done is the product of the
turning moment and the angle turned, therefore
the area of the turning moment diagram
represents the work done per revolution.
10. Flywheel
A flywheel used in machines serves as a reservoir, which stores energy during the period when the supply of energy is more
than the requirement, and releases it during the period when the requirement of energy is more than the supply.
when the flywheel absorbs energy, its speed increases and when
it releases energy, the speed decreases.
Hence a flywheel does not maintain a constant speed, it simply reduces the
fluctuation of speed.
In other words, a flywheel controls the speed variations caused by the
fluctuation of the engine turning moment during each cycle of operation.
11. Coefficient of Fluctuation of Speed
The difference between the maximum and minimum speeds during a cycle is called the maximum fluctuation of speed.
The ratio of the maximum fluctuation of speed to the mean speed is called the coefficient of fluctuation of speed.
N1 and N2 = Maximum and minimum speeds in r.p.m. during the cycle, and
∴ Coefficient of fluctuation of speed,
Note.
The reciprocal of the coefficient of fluctuation of speed is
known as coefficient of steadiness and is denoted by m.
12. Energy Stored in a Flywheel
A flywheel is shown in Fig. We have discussed that when a flywheel absorbs
energy, its speed increases and when it gives up energy, its speed decreases.
We know that the mean kinetic energy of the flywheel,
m = Mass of the flywheel in kg,
k = Radius of gyration or radius
of the flywheel in metres,
As the speed of the flywheel changes from ω1 to ω2, the maximum fluctuation of energy,
ΔE = Maximum K.E. – Minimum K.E.
13. The radius of gyration (k) may be taken equal to the mean radius of the rim (R), because the thickness of rim is very
small as compared to the diameter of rim. Therefore, substituting k = R, in equation , we have
14. Δ E=Maximum fluctuation of energy,
m = Mass of the flywheel in kg
,
k or R = Radius of gyration or radius of the
flywheel in metres,
2.
Important Formula’s
16. Problem 1. The turning moment diagram for a petrol engine is drawn to the following scales : Turning moment, 1
mm = 5 N-m ; crank angle, 1 mm = 1°. The turning moment diagram repeats itself at every half revolution of the
engine and the areas above and below the mean turning moment line taken in order are 295, 685, 40, 340, 960, 270
mm2. The rotating parts are equivalent to a mass of 36 kg at a radius of gyration of 150 mm. Determine the
coefficient of fluctuation of speed when the engine runs at 1800 r.p.m.
Solution. Given : m = 36 kg ; k = 150 mm = 0.15 m ; N = 1800 r.p.m. or ω = 2 π × 1800/60 = 188.52 rad /s
17. Pbm 2. The turning moment diagram for a multicylinder engine has been drawn to a scale 1 mm = 600 N-m
vertically and 1 mm = 3° horizontally. The intercepted areas between the output torque curve and the mean
resistance line, taken in order from one end, are as follows : + 52, – 124, + 92, – 140, + 85, – 72 and + 107 mm2,
when the engine is running at a speed of 600 r.p.m. If the total fluctuation of speed is not to exceed 1.5% of the
mean, find the necessary mass of the flywheel of radius 0.5 m.
Solution. Given : N = 600 r.p.m. or ω = 2 π × 600 / 60 = 62.84 rad / s ; R = 0.5 m
19. Pbm 1. A horizontal cross compound steam engine develops 300 kW at 90 r.p.m. The coefficient of fluctuation of
energy as found from the turning moment diagram is to be 0.1 and the fluctuation of speed is to be kept within ±
0.5% of the mean speed. Find the mass of the flywheel required, if the radius of gyration is 2 metres.
20. Prob 2. The Turning Moment Diagram for an engine consists of 2 isosceles triangles. Maximum height for each triangle represents
T.M 1000 Nm. The base of each triangle = π radians. If the engine runs at 200 rpm and total fluctuation of speed is not to exceed
3%.
Find: 1. Power of an Engine, 2. Mass of flywheel, if radius of flywheel is 0.25 m.
21.
22. Prob 3. The Turning Moment Diagram (TMD) of a single cylinder double acting engine consists of 2 isosceles triangles. The maximum
T.M. are 2000 and 1500 Nm respectively when the engine works against a uniform resistance at a mean speed of 240 rpm.
Find: 1. Power, 2. Maximum Fluctuation of energy, 3. Mass of flywheel.
If radius of gyration = 0.75 m and the fluctuation of speed is limited to ±1% of mean speed concentrated at 0.25 m radius.
25. Prob 1. The TMD for a four stroke gas engine may be assumed for simplicity to be represented by 4 triangles the areas of which
from the line of zero line are as follows.
Suction stroke: 3.5 cm2
Compression stroke: 14 cm2
Expansion stroke: 35.5 cm2
Exhaust 5: 5 cm2
Each cm2 295 Nm of work. Assuming the resisting moment to be uniform find the mass of the rim of the flywheel
required to keep the mean speed 200 rpm within ±2% the mean. Radius of the rim may be taken as 75 cm.
26.
27. Prob 2. A single cylinder single acting 4 stroke gas engine develops 18.4 kW at 300 rpm with WD by the gases during the
expansion stroke is 3 times the WD on the gases during compression stroke. The WD during suction and exhaust being negligible
and the total fluctuation is 2% of mean. The TMD during expansion is assumed to be triangular in shape. Find the moment of
inertia of the flywheel.
28.
29. Prob 3. A gas engine working on Otto cycle is provided with 2 flywheels each of mass 140 kg and radius of gyration 0.7 m. The
cylinder is 0.24 m diameter, stroke = 0.27 m, and the mean speed is 250 rpm. The mean pressure during the cycles are:
1. Suction stroke pressure = 0
2. Compression stroke pressure = 10.6 N/cm2
3. Firing stroke pressure = 62 N/cm2
4. Exhaust stroke pressure = 3 N/cm2
If the resistance is to be constant. Find the percentage variation of speed of engine.