
Recommended
More Related Content
What's hot
What's hot (20)
Similar to cbc histogram.pdf
Similar to cbc histogram.pdf (20)
Recently uploaded
Recently uploaded (20)
cbc histogram.pdf
- 1. HISTOGRAM INTERPRETATION By Dr. Mohammed Al Mansor
- 2. Histograms • Histograms are graphical representations of the blood cell populations. • An automated haematology analyser provides blood cell histograms by plotting the sizes of different blood cells on X-axis and their relative number on Y-axis. • Histogram interpretation needs careful analysis of Red Blood Cell (RBC), White Blood Cell (WBC) and platelet distribution curves.
- 3. Histograms • Discriminator Separates cell types by • size • Shape of peak • Debris/other cell types
- 4. Histograms Histograms can help verify • the differential cell counts. • serve as a quality control check. • identify uncommon disease processes. • and indicate sample integrity.
- 5. Histograms
- 6. RBC- and PLT-Histograms • The two distribution curves are separated from each other by a moving auto discriminator looking to the Plateau. • Platelets have a size between 8 and 12 fl and are counted between 2 and 30 fl. • Erythrocytes have a size of 80-100 fl and are counted between 25 and 250 fl.
- 7. • The Size Distribution Curve should always start on the base line and fall between the lower and the upper discriminator
- 8. Erythrocyte-Histogram Flagging Mark “ RL “, abnormal height at lower discriminator Possible causes: • Giant Platelets • Micro-Erythrocytes • Platelet Clumps Caution: All results marked with “ RL “ should be controlled.
- 9. Erythrocyte-Histogram Flagging Mark “ RU “, abnormal height at the upper discriminator. Possible causes: • Cold Agglutinins (check MCHC > 40 g/dl) • Erythroblasts / Normoblasts • Caution : RBC-result and all results marked with “ RL “ should be controlled.
- 10. Erythrocyte-Histogram Flagging “ MP “, multiple peaks found Possible causes: • Iron deficiency in therapy • Infection or Tumor Anemia (visceral iron deficiency) • Transfusions
- 11. Erythrocyte-Histogram Distribution width “DW “, abnormal histogram distribution • Distribution curve does not cross 20% level twice. • The overall height of the curve is always 100 %. The width is calculated on the 20 % height of the curve. • Hint for extreme Aniso- or. Poikilocytosis
- 12. Erythrocyte-Histogram Distribution width RDW-CV RDW-CV (%) = 100 x δ/μ RDW-CV = 11 - 16 % RBC Distribution Curve as a parameter for anisocytosis
- 13. Thrombocyte-Histogram • The histogram should lay within the two discriminators and start and end on the base line. • PLT counted between 2 fl and 30 fl. • 1 flexible Discriminator PL 2 to 6 fl. • 1 flexible Discriminator PU 12-30 fl. • 1 fixed Discriminator at 12 fl
- 14. Thrombocyte-Histogram Parameters of the Thrombocyte histogram – MPV (mean PLT volume) Ref range: 8 - 12 fl – P-LCR (ratio of large platelets) Ref range: 15 - 35 % – Increase could be a sign for: • PLT Clumps • Giant PLT • Microerythrocytes – PDW, (platelet distribution width at 20 % of peak height Ref range: 9 - 14 fl Increase could be a sign for: • PLT Clumps • Microerythrocytes • Fragments
- 15. Thrombocyte-Histogram Mark “ PL “, abnormal height at lower discriminator Possible cause: • High blank value • Cell fragments Caution : Check Blank! Auto Rinse
- 16. Thrombocyte-Histogram Mark “ PU “, abnormal height at upper discriminator Possible Cause : • PLT Clumps EDTA-Incombatibility Clotted sample • Giant Platelets • Microerythrocytes • Caution : Check PLT-Result (and all parameters marked with “ PU “! In the event of perform the counting chamber or check PLT via Fonio!
- 17. Thrombocyte-Histogram Mark “ MP “, Multi Peaks found Possible Cause: • Platelet transfusion Mark “ DW “, Distribution With
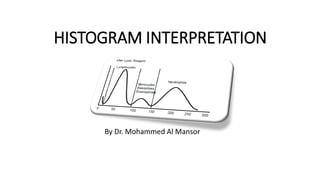
- 18. Leukocyte-Histogram Important : • The distribution curve should be within the discriminators. The curve should start and end at the basis line. • The LD is flexible, but can not be lower than 30 fl. • The WBC-channel shows Leukocytes and Thrombocytes ( Erythrocytes are lysed). • The volume of the Thrombocyts is usually between 8 - 12 fl, therefore the LD at the WBC-Histogramm seperates the Leukocytes from the Thrombocytes. (Thrombocytes were not counted).
- 19. Leukocyte-Histogram Flag “ WL “, Curve does not begin at the basis line Possible causes : • PLT Clumps EDTA-Incombatibility coagulated Sample • high osmotic resistant (Erythrocytes not lysed) • Erythroblasts • cold agglutinate Caution : Check WBC – Result and all parameters marked with “WL”
- 20. Leukocyte-Histogram 2. Flag “ WU “, Curve does not end at the base line. • Caution: Check WBC – Result and all parameters marked with “WL” • Dilute sample 1:5 ? (high leukocyte count ? )
- 21. Leukocyte-Histogram 3. Flag “T1” and “T2” • T1 and T2 are valley discriminators defined by the plateau. • This discriminators separates the Leukocytes populations. • The discriminators are flexible and will be set automatically according to the sample. • In special cases is a separation from the valley discriminators not possible.
- 23. Leukocyte-Histogram 3. Flag “F1” , “F2” and “F3” The Histogram of the Leukocytes is limited from the outer discriminators LD and UD. All Leukocytes are counted; WBC total is correct. (Assumption: no other flags) • T 1 and T 2 were detected. • Conspicuous is: The troughs are away from the basis line.
- 24. Leukocyte-Histogram • There is a potential of mixing populations. • F 1 and F 2 move together, also F2 and F3. • To get a correct differential it is necassary to do a manual differentiation.
- 25. Clinical diagnosis: Neutrophilia Prominent peak with broad distribution (NEUT%) for large leukocytes. In case of Lymphocytopenia a similar curve is obtained. Clinical diagnosis: Lymphocytosis High, pointed peak in lympho area (LYM%). In case of Neutropenia a similar curve is obtained.
- 26. Clinical diagnosis: Monocytosis Monocytes, which are the largest leukocytes in normal peripheral blood, become smaller than neutrophils under the influence of the lysing reagent. On the histogram, they fall in the middle cell ratio (MXD%) ( ) . Similar patterns can be seen in eosinophilia. These two different clinical entities need to be differentiated from each other by manual differential Clinical diagnosis : Eosinophilia Eosinophils and basophils, which are categorized as granulocytes together with neutrophiles, are smaller than neutrophils due to contraction under the influence of the lysing reagent. On the histogram, they are located in the middle cell ratio MXD%( ) where also monocytes are present. A similar pattern can be seen in monocytosis. Both diseases must be differentiated from each other by
- 27. WBC Agglutination Case: WBC-Agglutination This is a case of WBC agglutination, which occurs rather rarely. The histogram does not shown a clear tri-modal pattern, with particles present in the region above 250 fl ( ). The count of leukocytes is likely to be falsely low. Depending on the nature of leucocytes antibodies, agglutination may be dissolvable and measurement may become possible upon incubation the at 37 o C or upon washing the samples with isotonic saline.
- 28. Nucleated red blood cells (NRBC) Case: Orthochromatic Erythroblasts (NRBC‘s) at a concentration of 1352/100 WBC This is a sample with an extreme number of NRBC. The valley between the erythrocytes ghost area and the small leucocytes area exceeds the limit, and WL flags are given. NRBC are likely to contribute significantly to the population on the WBC histogram ( ) ; therefore most of them are counted as leukocytes. Measurement of samples having NRBC must be corrected by the following equation: corrected WBC Count = measured WBC Count x 100/ (100 + NRBC count *) * NRBC Count: The number of NRBC per 100 leukocytes
- 29. Anemia 1. Case: Results: MCV, MCH and MCHC shows low values and RDW-SD shows a high value. Differential: hypochromic RBC´s Thus this case is identified as microcytic hypochromic anemia
- 30. Anemia 2. Case: Results: MCV, MCH and MCHC shows low values Differential: no prominence in the smear Due to the increase in erythrocyte count and the low RDW value this case is cassified as a thalassaemia minor.
- 31. Anemia The initial effect of the treatment can be seen in data of the 2th week, where the RBC histogram indicates the appearance of normocytic cells while a large number of microcytic cells still are visible in the smear. The RBC histogram of the 4th week still shows a 2-peak curve, but the peak of larger cells became more prominent than the other peak. Compared to the top diagram, this shows an further increase in the number of normocytes as a result of the treatment.
- 32. Anemia This is a macrocytic anaemia with development of chronic myelogenous leukemia (CML). The RBC histogram suggests the existence of macrocytes, while the WBC histogram does not show, the valley normally seen between the MXD and the large cell ratio, suggesting the appearance of leukocytes with various sizes.
- 33. Anisocytosis Microcytes and macrocytes are visible among normocytes in the smear, and the distribution on the RBC histogram is abnormally wide. This suggest the appearance of various sizes of erythrocytes.
- 34. Anisocytosis The distribution width of the RBC histogram is abnormally wide as seen in case 1, but the proportion of erythrocytes below 90 fl is higher in case 2. The PLT histogram indicates abnormality and the PL and DW flags are given. This suggest that microcytes may have interferred with the Platelet count. Such result needs to be confirmed by other methods, like Fonio method or counting chamber.
- 35. Poikilocytosis Two cases: Poikilocytosis with a lot of echinocytes The abnormally wide distribution on the RBC histogram suggests the appearance of various sizes of erythrocytes with a high percentage of microcytes.
- 36. Large Platelets Case 1: Giant platelets The abnormally wide distribution on the PLT histogram suggests the appearance of giant platelets. The distribution curve intersects the discriminator line at a low point, which shows that the platelet count has been measured correctly. Case 2: large platelets Although the wide distribution on the PLT histogram suggests the appearance of large platelets, the distribution curve intersects the discrimination line at a high point. This result needs to be confirmed by other methods i.e Fonio method or counting chamber.
- 37. Platelet Aggregation Case 1: Platelet Aggregation The smear clearly shows that platelets are aggregating. The WBC histogram shows a peak in the ghost area ( ) , while the PLT histogram shows a wide distribution. Although these large particles usually affect the leucocyte counts, the leukocytes distribution of case 1 is well separated from the ghost area on the WBC histogram, probably without any effect of small particles in the ghost area. There is no WL Alarm given .
- 38. Platelet Aggregation Case 2: Platelet Aggregation This sample contains larger aggregation clusters as shown in the smear. These clusters are considered affect the leukocyte counts, because the distribution curve on the WBC histogram intersects the discriminator line between the ghost and the Small cell ratio at a high point, and the WL flags are given. The PLT histogram suggests the presence of large particles. Analysis of a fresh blood sample is required to obtain correct platelet values.
- 39. Cold Agglutinins Case: Cold agglutinins Because in this case erythrocytes have passed through the detector as clusters of several cells, the RBC, HCT,MCH, MCV, MCHC and RDW values are abnormal. The RBC histogram shows a second peak. After the clusters have been dissolved by incubation, all erythrocytes are detected as single cells. Therefore the second peak on the RBC histogram does not appear and the RBC, HCT, MCV, MCH, MCHC and RDW values are normal.
- 40. Insufficient Lysing of Erythrocytes Case: Lyse Resistance RBC The histogram show a pattern typically seen in insufficient lysing of erythrocytes. On the WBC histogram the distribution curve intersects the WBC lower discrimination line at an abnormally high point. The WL flag is output and asterisk marks are put to the leucocyte value, warning of low reliability of the data. This is frequently seen with blood samples taken from hepatic disease patients or very early newborns. These problems are solvedby diluting the sample or replacing plasma with cellpack (blood cell washing). The smear photo shows large platelets and acantocytes, suggesting hepatic diseases. Ref. sysmex K-Series: Histogram Interpretation