1. 1
THE CHI-SQUARE DISTRIBUTION
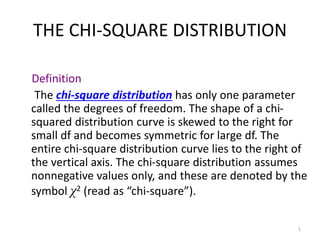
Definition
The chi-square distribution has only one parameter
called the degrees of freedom. The shape of a chi-
squared distribution curve is skewed to the right for
small df and becomes symmetric for large df. The
entire chi-square distribution curve lies to the right of
the vertical axis. The chi-square distribution assumes
nonnegative values only, and these are denoted by the
symbol χ2 (read as “chi-square”).
3. 3
Example 11-1
Find the value of χ² for 7 degrees of freedom
and an area of .10 in the right tail of the chi-
square distribution curve.
4. 4
Table 11.1 χ2 for df = 7 and .10 Area in the Right Tail
Area in the Right Tail Under the Chi-Square Distribution
Curve
df .995 … .100 … .005
1
2
.
7
.
100
.000
.010
…
.989
…
67.328
…
…
…
…
…
…
2.706
4.605
…
12.017
…
118.498
…
…
…
…
…
…
7.879
10.597
…
20.278
…
140.169
Required value of χ
²
6. 6
A Test of Independence
Definition
A test of independence involves a test of the
null hypothesis that two attributes of a
population are not related. The degrees of
freedom for a test of independence are
df = (R – 1)(C – 1)
Where R and C are the number of rows and the
number of columns, respectively, in the given
contingency table.
7. 7
Test Statistic for a Test of Independence
The value of the test statistic χ2 for a test of
independence is calculated as
where O and E are the observed and expected
frequencies, respectively, for a cell.
A Test of Independence cont.
E
E
O 2
2 )
(
8. 8
Example 11-5
Violence and lack of discipline have become
major problems in schools in the United States.
A random sample of 300 adults was selected,
and they were asked if they favor giving more
freedom to schoolteachers to punish students
for violence and lack of discipline. The two-way
classification of the responses of these adults is
represented in the following table.
9. 9
Calculate the expected frequencies for this
table assuming that the two attributes,
gender and opinions on the issue, are
independent.
Example 11-5
In Favor
(F)
Against
(A)
No Opinions
(N)
Men (M)
Women (W)
93
87
70
32
12
6
10. 10
Table 11.6
Solution 11-5
In Favor
(F)
Against
(A)
No Opinion
(N)
Row
Totals
Men (M) 93 70 12 175
Women (W) 87 32 6 125
Column Totals 180 102 18 300
11. 11
Expected Frequencies for a Test of
Independence
The expected frequency E for a cell is
calculated as
size
sample
)
lumn total
total)(Co
Row
(
E
12. 12
Table 11.7
Solution 11-5
In Favor
(F)
Against
(A)
No Opinion
(O)
Row
Totals
Men (M)
93
(105.00)
70
(59.50)
12
(10.50)
175
Women (W)
87
(75.00)
32
(42.50)
6
(7.50)
125
Column
Totals
180 102 18 300
13. 13
Example 11-6
Reconsider the two-way classification table given in
Example 11-5. In that example, a random sample of
300 adults was selected, and they were asked if they
favor giving more freedom to schoolteachers to punish
students for violence and lack of discipline. Based on
the results of the survey, a two-way classification table
was prepared and presented in Example 11-5. Does
the sample provide sufficient information to conclude
that the two attributes, gender and opinions of adults,
are dependent? Use a 1% significance level.
14. 14
Solution 11-6
• H0: Gender and opinions of adults are
independent
• H1: Gender and opinions of adults are
dependent
19. 19
Solution 11-6
• The value of the test statistic χ2 = 8.252
- It is less than the critical value of χ2
- It falls in the nonrejection region
• Hence, we fail to reject the null hypothesis