SlideShare a Scribd company logo
1 of 34
Download to read offline
Global Micro Irrigation Market (Drip Irrigation, Sprinkler
Irrigation), By Region, By Country (2018 Edition):
Opportunities and Forecast (2013 – 2023)
• By Type – Drip Irrigation, Sprinkler Irrigation
• By Region - North America, Europe, Asia
Pacific and ROW.
• By Country - U.S., Mexico, United Kingdom,
Italy, India, China, Australia, Israel
June 2018
Scope of the Report – Global Micro-Irrigation Market
2
2013 2014 2015 2016 2017 2018 2019 2020 2021 2022 2023
Global
Market (By Value)
By Product Type,
By Value
Drip
Irrigation
Sprinkler
Irrigation
Regional
Market (By Value)
By Product Type
,By Value
Drip
Irrigation
Sprinkler
Irrigation
Country
Market (By Value)
By Product Type,
By Value
Drip
Irrigation
Sprinkler
Irrigation
Company Analysis Netafim Ltd, The Toro Company, Jain Irrigations, T-L Irrigations, Valmont Industries, Lindsay Corporation, Nelson , Rivulis Corporation etc.
Regional Analysis North America, Europe, APAC, ROW
Country Analysis U.S., Mexico, United Kingdom, Italy, India, China, Australia, Israel
Historical Forecast
Table of Content
3
S.No Particulars Page No.
1. Research Methodology 21
2. Executive Summary 22
4. Micro Irrigation Outlook 23
5. Global Micro Irrigation Market: Growth and Forecast 34
5.1 By Value (2013-2017) 34
5.2 By Value (2018-2023) 35
6 Global Micro Irrigation Market Size, By Segment : Breakdown (%) 46
6.1 Global Micro Irrigation Market Size, By Segment, 2017 (%) 48
6.2 Global Micro Irrigation Market Size, By Segment, 2023 (%) 49
Table of Content
4
S.No Particulars Page No.
7 Global Micro Irrigation Market – Segment Analysis
7.1 Drip Irrigation, By Value (2013-2023) 51
7.2 Sprinkler Irrigation Market, By Value (2013-2023) 51
8 Global Micro Irrigation Market, By Regional Analysis : Breakdown (%) 55
8.1 Global Micro Irrigation Market Size, By Region, 2017 (%) 56
8.2 Global Micro Irrigation Market Size, By Region, 2023 (%) 57
9 Global Micro Irrigation Market Size: Regional Analysis
9.1 North America Micro Irrigation Market: Growth and Forecast 58
Table of Content
5
S.No Particulars Page No.
9.1.1 By Value (2013-2017) 59
9.1.2 By Value (2018-2023) 60
9.2
North America Micro Irrigation Market Size: Segment Analysis 65
9.2.1 North America Micro Irrigation Market Size, By Segment (2013-2017) 66
9.2.2 North America Micro Irrigation Market Size, By Segment (2018-2023) 67
9.3 United States Micro Irrigation Market 69
9.3.1 United Kingdom Micro Irrigation Market Size, 2013-2023 (USD Million) 70
9.4 United States Micro Irrigation Market Size: Segmental Analysis
9.4.1
United States Micro Irrigation Market, By Segment 2013-2017 (USD
Million)
71
9.4.2
United States Micro Irrigation Market, By Segment 2018-2023 (USD
Million) 72
9.5 Mexico Micro Irrigation Market 79
9.5.1 Mexico Micro Irrigation Market Size, 2013-2023 (USD Million) 79
Table of Content
6
S.No Particulars Page No.
9.6 Mexico Micro Irrigation Market Size: Segment Analysis
9.6.2 Mexico Micro Irrigation Market: By Segment, 2013-2017 (USD Million) 80
9.6.3 Mexico Micro Irrigation Market : By Segment, 2018-2023 (USD Million) 81
10. Europe Micro Irrigation Market
10.1 Europe Micro Irrigation Market: Growth and Forecast 87
10.1.1 By Value (2013-2017) 88
10.1.2 By Value (2018-2023) 89
10.2 Europe Micro Irrigation Market Size: Segment Analysis 96
10.2.1 Europe Micro Irrigation Market Size, By Segment (2013-2017) 97
10.2.2 Europe Micro Irrigation Market Size, By Segment (2018-2023) 98
Table of Content
7
S.No Particulars Page No.
10.3 United Kingdom Micro Irrigation Market 100
10.3.1 United Kingdom Micro Irrigation Market Size, 2013-2023 (USD Million) 101
10.4 United Kingdom Micro Irrigation Market : Segmental Analysis
10.4.1 United Kingdom Micro Irrigation Market: By End Users, 2013-2017 (USD Million) 102
10.4.2 United Kingdom Micro Irrigation Market : By End Users, 2018-2023 (USD Million) 102
10.5 Italy Micro Irrigation Market 106
10.5.1 Italy Micro Irrigation Market Size, 2013-2023 (USD Million) 107
10.6 Italy Micro Irrigation Market : Segment Analysis
10.6.1 Italy Micro Irrigation Market: By End Users, 2013-2017 (USD Million) 108
10.6.2 Italy Micro Irrigation Market : By End Users, 2018-2023 (USD Million) 109
Table of Content
8
S.No Particulars Page No.
11 APAC Micro Irrigation Market 116
11.1 APAC Micro Irrigation Market: Growth and Forecast
11.1.1 By Value (2013-2017) 117
11.1.2 By Value (2018-2023) 118
11.2 APAC Micro Irrigation Market Size: Segment Analysis
11.2.1 APAC Micro Irrigation Market Size, By Segmental Analysis (2013-2017) 123
11.2.2 APAC Micro Irrigation Market Size, By Segmental Analysis (2018-2023) 124
11.3 India Micro Irrigation Market 126
11.3.1 India Micro Irrigation Market Size, 2013-2023 (USD Million) 127
11.4 India Micro Irrigation Market : Segment Analysis
11.4.1 India Micro Irrigation Market: By End Users, 2013-2017 (USD Million) 128
11.4.2 India Micro Irrigation Market: By End Users, 2013-2017 (USD Million) 129
Table of Content
9
S.No Particulars Page No.
11.5 China Micro Irrigation Market 143
11.5.1 China Micro Irrigation Market Size, 2013-2023 (USD Million) 144
11.6 China Micro Irrigation Market : Segment Analysis
11.6.1 China Micro Irrigation Market: By End Users, 2013-2017 (USD Million) 145
11.6.2 China Micro Irrigation Market : By End Users, 2018-2023 (USD Million) 146
11.7 Australia Micro Irrigation Market
11.7.1 Australia Micro Irrigation Market Size, 2013-2023 (USD Million) 152
11.8 Australia Micro Irrigation Market : Segment Analysis
11.8.1 Australia Micro Irrigation Market: By End Users, 2013-2017 (USD Million) 153
11.8.2 Australia Micro Irrigation Market : By End Users, 2018-2023 (USD Million) 154
Table of Content
10
S.No Particulars Page No.
12 ROW Micro Irrigation Market
12.1 ROW Micro Irrigation Market: Growth and Forecast
12.1.1 By Value (2013-2017) 161
12.1.2 By Value (2018-2023) 161
12.2 ROW Micro Irrigation Market Size: Segment Analysis
11.2.1 ROW Micro Irrigation Market Size, By Segmental Analysis (2013-2017) 161
11.2.2 ROW Micro Irrigation Market Size, By Segmental Analysis (2018-2023) 161
12.3 Israel Micro Irrigation Market
12.3.1 Israel Micro Irrigation Market Size, 2013-2023 (USD Million) 165
12.4 Israel Micro Irrigation Market : Segment Analysis
12.4.1 Israel Micro Irrigation Market: By End Users, 2013-2017 (USD Million) 166
12.4.2 Israel Micro Irrigation Market: By End Users, 2013-2017 (USD Million) 166
Table of Content
11
S.No Particulars Page No.
13 Global Micro Irrigation Market Dynamics 170
13.1 Global Micro Irrigation Market Drivers 171
13.2 Global Micro Irrigation Market Challenges 177
13.3 Global Micro Irrigation Market Trends 180
14 Porter Five Analysis 183
15 SWOT Analysis 185
16 Supply Chain Analysis 187
17 Product Specifications 189
18 Company Profiling 192
18.1 Netafim 193
18.2 The Toro Company 195
18.3 Jains Irrigation Limited 197
18.4 RainBird Corporation 200
Table of Content
S.No Particulars Page No.
18.5 Valmont Industries 201
18.6 Lindsay Corporation 203
18.7 Rivulis Corporation 205
18.8 Nelson 206
18.9 T-L Irrigations 207
19. About Us 208
12
List of Figures
Figure No. Figure Title Page No.
Figure 1: Crops using Micro Irrigation 31
Figure 2: Global Micro Irrigation Market Size, By Value, 2013-2017 (USD Million) 34
Figure 3: Global Micro Irrigation Market Size, By Value, Forecast, 2018-2023 (USD Million) 35
Figure 4: Global Population, 2013-2016 (Billion) 36
Figure 5: Micro Irrigation Penetration Rate (%) 38
Figure 6: Advanced Irrigation Adoption, By Countries, (% out of irrigated Area) 40
Figure 7: Inefficient use of water 41
Figure 8: Leading countries of Agricultural Irrigated Land, By Countries (% of total irrigated land) 43
Figure 9: Total World Irrigated Area, 2016 44
Figure 10: Total Irrigated Area (%) 45
Figure 11: Total Micro Irrigation Area (%) 45
Figure 12: Global Micro Irrigation Market Size, By Segments, 2017 (%) 48
Figure 13: Global Micro Irrigation Market Size, By Segments, 2023 (%) 49
Figure 14: Total Irrigated Area, By micro and Sprinkler Irrigation 50
Figure 15: Global Drip Irrigation Market, By Value, 2013-2017 (USD Million) 51
Figure 16: Global Drip Irrigation Market, By Value, Forecast, 2018-2023 (USD Million) 51
Figure 17: Global Sprinkler Irrigation Market, By Value, 2013-2017 (USD Million) 53
Figure 18: Global Sprinkler Irrigation Market, By Value, Forecast, 2018-2023 (USD Million) 53
Figure 19: Total Sprinkler Irrigation Area (%) 54
Figure 20: Global Micro Irrigation Market Size, By Region, 2017 (%) 56
13
List of Figures
Figure No. Figure Title Page No.
Figure 21: Global Micro Irrigation Market Size, By Region, 2023 (%) 57
Figure 22: North America Micro Irrigation Market Size, By Value, 2013-2017 (USD Million ) 59
Figure 23: North America Micro Irrigation Market Size, By Value, Forecast, 2018-2023 (USD Million) 60
Figure 24: North America Population, 2013-2016 (Million) 61
Figure 25: North America GDP, 2013-2016 (USD Trillion) 61
Figure 26: North America Crop Production, By Countries 2017 ( Million metric Tonnes) 62
Figure 27: North America Micro Irrigation Market: By Segments, By Value, 2013-2017 (USD Million) 66
Figure 28: North America Micro Irrigation Market: By Segments, By Value, 2018-2023 (USD Million) 67
Figure 29: U.S. Micro Irrigation Market Size, By Value, 2013-2023 (USD Million) 70
Figure 30: U.S. Micro Irrigation Market: By Segments, By Value, 2013-2017 (USD Million) 71
Figure 31: U.S. Irrigation Market: By Segments, By Value, 2018-2023 (USD Million) 72
Figure 32: Population of United States, 2013-2018 (million) 73
Figure 33: United States Primary Sources of Irrigation. 74
Figure 34: Mexico Micro Irrigation Market Size, By Value, 2013-2023 (USD Million ) 79
Figure 35: Mexico Micro Irrigation Market: By Segments, By Value, 2013-2017 (USD Million) 80
Figure 36: Mexico Micro Irrigation Market: By Segments, By Value, 2018-2023 (USD Million) 81
Figure 37: Mexico, GDP per capita 2013-2017 (USD) 83
Figure 38: Mexico, By Population, 2013-2018 (% of total) 83
Figure 39: Mexico Average Precipitation, 2013-2017 (in %) 84
Figure 40: Major Players in Micro Irrigation Market in North America 85
14
List of Figures
Figure No. Figure Title Page No.
Figure 41: North America Micro Irrigation Market, Country Share, 2013-2017 (% of Total) 86
Figure 42: North America Micro Irrigation Market, Country Share, 2018-2023 (% of Total) 86
Figure 43: Europe Micro Irrigation Market Size, By Value, 2013-2017 (USD Million) 88
Figure 44: Europe Micro Irrigation Market Size, By Value, Forecast, 2018-2023 (USD Million) 89
Figure 45: European Union Population, 2013-2017 (Million) 91
Figure 46: European Union, GDP per capita, 2013-2017 (Trillion) 91
Figure 47: European Union, Types of Irrigation 94
Figure 48: European Union, Types of Irrigation 95
Figure 49: Europe Micro Irrigation Market: By Segments, By Value, 2013-2017 (USD Million) 97
Figure 50: Europe Micro Irrigation Market: By Segments, By Value, 2018-2023 (USD Million) 98
Figure 51: U.K. Micro Irrigation Market Size, By Value, 2013-2023 (USD Million) 101
Figure 52: U.K. Micro Irrigation Market: By Segments, By Value, 2013-2017 (USD Million) 102
Figure 53: U.K. Micro Irrigation Market: By Segments, By Value, 2018-2023 (USD Million) 103
Figure 54: Total Agricultural Area in United Kingdom, 2013-2016 (thousand hectares) 104
Figure 55: Growth in U.K Population, 2013-2017 (In millions) 105
Figure 56: Italy Micro Irrigation Market Size, By Value, 2013-2023 (USD Million) 107
Figure 57: Italy Micro Irrigation Market: By Segments, By Value, 2013-2017 (USD Million) 108
Figure 58: Italy Micro Irrigation Market: By Segments, By Value, 2018-2023 (USD Million) 109
Figure 59: Irrigation system used in Italy, 2014 112
Figure 60: Italy, Population Growth, 2013-2017 (USD) 113
15
List of Figures
Figure No. Figure Title Page No.
Figure 61: Italy, GDP per capita, 2013-2017 (USD) 113
Figure 62: Major Players in Micro Irrigation Market in Europe 114
Figure 63: Europe Micro Irrigation Market, Country Share, Historic, 2013-2017(% of Total) 115
Figure 64: Europe Micro Irrigation Market, Country Share, Forecast, 2018-2023 (% of Total) 115
Figure 65: APAC Micro Irrigation Market Size, By Value, 2013-2017 (USD Million) 117
Figure 66: APAC Micro Irrigation Market Size, By Value, Forecast, 2018-2023(USD Million) 118
Figure 67: APAC Micro Irrigation Market: By Segments, By Value, 2013-2017 (USD Million) 123
Figure 68: APAC Micro Irrigation Market: By Segments, By Value, 2018-2023 (USD Million) 124
Figure 69: India Micro Irrigation Market Size, By Value, 2013-2023 (USD Million) 127
Figure 70: India Micro Irrigation Market: By Segments, By Value, 2013-2017 (USD Million) 128
Figure 71: India Micro Irrigation Market: By Segments, By Value, 2018-2023 (USD Million) 129
Figure 72: State-wise Fund Allocation and Utilization 131
Figure 73: India -Top 10 states area covered under Micro Irrigation, 2015 (Million Hectares) 133
Figure 74: All India area covered under Micro Irrigation, By Segments, 2015 (Million Hectare) 133
Figure 75: India - Major States area covered under Drip Irrigation, By States, 2016 (%) 134
Figure 76: India - Major States area covered under Micro Irrigation, By States, 2016 (%) 135
Figure 77: India - Major States Micro Irrigation Penetration rate, 2015 (%) 136
Figure 78: India - Energy Consumption Savings, By State, 2015 138
Figure 79: India - Fertilizer Consumption Savings, By state, 2015 138
Figure 80: India- Fruits Crop Productivity, By state, 2015 139
16
List of Figures
Figure No. Figure Title Page No.
Figure 81: India - Vegetable Crop Productivity, By state, 2015 139
Figure 82: India - Increase in Farmer’s Income, By state, 2015 (%) 140
Figure 83: India - Introduction of new crop, By state, 2015 140
Figure 84: India - Irrigation Cost Savings, By States, 2015 (%) 141
Figure 85: State-wise Potential for Micro Irrigation in India 142
Figure 86: China Micro Irrigation Market Size, By Value, 2013-2023 (USD Million) 144
Figure 87: China Micro Irrigation Market: By Segments, By Value, 2013-2017 (USD Million) 145
Figure 88: China Micro Irrigation Market: By Segments, By Value, 2018-2023 (USD Million) 146
Figure 89: China, By Population Growth, 2013-2016 (In trillion) 148
Figure 90: China Size of irrigated areas, 2016 (million hectares) 149
Figure 91: China’s GDP (Current USD), 2013-2016 (Trillion) 150
Figure 92: Australia Micro Irrigation Market Size, By Value, 2013-2023 (USD Million) 152
Figure 93: Australia Micro Irrigation Market: By Segments, By Value, 2013-2017 (USD Million) 153
Figure 94: Australia Micro Irrigation Market: By Segments, By Value, 2018-2023 (USD Million) 154
Figure 95: Irrigation Methods in Australia 157
Figure 96: Australia Population, 2013-2017 (Millions) 158
Figure 97: Australia GDP Growth Rate, 2013-2017 (In %) 158
Figure 98: APAC Micro Irrigation Market, Country Share, 2013-2017 (% of Total) 159
Figure 99: APAC Micro Irrigation Market, Country Share, 2018-2023 (% of Total) 159
Figure 100: ROW Micro Irrigation Market Size, By Value, 2013-2023 (USD Million) 161
17
List of Figures
Figure No. Figure Title Page No.
Figure 101: Israel Micro Irrigation Market Size, By Value, 2013-2023 (USD Million) 164
Figure 102: Israel Micro Irrigation Market: By Segments, By Value, 2013-2017 (USD Million) 165
Figure 103: Israel Micro Irrigation Market: By Segments, By Value, 2018-2023 (USD Million) 166
Figure 104: Water Consumption in Israel 168
Figure 105: Israel - Water Consumption for Agriculture 169
Figure 106: Water Usage, Worldwide (%) 175
Figure 107: Water Usage, By Developed Countries (%) 175
Figure 108: Water Usage, By Developing and Poor countries, (%) 175
Figure 109: Netafim, Net Sales, by segments, 2016 (%) 194
Figure 110: Netafim, Net Sales, By Geographical Region, 2017 (%) 194
Figure 111: The Toro company, Net Revenue, 2013-2017,(USD billion) 196
Figure 112: The Toro Company, Net Sales, by segments, 2017 (%) 196
Figure 113: The Toro Company, Net Sales, By Geographical Region, 2017 (%) 196
Figure 114: Jains Irrigation Company, Net Sales, 2013-2017 (USD Million) 198
Figure 115: Jains Irrigation Net Sales, By Business Segment, 2017 (%) 198
Figure 116: Jains Irrigation Net Sales, By Geographical Region, 2017 (%) 198
Figure 117: High Tech Agricultural Input Products, By Revenues, 2013-2017 ( in million) 199
Figure 118: Valmont Industries, Net Sales, 2013-2017 (USD Thousands) 202
Figure 119: Valmont Industries, Net Sales, By Business Segment, 2017 (%) 202
Figure 120: Valmont Industries, Sales, By Geographical Region, 2017 (%) 202
18
List of Figures
Figure No. Figure Title Page No.
Figure 121: Lindsay Corporation, Net Revenues, 2013-2017 (USD Million) 204
Figure 122: Lindsay Corporation, Net Sales, By Business Segment, 2017 (%) 204
Figure 123: Lindsay Corporation, Net Sales, By Geographical Region, 2017 (%) 204
19
List of Figures
Figure No. Figure Title Page No.
Table 1: Comparison between drip and sprinkler irrigation 30
Table 2: Common Micro Irrigation Technologies in United States 76
Table 3: Technological Improvements in Micro irrigation 92
Table 4: Crop-wise Potential for micro irrigation in India 137
Table 5: Application Methods of Irrigation 156
Table 6: New Irrigation Technologies, By Select Company 190
20
Research Methodology
For our study on Global Micro-Irrigation Market, we have conducted comprehensive secondary
research followed by an extensive primary research. In the process of secondary research, we have
scrutinized industry documents, accessed from open sources, premium paid databases (Bloomberg,
Thomson Reuters, Factiva) and our internal knowledge base. In the process of primary research, we
have interviewed various industry experts across the value chain of the Micro-Irrigations.
Market size of the actual period (2013-2017) has been evaluated on the basis of growth trends of
the industry in the last five years, and confirming the findings through primary research. Annual
reports of the companies were scanned to further validate the market size and to estimate the size
of various other end-user sectors. Market sizing and growth in the forecast period (2018-2023) is
estimated through product mapping, application in end-user industries, growth of allied sectors and
historical growth pattern of the industry. All the relevant data points/ statistics in the forecast
period are validated through relevant and reliable primary sources.
Report Focus: Global Micro-Irrigation Market
- By Product Type- (Drip Irrigation, Sprinkler Irrigation)
- By Region (North America, Europe, Asia Pacific, Rest of World)
- By Country (US,Mexico, UK, Italy, China, India, Israel, Australia)
- By Company (Netafim Ltd, The Toro Company, Jain Irrigations, T-L Irrigations, Valmont Industries,
Lindsay Corporation, Nelson , Rivulis Corporation , Rainbird Corporation).
21
22
Micro Irrigation Market : Product Outlook
Drip Irrigation Sprinkler Irrigation
Water Saving xx xx
Irrigation Efficiency xx xx
Weed Problem xx xx
Suitable water xx xx
Diseases and Pests xx xx
Efficiency of fertilizer use xx xx
Table 1: Comparison between drip and sprinkler irrigation
Global Micro Irrigation Market Overview
Source: Azoth Analytics Estimates
Xx
Xx
Xx
Xx
Xx
Global Micro Irrigation market has been boosted by proliferating demand of food and agricultural products
leading to the rising demand.
2013 2014 2015 2016 2017
Figure 2: Global Micro Irrigation Market Size, By Value, 2013-2017 (USD Million)
CAGR 2013-2017
xx%
23
Global Micro Irrigation Market Overview
Surging investment in the development of affordable and innovative Micro Irrigations is likely to drive
the demand growth in forecast period.
Xx
Xx
Xx
Xx
Xx
2018 2019 2020 2021 2022 2023
Source: Azoth Analytics Estimates
CAGR 2018-2023
xx%
Figure 3: Global Micro Irrigation Market Size, By Value, Forecast, 2018-2023 (USD Million)
24
Global Micro Irrigation Market- By Segment
Figure 13: Global Micro Irrigation Market Size, By Segments, 2023 (%)
In the forecast period, drip irrigation segment is likely to dominate the overall market. However, it
is the fastest growing segment in the market
Drip Irrigation
Sprinkler Irrigation
Others
Source: Azoth Analytics Estimates
Key Drivers
25
xx
xx
xx
North America Micro Irrigation Market Overview
Source: Azoth Analytics Estimates
Xx
Xx
Xx
Xx
Xx
Micro Irrigation market in North America has seen huge growth due to increasing population
coupled with decreasing water shortage.
2013 2014 2015 2016 2017
Figure 22: North America Micro Irrigation Market Size, By Value, 2013-2017 (USD Million )
CAGR 2013-2017
xx%
26
North America Micro Irrigation Market Overview
Noteworthy growth in the regional market is attributed to high focus on international sales, mergers and
acquisitions.
Xx
Xx
Xx
Xx
Xx
1675.77
2069.36
2477.33
2890.45
3328.41
3794.71
2018 2019 2020 2021 2022 2023
Source: Azoth Analytics Estimates
CAGR 2018-2023
xx%
Figure 23: North America Micro Irrigation Market Size, By Value, Forecast, 2018-2023 (USD Million)
27
Source: Azoth Analytics Estimates
Figure 27: North America Micro Irrigation Market: By Segments, By Value, 2013-2017 (USD Million)
CAGR 2013-2017
Drip Irrigation – x%
Sprinkler Irrigation – x%
Others - x%
North America Micro Irrigation Market, By Segment
28
2013 2014 2015 2016 2017
Drip Irrigation
Sprinkler Irrigation
Others
2013 2014 2015 2016 2017
Drip Irrigation Sprinkler Irrigation Others
Source: Azoth Analytics Estimates
Figure 28: North America Micro Irrigation Market: By Segments, By Value, 2018-2023 (USD Million)
CAGR 2018-2023
Drip Irrigation – x%
Sprinkler Irrigation – x%
Others – x%
North America Micro Irrigation Market, By Segment
29
2018 2019 2020 2021 2022 2023
Drip Irrigation Sprinkler Irrigation Others
2018 2019 2020 2021 2022 2023
Drip Irrigation
Sprinkler Irrigation
Others
Source: Azoth Analytics Estimates
Figure 30: U.S. Micro Irrigation Market: By Segments, By Value, 2013-2017 (USD Million)
CAGR 2013-2017
Drip Irrigation – x%
Sprinkler Irrigation – x%
Others – x%
U.S. Micro Irrigation Market, By Segment
30
2013 2014 2015 2016 2017
Drip Irrigation
Sprinkler Irrigation
Others
2013 2014 2015 2016 2017
Drip Irrigation Sprinkler Irrigation Others
Source: Azoth Analytics Estimates
Figure 31: U.S. Micro Irrigation Market: By Segments, By Value, 2018-2023 (USD Million)
CAGR 2018-2023
Drip Irrigation – x%
Sprinkler Irrigation – x%
Others – x%
U.S. Micro Irrigation Market, By Segment
31
2018 2019 2020 2021 2022 2023
Drip Irrigation
Sprinkler Irrigation
Others
2018 2019 2020 2021 2022 2023
Drip Irrigation Sprinkler Irrigation Others
BARRIERS TO ENTRY – MODERATE TO HIGH
1. Xx
2. xx
3. Xx
BUYER’S POWER – MODERATE
1. Xx
2. Xx
3. Xx
SUPPLIER POWER – MODERATE
1. Xx
2. Xx
3. Xx
THREATS OF SUBSTITUTES – LOW
1. Xx
2. Xx
3. Xx
INDUSTRY COMPETITION- HIGH
1. Xx
2. Xx
3. Xx
32
Porter Five Forces Model - Micro Irrigation Market
SWOT
Threats
 Xx
 Xx
 Xx
 Xx
 Xx
 Xx
Weakness
 Xx
 Xx
 Xx
 Xx
 Xx
 Xx
OpportunityStrengths
 xx
 Xx
 Xx
 Xx
 Xx
 Xx
 Xx
 Xx
 Xx
 Xx
 Xx
33
SWOT Analysis - Micro Irrigation Market
About Azoth Analytics Pvt Ltd.
Azoth Analytics is a business research and analytics firm that creates in-depth research reports and provides customized research solutions and consultancy
Application. Verticals in which Azoth Analytics specializes include healthcare and pharmaceutical, oil and gas, retail, chemicals, automotive, FMCG, food &
beverages and technology. Azoth creates comprehensive and in-depth research reports by recording, interpreting and analyzing information. Strategic
market sizing and data dredging techniques include secondary research, and primary research (interviews with management personnel and industry experts).
Disclaimer: Azoth Analytics report information is based mainly on interviews and therefore, is subject to fluctuation. Azoth Analytics therefore, takes no responsibility for
any incorrect information supplied to us by industry experts, manufacturers or users. Azoth does not warranty the completeness of the information and data. Also, analysis
provided in the report are meant for customers’ internal use only and not for general publication or disclosure to third parties.
34

More Related Content

Similar to Sample global micro-irrigation market report

Solar Microinverter Market Size, Share & Forecast | TechSci Research
Solar Microinverter Market Size, Share & Forecast | TechSci Research Solar Microinverter Market Size, Share & Forecast | TechSci Research
Solar Microinverter Market Size, Share & Forecast | TechSci Research TechSci Research
 
Global two stage-crushers_markets-futuristic_reports
Global two stage-crushers_markets-futuristic_reportsGlobal two stage-crushers_markets-futuristic_reports
Global two stage-crushers_markets-futuristic_reportsjerrythomas78
 
Global Diesel Genset Market Forecast and Opportunities, 2019
Global Diesel Genset Market Forecast and Opportunities, 2019Global Diesel Genset Market Forecast and Opportunities, 2019
Global Diesel Genset Market Forecast and Opportunities, 2019TechSci Research
 
Global Sewage Treatment Plant Market: Trends, Opportunities and Forecasts (20...
Global Sewage Treatment Plant Market: Trends, Opportunities and Forecasts (20...Global Sewage Treatment Plant Market: Trends, Opportunities and Forecasts (20...
Global Sewage Treatment Plant Market: Trends, Opportunities and Forecasts (20...Azoth Analytics
 
Sample 2018 2023 global top countries mobile water treatment market report
Sample 2018 2023 global top countries mobile water treatment market reportSample 2018 2023 global top countries mobile water treatment market report
Sample 2018 2023 global top countries mobile water treatment market reportMarco Murphy
 
GLOBAL MALE INFERTILITY MARKET.docx
GLOBAL MALE INFERTILITY MARKET.docxGLOBAL MALE INFERTILITY MARKET.docx
GLOBAL MALE INFERTILITY MARKET.docxChiragKadam14
 
Global Contract Catering Market: 2018 World Market Review and Forecast to 2022
Global Contract Catering Market: 2018 World Market Review and Forecast to 2022Global Contract Catering Market: 2018 World Market Review and Forecast to 2022
Global Contract Catering Market: 2018 World Market Review and Forecast to 2022Matloob Hasan
 
Global Contract Catering Market: 2018 World Market Review and Forecast to 2022
Global Contract Catering Market: 2018 World Market Review and Forecast to 2022Global Contract Catering Market: 2018 World Market Review and Forecast to 2022
Global Contract Catering Market: 2018 World Market Review and Forecast to 2022Azoth Analytics
 
Sample global agriculture stall mats market report 2021
Sample global agriculture stall mats market report 2021   Sample global agriculture stall mats market report 2021
Sample global agriculture stall mats market report 2021 Cognitive Market Research
 
Sample global agriculture stall mats market report 2021
Sample global agriculture stall mats market report 2021   Sample global agriculture stall mats market report 2021
Sample global agriculture stall mats market report 2021 Cognitive Market Research
 
Hand Sanitizing Station Market 2025
Hand Sanitizing Station Market 2025Hand Sanitizing Station Market 2025
Hand Sanitizing Station Market 2025TechSci Research
 
Global inverters markets-futuristic_reports
Global inverters markets-futuristic_reportsGlobal inverters markets-futuristic_reports
Global inverters markets-futuristic_reportsjerrythomas78
 
Global biomaterials market size, share & market forecast 2025
Global biomaterials market size, share & market forecast 2025Global biomaterials market size, share & market forecast 2025
Global biomaterials market size, share & market forecast 2025TechSci Research
 
Global lower extremities_markets-futuristic_reports
Global lower extremities_markets-futuristic_reportsGlobal lower extremities_markets-futuristic_reports
Global lower extremities_markets-futuristic_reportsroselynhenson5
 
Sample fullerene market
Sample fullerene marketSample fullerene market
Sample fullerene marketMatloob Hasan
 

Similar to Sample global micro-irrigation market report (16)

Solar Microinverter Market Size, Share & Forecast | TechSci Research
Solar Microinverter Market Size, Share & Forecast | TechSci Research Solar Microinverter Market Size, Share & Forecast | TechSci Research
Solar Microinverter Market Size, Share & Forecast | TechSci Research
 
Global two stage-crushers_markets-futuristic_reports
Global two stage-crushers_markets-futuristic_reportsGlobal two stage-crushers_markets-futuristic_reports
Global two stage-crushers_markets-futuristic_reports
 
Global Forklift Truck Market Outlook 2024
Global Forklift Truck Market Outlook 2024Global Forklift Truck Market Outlook 2024
Global Forklift Truck Market Outlook 2024
 
Global Diesel Genset Market Forecast and Opportunities, 2019
Global Diesel Genset Market Forecast and Opportunities, 2019Global Diesel Genset Market Forecast and Opportunities, 2019
Global Diesel Genset Market Forecast and Opportunities, 2019
 
Global Sewage Treatment Plant Market: Trends, Opportunities and Forecasts (20...
Global Sewage Treatment Plant Market: Trends, Opportunities and Forecasts (20...Global Sewage Treatment Plant Market: Trends, Opportunities and Forecasts (20...
Global Sewage Treatment Plant Market: Trends, Opportunities and Forecasts (20...
 
Sample 2018 2023 global top countries mobile water treatment market report
Sample 2018 2023 global top countries mobile water treatment market reportSample 2018 2023 global top countries mobile water treatment market report
Sample 2018 2023 global top countries mobile water treatment market report
 
GLOBAL MALE INFERTILITY MARKET.docx
GLOBAL MALE INFERTILITY MARKET.docxGLOBAL MALE INFERTILITY MARKET.docx
GLOBAL MALE INFERTILITY MARKET.docx
 
Global Contract Catering Market: 2018 World Market Review and Forecast to 2022
Global Contract Catering Market: 2018 World Market Review and Forecast to 2022Global Contract Catering Market: 2018 World Market Review and Forecast to 2022
Global Contract Catering Market: 2018 World Market Review and Forecast to 2022
 
Global Contract Catering Market: 2018 World Market Review and Forecast to 2022
Global Contract Catering Market: 2018 World Market Review and Forecast to 2022Global Contract Catering Market: 2018 World Market Review and Forecast to 2022
Global Contract Catering Market: 2018 World Market Review and Forecast to 2022
 
Sample global agriculture stall mats market report 2021
Sample global agriculture stall mats market report 2021   Sample global agriculture stall mats market report 2021
Sample global agriculture stall mats market report 2021
 
Sample global agriculture stall mats market report 2021
Sample global agriculture stall mats market report 2021   Sample global agriculture stall mats market report 2021
Sample global agriculture stall mats market report 2021
 
Hand Sanitizing Station Market 2025
Hand Sanitizing Station Market 2025Hand Sanitizing Station Market 2025
Hand Sanitizing Station Market 2025
 
Global inverters markets-futuristic_reports
Global inverters markets-futuristic_reportsGlobal inverters markets-futuristic_reports
Global inverters markets-futuristic_reports
 
Global biomaterials market size, share & market forecast 2025
Global biomaterials market size, share & market forecast 2025Global biomaterials market size, share & market forecast 2025
Global biomaterials market size, share & market forecast 2025
 
Global lower extremities_markets-futuristic_reports
Global lower extremities_markets-futuristic_reportsGlobal lower extremities_markets-futuristic_reports
Global lower extremities_markets-futuristic_reports
 
Sample fullerene market
Sample fullerene marketSample fullerene market
Sample fullerene market
 

More from Matloob Hasan

Sample global breakfast cereals market report
Sample global breakfast cereals market reportSample global breakfast cereals market report
Sample global breakfast cereals market reportMatloob Hasan
 
Sample global breakfast cereals market report
Sample global breakfast cereals market reportSample global breakfast cereals market report
Sample global breakfast cereals market reportMatloob Hasan
 
Sample global sterile injectables market report
Sample global sterile injectables market reportSample global sterile injectables market report
Sample global sterile injectables market reportMatloob Hasan
 
Global Hepatitis B Virus [HBV] Treatment Market: Opportunities and Forecast (...
Global Hepatitis B Virus [HBV] Treatment Market: Opportunities and Forecast (...Global Hepatitis B Virus [HBV] Treatment Market: Opportunities and Forecast (...
Global Hepatitis B Virus [HBV] Treatment Market: Opportunities and Forecast (...Matloob Hasan
 
Global Well Head Equipment Market: Opportunities and Forecast (2018-2023)
Global Well Head Equipment Market: Opportunities and Forecast (2018-2023) Global Well Head Equipment Market: Opportunities and Forecast (2018-2023)
Global Well Head Equipment Market: Opportunities and Forecast (2018-2023) Matloob Hasan
 
Global Antidepressant Drugs Market: Opportunities and Forecasts (2018-2023)
Global Antidepressant Drugs Market: Opportunities and Forecasts (2018-2023) Global Antidepressant Drugs Market: Opportunities and Forecasts (2018-2023)
Global Antidepressant Drugs Market: Opportunities and Forecasts (2018-2023) Matloob Hasan
 

More from Matloob Hasan (6)

Sample global breakfast cereals market report
Sample global breakfast cereals market reportSample global breakfast cereals market report
Sample global breakfast cereals market report
 
Sample global breakfast cereals market report
Sample global breakfast cereals market reportSample global breakfast cereals market report
Sample global breakfast cereals market report
 
Sample global sterile injectables market report
Sample global sterile injectables market reportSample global sterile injectables market report
Sample global sterile injectables market report
 
Global Hepatitis B Virus [HBV] Treatment Market: Opportunities and Forecast (...
Global Hepatitis B Virus [HBV] Treatment Market: Opportunities and Forecast (...Global Hepatitis B Virus [HBV] Treatment Market: Opportunities and Forecast (...
Global Hepatitis B Virus [HBV] Treatment Market: Opportunities and Forecast (...
 
Global Well Head Equipment Market: Opportunities and Forecast (2018-2023)
Global Well Head Equipment Market: Opportunities and Forecast (2018-2023) Global Well Head Equipment Market: Opportunities and Forecast (2018-2023)
Global Well Head Equipment Market: Opportunities and Forecast (2018-2023)
 
Global Antidepressant Drugs Market: Opportunities and Forecasts (2018-2023)
Global Antidepressant Drugs Market: Opportunities and Forecasts (2018-2023) Global Antidepressant Drugs Market: Opportunities and Forecasts (2018-2023)
Global Antidepressant Drugs Market: Opportunities and Forecasts (2018-2023)
 

Recently uploaded

VIRUSES structure and classification ppt by Dr.Prince C P
VIRUSES structure and classification ppt by Dr.Prince C PVIRUSES structure and classification ppt by Dr.Prince C P
VIRUSES structure and classification ppt by Dr.Prince C PPRINCE C P
 
Disentangling the origin of chemical differences using GHOST
Disentangling the origin of chemical differences using GHOSTDisentangling the origin of chemical differences using GHOST
Disentangling the origin of chemical differences using GHOSTSérgio Sacani
 
STERILITY TESTING OF PHARMACEUTICALS ppt by DR.C.P.PRINCE
STERILITY TESTING OF PHARMACEUTICALS ppt by DR.C.P.PRINCESTERILITY TESTING OF PHARMACEUTICALS ppt by DR.C.P.PRINCE
STERILITY TESTING OF PHARMACEUTICALS ppt by DR.C.P.PRINCEPRINCE C P
 
Hubble Asteroid Hunter III. Physical properties of newly found asteroids
Hubble Asteroid Hunter III. Physical properties of newly found asteroidsHubble Asteroid Hunter III. Physical properties of newly found asteroids
Hubble Asteroid Hunter III. Physical properties of newly found asteroidsSérgio Sacani
 
Natural Polymer Based Nanomaterials
Natural Polymer Based NanomaterialsNatural Polymer Based Nanomaterials
Natural Polymer Based NanomaterialsAArockiyaNisha
 
Isotopic evidence of long-lived volcanism on Io
Isotopic evidence of long-lived volcanism on IoIsotopic evidence of long-lived volcanism on Io
Isotopic evidence of long-lived volcanism on IoSérgio Sacani
 
TEST BANK For Radiologic Science for Technologists, 12th Edition by Stewart C...
TEST BANK For Radiologic Science for Technologists, 12th Edition by Stewart C...TEST BANK For Radiologic Science for Technologists, 12th Edition by Stewart C...
TEST BANK For Radiologic Science for Technologists, 12th Edition by Stewart C...ssifa0344
 
Hire 💕 9907093804 Hooghly Call Girls Service Call Girls Agency
Hire 💕 9907093804 Hooghly Call Girls Service Call Girls AgencyHire 💕 9907093804 Hooghly Call Girls Service Call Girls Agency
Hire 💕 9907093804 Hooghly Call Girls Service Call Girls AgencySheetal Arora
 
Presentation Vikram Lander by Vedansh Gupta.pptx
Presentation Vikram Lander by Vedansh Gupta.pptxPresentation Vikram Lander by Vedansh Gupta.pptx
Presentation Vikram Lander by Vedansh Gupta.pptxgindu3009
 
GFP in rDNA Technology (Biotechnology).pptx
GFP in rDNA Technology (Biotechnology).pptxGFP in rDNA Technology (Biotechnology).pptx
GFP in rDNA Technology (Biotechnology).pptxAleenaTreesaSaji
 
Recombination DNA Technology (Nucleic Acid Hybridization )
Recombination DNA Technology (Nucleic Acid Hybridization )Recombination DNA Technology (Nucleic Acid Hybridization )
Recombination DNA Technology (Nucleic Acid Hybridization )aarthirajkumar25
 
All-domain Anomaly Resolution Office U.S. Department of Defense (U) Case: “Eg...
All-domain Anomaly Resolution Office U.S. Department of Defense (U) Case: “Eg...All-domain Anomaly Resolution Office U.S. Department of Defense (U) Case: “Eg...
All-domain Anomaly Resolution Office U.S. Department of Defense (U) Case: “Eg...Sérgio Sacani
 
Nightside clouds and disequilibrium chemistry on the hot Jupiter WASP-43b
Nightside clouds and disequilibrium chemistry on the hot Jupiter WASP-43bNightside clouds and disequilibrium chemistry on the hot Jupiter WASP-43b
Nightside clouds and disequilibrium chemistry on the hot Jupiter WASP-43bSérgio Sacani
 
Orientation, design and principles of polyhouse
Orientation, design and principles of polyhouseOrientation, design and principles of polyhouse
Orientation, design and principles of polyhousejana861314
 
Pests of cotton_Borer_Pests_Binomics_Dr.UPR.pdf
Pests of cotton_Borer_Pests_Binomics_Dr.UPR.pdfPests of cotton_Borer_Pests_Binomics_Dr.UPR.pdf
Pests of cotton_Borer_Pests_Binomics_Dr.UPR.pdfPirithiRaju
 
Stunning ➥8448380779▻ Call Girls In Panchshil Enclave Delhi NCR
Stunning ➥8448380779▻ Call Girls In Panchshil Enclave Delhi NCRStunning ➥8448380779▻ Call Girls In Panchshil Enclave Delhi NCR
Stunning ➥8448380779▻ Call Girls In Panchshil Enclave Delhi NCRDelhi Call girls
 

Recently uploaded (20)

VIRUSES structure and classification ppt by Dr.Prince C P
VIRUSES structure and classification ppt by Dr.Prince C PVIRUSES structure and classification ppt by Dr.Prince C P
VIRUSES structure and classification ppt by Dr.Prince C P
 
9953056974 Young Call Girls In Mahavir enclave Indian Quality Escort service
9953056974 Young Call Girls In Mahavir enclave Indian Quality Escort service9953056974 Young Call Girls In Mahavir enclave Indian Quality Escort service
9953056974 Young Call Girls In Mahavir enclave Indian Quality Escort service
 
CELL -Structural and Functional unit of life.pdf
CELL -Structural and Functional unit of life.pdfCELL -Structural and Functional unit of life.pdf
CELL -Structural and Functional unit of life.pdf
 
Disentangling the origin of chemical differences using GHOST
Disentangling the origin of chemical differences using GHOSTDisentangling the origin of chemical differences using GHOST
Disentangling the origin of chemical differences using GHOST
 
STERILITY TESTING OF PHARMACEUTICALS ppt by DR.C.P.PRINCE
STERILITY TESTING OF PHARMACEUTICALS ppt by DR.C.P.PRINCESTERILITY TESTING OF PHARMACEUTICALS ppt by DR.C.P.PRINCE
STERILITY TESTING OF PHARMACEUTICALS ppt by DR.C.P.PRINCE
 
Hubble Asteroid Hunter III. Physical properties of newly found asteroids
Hubble Asteroid Hunter III. Physical properties of newly found asteroidsHubble Asteroid Hunter III. Physical properties of newly found asteroids
Hubble Asteroid Hunter III. Physical properties of newly found asteroids
 
Natural Polymer Based Nanomaterials
Natural Polymer Based NanomaterialsNatural Polymer Based Nanomaterials
Natural Polymer Based Nanomaterials
 
The Philosophy of Science
The Philosophy of ScienceThe Philosophy of Science
The Philosophy of Science
 
Isotopic evidence of long-lived volcanism on Io
Isotopic evidence of long-lived volcanism on IoIsotopic evidence of long-lived volcanism on Io
Isotopic evidence of long-lived volcanism on Io
 
TEST BANK For Radiologic Science for Technologists, 12th Edition by Stewart C...
TEST BANK For Radiologic Science for Technologists, 12th Edition by Stewart C...TEST BANK For Radiologic Science for Technologists, 12th Edition by Stewart C...
TEST BANK For Radiologic Science for Technologists, 12th Edition by Stewart C...
 
Hire 💕 9907093804 Hooghly Call Girls Service Call Girls Agency
Hire 💕 9907093804 Hooghly Call Girls Service Call Girls AgencyHire 💕 9907093804 Hooghly Call Girls Service Call Girls Agency
Hire 💕 9907093804 Hooghly Call Girls Service Call Girls Agency
 
Presentation Vikram Lander by Vedansh Gupta.pptx
Presentation Vikram Lander by Vedansh Gupta.pptxPresentation Vikram Lander by Vedansh Gupta.pptx
Presentation Vikram Lander by Vedansh Gupta.pptx
 
GFP in rDNA Technology (Biotechnology).pptx
GFP in rDNA Technology (Biotechnology).pptxGFP in rDNA Technology (Biotechnology).pptx
GFP in rDNA Technology (Biotechnology).pptx
 
Recombination DNA Technology (Nucleic Acid Hybridization )
Recombination DNA Technology (Nucleic Acid Hybridization )Recombination DNA Technology (Nucleic Acid Hybridization )
Recombination DNA Technology (Nucleic Acid Hybridization )
 
All-domain Anomaly Resolution Office U.S. Department of Defense (U) Case: “Eg...
All-domain Anomaly Resolution Office U.S. Department of Defense (U) Case: “Eg...All-domain Anomaly Resolution Office U.S. Department of Defense (U) Case: “Eg...
All-domain Anomaly Resolution Office U.S. Department of Defense (U) Case: “Eg...
 
Nightside clouds and disequilibrium chemistry on the hot Jupiter WASP-43b
Nightside clouds and disequilibrium chemistry on the hot Jupiter WASP-43bNightside clouds and disequilibrium chemistry on the hot Jupiter WASP-43b
Nightside clouds and disequilibrium chemistry on the hot Jupiter WASP-43b
 
Orientation, design and principles of polyhouse
Orientation, design and principles of polyhouseOrientation, design and principles of polyhouse
Orientation, design and principles of polyhouse
 
Pests of cotton_Borer_Pests_Binomics_Dr.UPR.pdf
Pests of cotton_Borer_Pests_Binomics_Dr.UPR.pdfPests of cotton_Borer_Pests_Binomics_Dr.UPR.pdf
Pests of cotton_Borer_Pests_Binomics_Dr.UPR.pdf
 
Stunning ➥8448380779▻ Call Girls In Panchshil Enclave Delhi NCR
Stunning ➥8448380779▻ Call Girls In Panchshil Enclave Delhi NCRStunning ➥8448380779▻ Call Girls In Panchshil Enclave Delhi NCR
Stunning ➥8448380779▻ Call Girls In Panchshil Enclave Delhi NCR
 
Engler and Prantl system of classification in plant taxonomy
Engler and Prantl system of classification in plant taxonomyEngler and Prantl system of classification in plant taxonomy
Engler and Prantl system of classification in plant taxonomy
 

Sample global micro-irrigation market report

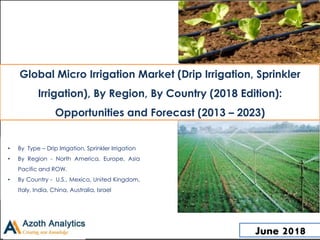
  • 1. Global Micro Irrigation Market (Drip Irrigation, Sprinkler Irrigation), By Region, By Country (2018 Edition): Opportunities and Forecast (2013 – 2023) • By Type – Drip Irrigation, Sprinkler Irrigation • By Region - North America, Europe, Asia Pacific and ROW. • By Country - U.S., Mexico, United Kingdom, Italy, India, China, Australia, Israel June 2018
  • 2. Scope of the Report – Global Micro-Irrigation Market 2 2013 2014 2015 2016 2017 2018 2019 2020 2021 2022 2023 Global Market (By Value) By Product Type, By Value Drip Irrigation Sprinkler Irrigation Regional Market (By Value) By Product Type ,By Value Drip Irrigation Sprinkler Irrigation Country Market (By Value) By Product Type, By Value Drip Irrigation Sprinkler Irrigation Company Analysis Netafim Ltd, The Toro Company, Jain Irrigations, T-L Irrigations, Valmont Industries, Lindsay Corporation, Nelson , Rivulis Corporation etc. Regional Analysis North America, Europe, APAC, ROW Country Analysis U.S., Mexico, United Kingdom, Italy, India, China, Australia, Israel Historical Forecast
  • 3. Table of Content 3 S.No Particulars Page No. 1. Research Methodology 21 2. Executive Summary 22 4. Micro Irrigation Outlook 23 5. Global Micro Irrigation Market: Growth and Forecast 34 5.1 By Value (2013-2017) 34 5.2 By Value (2018-2023) 35 6 Global Micro Irrigation Market Size, By Segment : Breakdown (%) 46 6.1 Global Micro Irrigation Market Size, By Segment, 2017 (%) 48 6.2 Global Micro Irrigation Market Size, By Segment, 2023 (%) 49
  • 4. Table of Content 4 S.No Particulars Page No. 7 Global Micro Irrigation Market – Segment Analysis 7.1 Drip Irrigation, By Value (2013-2023) 51 7.2 Sprinkler Irrigation Market, By Value (2013-2023) 51 8 Global Micro Irrigation Market, By Regional Analysis : Breakdown (%) 55 8.1 Global Micro Irrigation Market Size, By Region, 2017 (%) 56 8.2 Global Micro Irrigation Market Size, By Region, 2023 (%) 57 9 Global Micro Irrigation Market Size: Regional Analysis 9.1 North America Micro Irrigation Market: Growth and Forecast 58
  • 5. Table of Content 5 S.No Particulars Page No. 9.1.1 By Value (2013-2017) 59 9.1.2 By Value (2018-2023) 60 9.2 North America Micro Irrigation Market Size: Segment Analysis 65 9.2.1 North America Micro Irrigation Market Size, By Segment (2013-2017) 66 9.2.2 North America Micro Irrigation Market Size, By Segment (2018-2023) 67 9.3 United States Micro Irrigation Market 69 9.3.1 United Kingdom Micro Irrigation Market Size, 2013-2023 (USD Million) 70 9.4 United States Micro Irrigation Market Size: Segmental Analysis 9.4.1 United States Micro Irrigation Market, By Segment 2013-2017 (USD Million) 71 9.4.2 United States Micro Irrigation Market, By Segment 2018-2023 (USD Million) 72 9.5 Mexico Micro Irrigation Market 79 9.5.1 Mexico Micro Irrigation Market Size, 2013-2023 (USD Million) 79
  • 6. Table of Content 6 S.No Particulars Page No. 9.6 Mexico Micro Irrigation Market Size: Segment Analysis 9.6.2 Mexico Micro Irrigation Market: By Segment, 2013-2017 (USD Million) 80 9.6.3 Mexico Micro Irrigation Market : By Segment, 2018-2023 (USD Million) 81 10. Europe Micro Irrigation Market 10.1 Europe Micro Irrigation Market: Growth and Forecast 87 10.1.1 By Value (2013-2017) 88 10.1.2 By Value (2018-2023) 89 10.2 Europe Micro Irrigation Market Size: Segment Analysis 96 10.2.1 Europe Micro Irrigation Market Size, By Segment (2013-2017) 97 10.2.2 Europe Micro Irrigation Market Size, By Segment (2018-2023) 98
  • 7. Table of Content 7 S.No Particulars Page No. 10.3 United Kingdom Micro Irrigation Market 100 10.3.1 United Kingdom Micro Irrigation Market Size, 2013-2023 (USD Million) 101 10.4 United Kingdom Micro Irrigation Market : Segmental Analysis 10.4.1 United Kingdom Micro Irrigation Market: By End Users, 2013-2017 (USD Million) 102 10.4.2 United Kingdom Micro Irrigation Market : By End Users, 2018-2023 (USD Million) 102 10.5 Italy Micro Irrigation Market 106 10.5.1 Italy Micro Irrigation Market Size, 2013-2023 (USD Million) 107 10.6 Italy Micro Irrigation Market : Segment Analysis 10.6.1 Italy Micro Irrigation Market: By End Users, 2013-2017 (USD Million) 108 10.6.2 Italy Micro Irrigation Market : By End Users, 2018-2023 (USD Million) 109
  • 8. Table of Content 8 S.No Particulars Page No. 11 APAC Micro Irrigation Market 116 11.1 APAC Micro Irrigation Market: Growth and Forecast 11.1.1 By Value (2013-2017) 117 11.1.2 By Value (2018-2023) 118 11.2 APAC Micro Irrigation Market Size: Segment Analysis 11.2.1 APAC Micro Irrigation Market Size, By Segmental Analysis (2013-2017) 123 11.2.2 APAC Micro Irrigation Market Size, By Segmental Analysis (2018-2023) 124 11.3 India Micro Irrigation Market 126 11.3.1 India Micro Irrigation Market Size, 2013-2023 (USD Million) 127 11.4 India Micro Irrigation Market : Segment Analysis 11.4.1 India Micro Irrigation Market: By End Users, 2013-2017 (USD Million) 128 11.4.2 India Micro Irrigation Market: By End Users, 2013-2017 (USD Million) 129
  • 9. Table of Content 9 S.No Particulars Page No. 11.5 China Micro Irrigation Market 143 11.5.1 China Micro Irrigation Market Size, 2013-2023 (USD Million) 144 11.6 China Micro Irrigation Market : Segment Analysis 11.6.1 China Micro Irrigation Market: By End Users, 2013-2017 (USD Million) 145 11.6.2 China Micro Irrigation Market : By End Users, 2018-2023 (USD Million) 146 11.7 Australia Micro Irrigation Market 11.7.1 Australia Micro Irrigation Market Size, 2013-2023 (USD Million) 152 11.8 Australia Micro Irrigation Market : Segment Analysis 11.8.1 Australia Micro Irrigation Market: By End Users, 2013-2017 (USD Million) 153 11.8.2 Australia Micro Irrigation Market : By End Users, 2018-2023 (USD Million) 154
  • 10. Table of Content 10 S.No Particulars Page No. 12 ROW Micro Irrigation Market 12.1 ROW Micro Irrigation Market: Growth and Forecast 12.1.1 By Value (2013-2017) 161 12.1.2 By Value (2018-2023) 161 12.2 ROW Micro Irrigation Market Size: Segment Analysis 11.2.1 ROW Micro Irrigation Market Size, By Segmental Analysis (2013-2017) 161 11.2.2 ROW Micro Irrigation Market Size, By Segmental Analysis (2018-2023) 161 12.3 Israel Micro Irrigation Market 12.3.1 Israel Micro Irrigation Market Size, 2013-2023 (USD Million) 165 12.4 Israel Micro Irrigation Market : Segment Analysis 12.4.1 Israel Micro Irrigation Market: By End Users, 2013-2017 (USD Million) 166 12.4.2 Israel Micro Irrigation Market: By End Users, 2013-2017 (USD Million) 166
  • 11. Table of Content 11 S.No Particulars Page No. 13 Global Micro Irrigation Market Dynamics 170 13.1 Global Micro Irrigation Market Drivers 171 13.2 Global Micro Irrigation Market Challenges 177 13.3 Global Micro Irrigation Market Trends 180 14 Porter Five Analysis 183 15 SWOT Analysis 185 16 Supply Chain Analysis 187 17 Product Specifications 189 18 Company Profiling 192 18.1 Netafim 193 18.2 The Toro Company 195 18.3 Jains Irrigation Limited 197 18.4 RainBird Corporation 200
  • 12. Table of Content S.No Particulars Page No. 18.5 Valmont Industries 201 18.6 Lindsay Corporation 203 18.7 Rivulis Corporation 205 18.8 Nelson 206 18.9 T-L Irrigations 207 19. About Us 208 12
  • 13. List of Figures Figure No. Figure Title Page No. Figure 1: Crops using Micro Irrigation 31 Figure 2: Global Micro Irrigation Market Size, By Value, 2013-2017 (USD Million) 34 Figure 3: Global Micro Irrigation Market Size, By Value, Forecast, 2018-2023 (USD Million) 35 Figure 4: Global Population, 2013-2016 (Billion) 36 Figure 5: Micro Irrigation Penetration Rate (%) 38 Figure 6: Advanced Irrigation Adoption, By Countries, (% out of irrigated Area) 40 Figure 7: Inefficient use of water 41 Figure 8: Leading countries of Agricultural Irrigated Land, By Countries (% of total irrigated land) 43 Figure 9: Total World Irrigated Area, 2016 44 Figure 10: Total Irrigated Area (%) 45 Figure 11: Total Micro Irrigation Area (%) 45 Figure 12: Global Micro Irrigation Market Size, By Segments, 2017 (%) 48 Figure 13: Global Micro Irrigation Market Size, By Segments, 2023 (%) 49 Figure 14: Total Irrigated Area, By micro and Sprinkler Irrigation 50 Figure 15: Global Drip Irrigation Market, By Value, 2013-2017 (USD Million) 51 Figure 16: Global Drip Irrigation Market, By Value, Forecast, 2018-2023 (USD Million) 51 Figure 17: Global Sprinkler Irrigation Market, By Value, 2013-2017 (USD Million) 53 Figure 18: Global Sprinkler Irrigation Market, By Value, Forecast, 2018-2023 (USD Million) 53 Figure 19: Total Sprinkler Irrigation Area (%) 54 Figure 20: Global Micro Irrigation Market Size, By Region, 2017 (%) 56 13
  • 14. List of Figures Figure No. Figure Title Page No. Figure 21: Global Micro Irrigation Market Size, By Region, 2023 (%) 57 Figure 22: North America Micro Irrigation Market Size, By Value, 2013-2017 (USD Million ) 59 Figure 23: North America Micro Irrigation Market Size, By Value, Forecast, 2018-2023 (USD Million) 60 Figure 24: North America Population, 2013-2016 (Million) 61 Figure 25: North America GDP, 2013-2016 (USD Trillion) 61 Figure 26: North America Crop Production, By Countries 2017 ( Million metric Tonnes) 62 Figure 27: North America Micro Irrigation Market: By Segments, By Value, 2013-2017 (USD Million) 66 Figure 28: North America Micro Irrigation Market: By Segments, By Value, 2018-2023 (USD Million) 67 Figure 29: U.S. Micro Irrigation Market Size, By Value, 2013-2023 (USD Million) 70 Figure 30: U.S. Micro Irrigation Market: By Segments, By Value, 2013-2017 (USD Million) 71 Figure 31: U.S. Irrigation Market: By Segments, By Value, 2018-2023 (USD Million) 72 Figure 32: Population of United States, 2013-2018 (million) 73 Figure 33: United States Primary Sources of Irrigation. 74 Figure 34: Mexico Micro Irrigation Market Size, By Value, 2013-2023 (USD Million ) 79 Figure 35: Mexico Micro Irrigation Market: By Segments, By Value, 2013-2017 (USD Million) 80 Figure 36: Mexico Micro Irrigation Market: By Segments, By Value, 2018-2023 (USD Million) 81 Figure 37: Mexico, GDP per capita 2013-2017 (USD) 83 Figure 38: Mexico, By Population, 2013-2018 (% of total) 83 Figure 39: Mexico Average Precipitation, 2013-2017 (in %) 84 Figure 40: Major Players in Micro Irrigation Market in North America 85 14
  • 15. List of Figures Figure No. Figure Title Page No. Figure 41: North America Micro Irrigation Market, Country Share, 2013-2017 (% of Total) 86 Figure 42: North America Micro Irrigation Market, Country Share, 2018-2023 (% of Total) 86 Figure 43: Europe Micro Irrigation Market Size, By Value, 2013-2017 (USD Million) 88 Figure 44: Europe Micro Irrigation Market Size, By Value, Forecast, 2018-2023 (USD Million) 89 Figure 45: European Union Population, 2013-2017 (Million) 91 Figure 46: European Union, GDP per capita, 2013-2017 (Trillion) 91 Figure 47: European Union, Types of Irrigation 94 Figure 48: European Union, Types of Irrigation 95 Figure 49: Europe Micro Irrigation Market: By Segments, By Value, 2013-2017 (USD Million) 97 Figure 50: Europe Micro Irrigation Market: By Segments, By Value, 2018-2023 (USD Million) 98 Figure 51: U.K. Micro Irrigation Market Size, By Value, 2013-2023 (USD Million) 101 Figure 52: U.K. Micro Irrigation Market: By Segments, By Value, 2013-2017 (USD Million) 102 Figure 53: U.K. Micro Irrigation Market: By Segments, By Value, 2018-2023 (USD Million) 103 Figure 54: Total Agricultural Area in United Kingdom, 2013-2016 (thousand hectares) 104 Figure 55: Growth in U.K Population, 2013-2017 (In millions) 105 Figure 56: Italy Micro Irrigation Market Size, By Value, 2013-2023 (USD Million) 107 Figure 57: Italy Micro Irrigation Market: By Segments, By Value, 2013-2017 (USD Million) 108 Figure 58: Italy Micro Irrigation Market: By Segments, By Value, 2018-2023 (USD Million) 109 Figure 59: Irrigation system used in Italy, 2014 112 Figure 60: Italy, Population Growth, 2013-2017 (USD) 113 15
  • 16. List of Figures Figure No. Figure Title Page No. Figure 61: Italy, GDP per capita, 2013-2017 (USD) 113 Figure 62: Major Players in Micro Irrigation Market in Europe 114 Figure 63: Europe Micro Irrigation Market, Country Share, Historic, 2013-2017(% of Total) 115 Figure 64: Europe Micro Irrigation Market, Country Share, Forecast, 2018-2023 (% of Total) 115 Figure 65: APAC Micro Irrigation Market Size, By Value, 2013-2017 (USD Million) 117 Figure 66: APAC Micro Irrigation Market Size, By Value, Forecast, 2018-2023(USD Million) 118 Figure 67: APAC Micro Irrigation Market: By Segments, By Value, 2013-2017 (USD Million) 123 Figure 68: APAC Micro Irrigation Market: By Segments, By Value, 2018-2023 (USD Million) 124 Figure 69: India Micro Irrigation Market Size, By Value, 2013-2023 (USD Million) 127 Figure 70: India Micro Irrigation Market: By Segments, By Value, 2013-2017 (USD Million) 128 Figure 71: India Micro Irrigation Market: By Segments, By Value, 2018-2023 (USD Million) 129 Figure 72: State-wise Fund Allocation and Utilization 131 Figure 73: India -Top 10 states area covered under Micro Irrigation, 2015 (Million Hectares) 133 Figure 74: All India area covered under Micro Irrigation, By Segments, 2015 (Million Hectare) 133 Figure 75: India - Major States area covered under Drip Irrigation, By States, 2016 (%) 134 Figure 76: India - Major States area covered under Micro Irrigation, By States, 2016 (%) 135 Figure 77: India - Major States Micro Irrigation Penetration rate, 2015 (%) 136 Figure 78: India - Energy Consumption Savings, By State, 2015 138 Figure 79: India - Fertilizer Consumption Savings, By state, 2015 138 Figure 80: India- Fruits Crop Productivity, By state, 2015 139 16
  • 17. List of Figures Figure No. Figure Title Page No. Figure 81: India - Vegetable Crop Productivity, By state, 2015 139 Figure 82: India - Increase in Farmer’s Income, By state, 2015 (%) 140 Figure 83: India - Introduction of new crop, By state, 2015 140 Figure 84: India - Irrigation Cost Savings, By States, 2015 (%) 141 Figure 85: State-wise Potential for Micro Irrigation in India 142 Figure 86: China Micro Irrigation Market Size, By Value, 2013-2023 (USD Million) 144 Figure 87: China Micro Irrigation Market: By Segments, By Value, 2013-2017 (USD Million) 145 Figure 88: China Micro Irrigation Market: By Segments, By Value, 2018-2023 (USD Million) 146 Figure 89: China, By Population Growth, 2013-2016 (In trillion) 148 Figure 90: China Size of irrigated areas, 2016 (million hectares) 149 Figure 91: China’s GDP (Current USD), 2013-2016 (Trillion) 150 Figure 92: Australia Micro Irrigation Market Size, By Value, 2013-2023 (USD Million) 152 Figure 93: Australia Micro Irrigation Market: By Segments, By Value, 2013-2017 (USD Million) 153 Figure 94: Australia Micro Irrigation Market: By Segments, By Value, 2018-2023 (USD Million) 154 Figure 95: Irrigation Methods in Australia 157 Figure 96: Australia Population, 2013-2017 (Millions) 158 Figure 97: Australia GDP Growth Rate, 2013-2017 (In %) 158 Figure 98: APAC Micro Irrigation Market, Country Share, 2013-2017 (% of Total) 159 Figure 99: APAC Micro Irrigation Market, Country Share, 2018-2023 (% of Total) 159 Figure 100: ROW Micro Irrigation Market Size, By Value, 2013-2023 (USD Million) 161 17
  • 18. List of Figures Figure No. Figure Title Page No. Figure 101: Israel Micro Irrigation Market Size, By Value, 2013-2023 (USD Million) 164 Figure 102: Israel Micro Irrigation Market: By Segments, By Value, 2013-2017 (USD Million) 165 Figure 103: Israel Micro Irrigation Market: By Segments, By Value, 2018-2023 (USD Million) 166 Figure 104: Water Consumption in Israel 168 Figure 105: Israel - Water Consumption for Agriculture 169 Figure 106: Water Usage, Worldwide (%) 175 Figure 107: Water Usage, By Developed Countries (%) 175 Figure 108: Water Usage, By Developing and Poor countries, (%) 175 Figure 109: Netafim, Net Sales, by segments, 2016 (%) 194 Figure 110: Netafim, Net Sales, By Geographical Region, 2017 (%) 194 Figure 111: The Toro company, Net Revenue, 2013-2017,(USD billion) 196 Figure 112: The Toro Company, Net Sales, by segments, 2017 (%) 196 Figure 113: The Toro Company, Net Sales, By Geographical Region, 2017 (%) 196 Figure 114: Jains Irrigation Company, Net Sales, 2013-2017 (USD Million) 198 Figure 115: Jains Irrigation Net Sales, By Business Segment, 2017 (%) 198 Figure 116: Jains Irrigation Net Sales, By Geographical Region, 2017 (%) 198 Figure 117: High Tech Agricultural Input Products, By Revenues, 2013-2017 ( in million) 199 Figure 118: Valmont Industries, Net Sales, 2013-2017 (USD Thousands) 202 Figure 119: Valmont Industries, Net Sales, By Business Segment, 2017 (%) 202 Figure 120: Valmont Industries, Sales, By Geographical Region, 2017 (%) 202 18
  • 19. List of Figures Figure No. Figure Title Page No. Figure 121: Lindsay Corporation, Net Revenues, 2013-2017 (USD Million) 204 Figure 122: Lindsay Corporation, Net Sales, By Business Segment, 2017 (%) 204 Figure 123: Lindsay Corporation, Net Sales, By Geographical Region, 2017 (%) 204 19
  • 20. List of Figures Figure No. Figure Title Page No. Table 1: Comparison between drip and sprinkler irrigation 30 Table 2: Common Micro Irrigation Technologies in United States 76 Table 3: Technological Improvements in Micro irrigation 92 Table 4: Crop-wise Potential for micro irrigation in India 137 Table 5: Application Methods of Irrigation 156 Table 6: New Irrigation Technologies, By Select Company 190 20
  • 21. Research Methodology For our study on Global Micro-Irrigation Market, we have conducted comprehensive secondary research followed by an extensive primary research. In the process of secondary research, we have scrutinized industry documents, accessed from open sources, premium paid databases (Bloomberg, Thomson Reuters, Factiva) and our internal knowledge base. In the process of primary research, we have interviewed various industry experts across the value chain of the Micro-Irrigations. Market size of the actual period (2013-2017) has been evaluated on the basis of growth trends of the industry in the last five years, and confirming the findings through primary research. Annual reports of the companies were scanned to further validate the market size and to estimate the size of various other end-user sectors. Market sizing and growth in the forecast period (2018-2023) is estimated through product mapping, application in end-user industries, growth of allied sectors and historical growth pattern of the industry. All the relevant data points/ statistics in the forecast period are validated through relevant and reliable primary sources. Report Focus: Global Micro-Irrigation Market - By Product Type- (Drip Irrigation, Sprinkler Irrigation) - By Region (North America, Europe, Asia Pacific, Rest of World) - By Country (US,Mexico, UK, Italy, China, India, Israel, Australia) - By Company (Netafim Ltd, The Toro Company, Jain Irrigations, T-L Irrigations, Valmont Industries, Lindsay Corporation, Nelson , Rivulis Corporation , Rainbird Corporation). 21
  • 22. 22 Micro Irrigation Market : Product Outlook Drip Irrigation Sprinkler Irrigation Water Saving xx xx Irrigation Efficiency xx xx Weed Problem xx xx Suitable water xx xx Diseases and Pests xx xx Efficiency of fertilizer use xx xx Table 1: Comparison between drip and sprinkler irrigation
  • 23. Global Micro Irrigation Market Overview Source: Azoth Analytics Estimates Xx Xx Xx Xx Xx Global Micro Irrigation market has been boosted by proliferating demand of food and agricultural products leading to the rising demand. 2013 2014 2015 2016 2017 Figure 2: Global Micro Irrigation Market Size, By Value, 2013-2017 (USD Million) CAGR 2013-2017 xx% 23
  • 24. Global Micro Irrigation Market Overview Surging investment in the development of affordable and innovative Micro Irrigations is likely to drive the demand growth in forecast period. Xx Xx Xx Xx Xx 2018 2019 2020 2021 2022 2023 Source: Azoth Analytics Estimates CAGR 2018-2023 xx% Figure 3: Global Micro Irrigation Market Size, By Value, Forecast, 2018-2023 (USD Million) 24
  • 25. Global Micro Irrigation Market- By Segment Figure 13: Global Micro Irrigation Market Size, By Segments, 2023 (%) In the forecast period, drip irrigation segment is likely to dominate the overall market. However, it is the fastest growing segment in the market Drip Irrigation Sprinkler Irrigation Others Source: Azoth Analytics Estimates Key Drivers 25 xx xx xx
  • 26. North America Micro Irrigation Market Overview Source: Azoth Analytics Estimates Xx Xx Xx Xx Xx Micro Irrigation market in North America has seen huge growth due to increasing population coupled with decreasing water shortage. 2013 2014 2015 2016 2017 Figure 22: North America Micro Irrigation Market Size, By Value, 2013-2017 (USD Million ) CAGR 2013-2017 xx% 26
  • 27. North America Micro Irrigation Market Overview Noteworthy growth in the regional market is attributed to high focus on international sales, mergers and acquisitions. Xx Xx Xx Xx Xx 1675.77 2069.36 2477.33 2890.45 3328.41 3794.71 2018 2019 2020 2021 2022 2023 Source: Azoth Analytics Estimates CAGR 2018-2023 xx% Figure 23: North America Micro Irrigation Market Size, By Value, Forecast, 2018-2023 (USD Million) 27
  • 28. Source: Azoth Analytics Estimates Figure 27: North America Micro Irrigation Market: By Segments, By Value, 2013-2017 (USD Million) CAGR 2013-2017 Drip Irrigation – x% Sprinkler Irrigation – x% Others - x% North America Micro Irrigation Market, By Segment 28 2013 2014 2015 2016 2017 Drip Irrigation Sprinkler Irrigation Others 2013 2014 2015 2016 2017 Drip Irrigation Sprinkler Irrigation Others
  • 29. Source: Azoth Analytics Estimates Figure 28: North America Micro Irrigation Market: By Segments, By Value, 2018-2023 (USD Million) CAGR 2018-2023 Drip Irrigation – x% Sprinkler Irrigation – x% Others – x% North America Micro Irrigation Market, By Segment 29 2018 2019 2020 2021 2022 2023 Drip Irrigation Sprinkler Irrigation Others 2018 2019 2020 2021 2022 2023 Drip Irrigation Sprinkler Irrigation Others
  • 30. Source: Azoth Analytics Estimates Figure 30: U.S. Micro Irrigation Market: By Segments, By Value, 2013-2017 (USD Million) CAGR 2013-2017 Drip Irrigation – x% Sprinkler Irrigation – x% Others – x% U.S. Micro Irrigation Market, By Segment 30 2013 2014 2015 2016 2017 Drip Irrigation Sprinkler Irrigation Others 2013 2014 2015 2016 2017 Drip Irrigation Sprinkler Irrigation Others
  • 31. Source: Azoth Analytics Estimates Figure 31: U.S. Micro Irrigation Market: By Segments, By Value, 2018-2023 (USD Million) CAGR 2018-2023 Drip Irrigation – x% Sprinkler Irrigation – x% Others – x% U.S. Micro Irrigation Market, By Segment 31 2018 2019 2020 2021 2022 2023 Drip Irrigation Sprinkler Irrigation Others 2018 2019 2020 2021 2022 2023 Drip Irrigation Sprinkler Irrigation Others
  • 32. BARRIERS TO ENTRY – MODERATE TO HIGH 1. Xx 2. xx 3. Xx BUYER’S POWER – MODERATE 1. Xx 2. Xx 3. Xx SUPPLIER POWER – MODERATE 1. Xx 2. Xx 3. Xx THREATS OF SUBSTITUTES – LOW 1. Xx 2. Xx 3. Xx INDUSTRY COMPETITION- HIGH 1. Xx 2. Xx 3. Xx 32 Porter Five Forces Model - Micro Irrigation Market
  • 33. SWOT Threats  Xx  Xx  Xx  Xx  Xx  Xx Weakness  Xx  Xx  Xx  Xx  Xx  Xx OpportunityStrengths  xx  Xx  Xx  Xx  Xx  Xx  Xx  Xx  Xx  Xx  Xx 33 SWOT Analysis - Micro Irrigation Market
  • 34. About Azoth Analytics Pvt Ltd. Azoth Analytics is a business research and analytics firm that creates in-depth research reports and provides customized research solutions and consultancy Application. Verticals in which Azoth Analytics specializes include healthcare and pharmaceutical, oil and gas, retail, chemicals, automotive, FMCG, food & beverages and technology. Azoth creates comprehensive and in-depth research reports by recording, interpreting and analyzing information. Strategic market sizing and data dredging techniques include secondary research, and primary research (interviews with management personnel and industry experts). Disclaimer: Azoth Analytics report information is based mainly on interviews and therefore, is subject to fluctuation. Azoth Analytics therefore, takes no responsibility for any incorrect information supplied to us by industry experts, manufacturers or users. Azoth does not warranty the completeness of the information and data. Also, analysis provided in the report are meant for customers’ internal use only and not for general publication or disclosure to third parties. 34