SlideShare a Scribd company logo
1 of 12
GDP
Gross domestic product (GDP), is one of the ways for measuring the size of its economy. The GDP of a
country is defined as the market value of all final goods and services produced within a country in a given
period of time. It is also considered the sum of value added at every stage of production of all final goods and
services produced within a country in a given period of time.
With this we can derive the equation:
GDP = consumption + investment + (government spending) + (exports − imports)
Major components-
1. Agriculture (forestry & fishing)
2...Industry (manufacturing, mining and quarrying, electricity, gas and water supply)
3. Services (Trade, Hotels, transport & Communication, Financing, Insurance, real estate & business services,
Public administration & defence and other services and construction)
GDP Growth
GDP reaching new heights
India is the second fastest growing major
economy in the world, with a GDP growth rate
of 9.4% for the fiscal year 2006–2007.
GDP can be defined as the monetary value of
all the finished goods and services produced
within a country's borders during a fiscal year.
It includes all private and public consumption,
government outlays, investments and net
exports (exports-imports) that occur within a
defined territory. .
Real GDP growth averaged 8.6% during the
four year period from 2003-04 to 2006-07.
 Agriculture, forestry & Fishing, Mining
& Quarrying presently contributes about 17% to the GDP and growing at 2.6 %.
 Whereas industry, the second largest contributor to the GDP contribution at 27% growing at 8.9%
which includes Manufacturing (9.4%), mining and quarrying (3.4%), electricity, gas and water
supply(7.8%) in an economy.
 Services sector contributes highest to GDP at 56% and growing at 10.7%. Trade, Hotels, transport
and Communication industries(12.1%) have been the largest contributors to the GDP from FY03
onwards, Financing, Insurance, real estate and business services are the industry segments that have
registered highest growth (11.7%) in GDP during FY06 and construction industry contributing
(9.6%) to the GDP.
7.5
9
9.4
0
1
2
3
4
5
6
7
8
9
10
2004-05 2005-06 2006-07
in%
GDP Growth Rate
Source: RBI
Sectors contribution to GDP
Agriculture Sector
Agriculture Sector growth hampered by uneven distribution of rain
.The contribution of the agricultural sector to GDP has declined from 19.7% in the year 2005-06 to 17% in
the year 2006-07. Growth rate of the agriculture sector is lagging in compare to their peer sectors.
‘Agriculture and allied activities’ growth slowed down from 6.0 per cent in 2005-06 to 2.7 per cent in 2006-07.
But there not had seen any shortage in the production of food grain and the area covered in year 2006-07, in
compare to previous year the total food grain production is increased by 11.4 million tones. This falling
contribution to GDP has been a matter of concern, the reasons being
• Uneven distribution of rainfall and falling water levels
• Inadequate adoption of modern agricultural practices and use of technology
• Conversion of agricultural land to SEZs, and their urbanization
• inadequate or inefficient finance and marketing services for farm produce and produce that do not
meet international standards
• Underdeveloped Infrastructure facilities.
• Low quality seeds.
Industrial Sector
Industrial Sector backed by manufacturing sector
The over-all industrial growth for the first
quarter of 2007-08 is 11.7% as compared to
11.5% during 2006-07 and 8.2% in 2005-06.
The manufacturing sector grew by 12.3 per cent
during April-March 2006-07 when compared to
11.3%. It remained the key driver of industrial
growth. The manufacturing sector with double
digit growth 10.9% continued to be the key
driver of industrial activity, contributing almost
92.5% of the growth in industry. The growth of
manufacturing sector is backed by the strong
demand of “machinery and equipments”, “basic
metal and alloy industry”. The capital goods
sector maintained its growth momentum (18.3
per cent during April-March 2006-07 as
compared with 16.3 per cent a year ago) on the
back of strong investment demand. It is mainly
benefited from growth in agricultural
implements, boilers, diesel engines, insulated
cable wires, computer systems and their
peripherals. Mining and electricity sectors too
pushed the overall industrial growth posting a
high growth of 5.1% and 7.2% in 2006-07
0
5
10
15
Mining Manufacturing Elctricity
in%
Major Industrial Sector Growth
2005-06 2006-07
Source: RBI Publications
Industry wise growth
5.5 5.9
10.4
-0.3
12.6
9.4
7.2
9
0.7
10.1
-0.1
15
7.4 8.1
-2
0
2
4
6
8
10
12
14
16
Electricity
coal
Finishedsteel
crude
petroleum
petroleumref.
products
cement
overall
infrastructure
percent
Apr-May 06 Apr-May07
Source: RBI Publications
respectively as against the 1.0% and 5.3% growth respectively in 2005-06. Basic goods and intermediate
goods sectors recorded growth of 10.3 per cent and 11.9 per cent, respectively - the highest growth rates
since 1995-96 - spurred by higher production of cement, high speed diesel, iron and steel products, polyester
fiber, viscose staple fiber Growth in consumer goods sector, both durables and non-durables, decelerated.
Decline in production of some food products and a few drugs contributed to the lower growth in consumer
non-durables.
Services Sector
Largest contributor to the GDP
The Key driver of this year’s GDP growth rate has been the Service sector contributing a little over 55.1% to
the GDP with double-digit growth has further strengthened its place as the leading sector of the Indian
economy. The services sector, with a growth rate of 11.0 per cent as compared with 10.3 per cent a year ago,
continued to be the key driver of economic activity. ‘Trade, hotels, transport and communication’(13.0%) and
‘financing, insurance, real estate and business services’(10.6%) registered double-digit growth rates, offsetting
the deceleration in ‘construction’(currently 10.7%). The IT/ITES contributes to India's GDP from 1.2%
during 1999-2000 to 5.4% in 2006-07. The tourism industry also made a remarkable growth. However, there
is still huge scope for improvement including the tourism industry. The total foreign exchange earnings
during January- May 2007 stood at USUS$ 3071.34 million against USUS$ 2616.24 million for the same
period in 2006. Financing, insurance, real estate and business services is supported by acceleration of growth
in bank deposits, sustained growth in non-food credit and continued buoyancy in business process
outsourcing and information technology-enabled services exports.
Index of industrial Production (IIP)
Index of Industrial Production is an economic indicator that gives real production output of a country. This
index gives the idea about the performance of the industry and the type of returns that can be expected as an
investor.
The index of Industrial production (IIP) is an indicator to measure the changes in the physical volume of the
output of Industrial sector. The General Index stands at 264.2, which is 11.1% higher as compared to the
level in the month of May 2006. The cumulative growth for the period April-May 2007-08 stands at 11.7%
over the corresponding period of the pervious
year .IIP-General Index had its seasonal peak
of 108.0 in March and trough of 95.8 in April.
This seasonal peak of IIP-General Index in
March had remained same over the years, but
the trough varied in the months of April, June
and September.
Capital goods fuels IIP Index
Capital goods have to a great extent
contributed to the rise of the IIP. The
industries in the year 2006-07 have
concentrated on Capacity expansion. Capital
goods recorded a growth rate of 17.7% in the
FY06-07.
Source: RBI Publications
0
500
1000
1500
2000
1999-
00
2000-
01
2001-
02
2002-
03
2003-
04
2004-
05
2005-
06
2006-
07
Index(Base100)
Index of Industrial Production
Basic Goods Capital Goods Consumer Goods
Electricity IIP General Index IntermediateGoods
Manufacturing Mining & Quarrying
Growth of Manufacturing sector
0
5
10
15
20
25
Basic Goods Capital Goods Consumer
Goods
Intermediate
Goods
Years
Growth%
2004-05 2005-06 2006-07
www.rbi.org.in
Manufacturing Sector’s contribution to the IIP
The Manufacturing industry has been suffering
due to obsolete technology and ageing
machinery. However, the introduction of FDIs
in the sector has not only increased the
productivity in the industry but also enabled
exports from the sector.
This growth has happened mainly because of
the growth in mining, manufacturing and
electricity with corresponding growth rate of
3.7%, 11.9% and 9.4% respectively. Basic goods
and intermediate goods sectors recorded
growth of 10.3 % and 11.9 %, respectively - the
highest growth rates since 1995-96 - spurred by
higher production of cement, high speed diesel,
iron and steel products, polyester fiber, viscose
staple fiber Growth in consumer goods sector,
both durables and non-durables, decelerated.
The reason why capital goods’ growth has
increased is because of the demand for infrastructural facility. Indian government is targeting the development
of almost 350 non metro airports throughout the country. Because of this, there is a rise even for basic goods
like cement and metals.
External trade
High growth in Non-POL have fuelled growth
In 2006-07, the growth in export and
import is one and the same. India’s
balance of payments position has
continued to remain comfortable during
2006-07. Merchandise exports recorded
strong growth, but lower than last year.
14.05% in June 2007 from last year’s
18.07%. India’s merchandise exports
during 2006-07 registered a growth of
20.9% as compared with 26.3% a year ago.
Merchandise exports of the country
surged to US$125 bn in the year ending
March 2007 from US$63.84 bn three years
ago. The contribution of services to
exports stood at US$76bn. Out of the
total services, software contributed
US$31.4bn, engineering stood at US$24.9bn while, others contributed US$39.7bn. Merchandise contributed
62% to total export thus remaining the key growth driver. For the first quarter of the financial year 2007-08,
the exports amounted US$34.3bn.
Import & Export with growth rate
0
50
100
150
200
250
1999-00 2001-02 2003-04 2005-06
US$billion
-10
0
10
20
30
40
50
%Rate
Exports (LHS) Imports (LHS)
% Change in Exports (RHS) % Change in Imports (RHS)
'
Source: http://indiabudget.nic.in/
India’s merchandise imports stood at
US$181.37 bn with non-oil constituting
US$124.1 bn and oil imports US$57.27 bn.
Service imports touched US$71.64 bn in 2006-
07. India’s merchandise imports registered a
growth of 21.6% during 2006-07 on top of
33.8% growth a year ago. During 2006-07,
non-oil imports grew by 25.7% and accounted
for almost 64% of the rise in total imports.
For the first quarter of the financial year 2007-
08 the imports amounted to US$54.9bn
whereas the oil imports amounted to
US$14.83bn, the non-oil imports amounted to
US$40bn. The trade deficit for the same
period stood at US$20.6bn.
Major contributor’s to GDP
Software contributed 16% to the total exports. Personal & recreational services, banking and financial
services registered an unbelievably high growth of 82.4%, 96.0% and 88.5% respectively. Imports on the
other hand, accounted for US$185 billion, major imports being capital goods. The non-POL (petroleum, oil
and lubricants) constitutes almost 78-80% of total imports and have registered a growth of 47% over the
previous year.
Major export and import partner
The major part of the Indian export is shared by US (16.7%), UAE (8.5%), China (6.6%), Singapore (5.3%)
and UK (4.9%) and the major items of export are Textiles goods, gems and jewellery, Engineering goods,
chemicals and lather manufactures The major part of Indian import comes from China (7.3%), US (5.6%)
and Switzerland (4.7%), the major items of Indian import are crude oil, machinery, gems, fertilizer and
chemicals.
Monetary Policy
RBI’s Monetary Policy Plan for a growing economy
Monetary policy is the process by which the government, central bank, or monetary authority manages the
money supply to achieve specific goals like constraining inflation or deflation and maintaining an exchange
rate. RBI, Indian Central bank and monetary authority announces its policy twice in a year and is reviewed on
a regular basis. Continuing high levels of crude oil prices during the first half of the year and rising primary
commodity prices in the international market impacted price developments in the domestic economy.
Considering the emerging trends, the objectives and overall stance of policy announced by the RBI in its
Annual Policy Statement for 2006-07 were:
(i) to ensure a monetary and interest rate environment that enables continuation of the growth
momentum consistent with price stability
(ii) to focus on credit quality and financial market conditions to support export and investment demand
in the economy for maintaining macroeconomic stability and, in particular, financial stability
(iii) to respond swiftly to evolving global developments.
Monthly Inflation rate
0
1
2
3
4
5
6
7
8
A
pr
M
ay
June
July
A
ug
S
ep
O
ct
N
ov
D
ec
Jan
Feb
M
ar
In%
2005-06 2006-07
Source: indiastat.com
In view of the impact of the increases in key rates in the past year, the RBI has justifiably not tinkered with
them this time around — Bank rate (6%), reverse repo rate (6%) and repo rate (7.75%) — to ensure that the
growth momentum continues. On a review of the current liquidity situation, it is considered desirable to
increase the CRR by 50 basis points to 7.0 per cent with effect from the fortnight beginning August 4, 2007
which will drain out around Rs16000 crore. This measure is expected to lift the overnight call money rates
from below 1% levels prevailing for over two months to almost 6%. In view of the current macroeconomic
and overall monetary and liquidity conditions, it has been decided to withdraw the ceiling of Rs. 3,000
crore on daily reverse repo under the LAF with effect from Monday, August 6, 2007. The Reserve Bank,
however, retains the discretion to re-impose a ceiling as appropriate and has the flexibility to conduct
repo/reverse repo auctions at a fixed rate or at variable rates as circumstances warrant.
• Growth in non-food credit has remained above 30 percent; broad money growth was 19.0 percent,
Reserve money growth was 20.4 per cent year-on-year (y-o-y) basis.
• Listed Indian companies limit for portfolio investment in listed overseas companies enhanced to
35% of net worth
• The overseas investment limit (total financial commitment) for Indian companies has been enhanced
to 300% of their net worth.
• The aggregate ceiling on overseas investment by mutual funds has been raised to US$4billion
• Prepayment of External Commercial Borrowings(ECBs) without RBI approval has been increased to
US$400 million.
• Raising the limit for individuals for any permitted current or capital account transaction from
US$50,000 to US$100,000 per financial year
Major reason of inflation – Primary food items
Inflation is the rate at which the general
level of prices for goods and services are
rising and subsequently increasing the
purchasing power. Inflation has both
positive and negative effect according to the
range in which it operates Primary food
articles prices have emerged as the key
driver of inflation during 2006-07 so far.
Pre-emptive monetary and fiscal measures
have helped in containing inflationary
expectations although underlying
inflationary pressures remain. Taking into
account the impact of real, monetary and
global factors on domestic prices, the
Reserve Bank in its Quarterly Policy
Statement for 2007-08 (July 2007) noted
that containing inflationary expectations
would continue to pose a challenge to monetary management. Accordingly, holding headline inflation within
5.0 per cent in 2007-08 assumes priority in the policy hierarchy; while reinforcing the medium-term objective
to condition policy and perceptions to reduce inflation to 4.0-4.5 per cent on a sustained basis.
Interest Rate
Source: rbi.org.in
-200
-100
0
100
200
300
400
500
in Rs
billion
2003-04 2004-05 2005-06 2006-07
India's Fiscal Deficit
Revenue receipts Revenue expenditure Fiscal Deficit
10-year G-Sec interest Rate rise
Interest rates are the rate of return on an investment in specific investment tools. The information given
below gives the details of return (yield) on government securities.
During the early part of 2006-07, yields on 10-year G-sec hardened further because of the following reasons:
 a surge in the crude oil prices
in the international market,
 tightening of monetary policy
in the US and other
economies,
 hike in domestic policy rates
The 10 year G-sec rates peaked at 8.39% on
July 11, 2006, and remained above 8.00 % up
to August 23, 2006. It declined gradually to
7.38% on December 5, 2006 in consonance
with a rally in the price of US bonds of similar
maturity, following a pause in the US Federal funds rate hike and downward movement in the crude oil prices
in the world markets. This softening trend was reversed thereafter and, with continued high growth in bank
credit and the announcement on December 8, 2006 of hikes in the CRR by 25basis points each in two phases
in the next 30 days to curb monetary accommodation of inflation, the yield started hardening. Yield increased
from 7.39% on December 8, to 7.87% on January 23, 2007 and softened to 7.73% on January 31, 2007,
before hardening again on February 14, 2007 to 8.08%. The yields on Government securities with 10-year
and 20-year residual maturity also eased during this period from 7.97 per cent to 7.89 per cent and from 8.23
per cent to 8.21 per cent, respectively. Consequently, the yield spread between 10-year and one-year
Government securities widened from 42 basis points to 105 basis points whereas the spread between 20-year
and one-year Government securities widened from 68 basis points to 137 basis points over this period.
Fiscal Policy
Fiscal policy is the instrument by which a
government adjusts its levels of spending in
order to monitor a nation's economy. It is the
sister strategy to monetary policy, with
which a RBI influences a nation's money
supply. These two policies are used in
various combinations in an order to
direct a country's economic goals..
Unproductive expenditure, tax
distortions and high deficits are
considered to have constrained the
economy from realizing its full growth
potential. The medium-term fiscal policy
stance of Government, therefore, has been
to reduce deficits; prioritize expenditure and
ensure that these results in intended
outcomes; and augment resources by widening the tax base and improving the
Yeild on 10yr G-Sec Bonds
7.89
6.67
7.51
6
6.5
7
7.5
8
2004-05 2005-06 2006-07*
In%age
Source: rbi.org.in
combined Deficit Indicators:Centre and States
0
2
4
6
8
10
12
2001-02 2002-03 2003-04 2004-05 2005-06 2006-07
fiscal deficit
revenue deficit
primary deficit
Source: rbi.org.in
compliance while maintaining moderate
rates.
The key fiscal indicators, viz., gross fiscal
deficit (GFD), revenue deficit and
primary deficit of combined finances of
the Central and State Governments are
budgeted to decline by 0.7-0.9 percentage
points of GDP during 2007-08 over the
revised estimates (RE) for 2006-07..
Tax to GDP Ratio
The revenue deficit, primary deficit, fiscal deficit are at: 2.1%, 0.2% and 3.8%, respectively as a percentage of
GDP.. The gross tax-GDP ratio, which had stagnated at 8-10 per cent range, increased to 10.3 per cent in
2005-06 and is expected to improve further to 10.8 per cent in 2006-07(BE). This low tax/GDP ratio has
been a central feature of India's fiscal problem. It determines what part of GDP the government is keeping
with itself, as tax.
Expenditures of Government are generally sticky. A significant part of the expenditure, particularly interest
payments; pay and allowances; transfers to the States and Union Territories are committed, and there is very
little possibility of their compression in the short run.
Approach to Fiscal Consolidation
The approach to fiscal consolidation was,
therefore, largely revenue-led, though an
attempt was made to balance it by
emphasising outcomes of expenditure.
Budget for 2006-07, continuing with this
revenue-led strategy, estimated a growth
of 15.8% in revenue receipts over 2005-
06 (RE), composed of 19.4% growth in
tax revenue accruing to the Central
Government and 2.6% growth in non-
tax revenues.. On the Expenditure side,
there has been a considerable decrease in
growth rates of planned expenditure as
well as subsidies. Non planned
expenditure rose by only 4.7% as against
13.1% in the previous year. Growth in
Subsidies fell to 9.26% as compared to
26.4% in the previous year.
Economy-Industry Linkage
Source: rbi.org.in
9.2 9.8 10.3
11.4
0
2
4
6
8
10
12
2003-04 2004-05 2005-06 2006-07
%toGDP
Period
Gross tax revenue to GDP
Type of Linkage
Economy and Industry as a whole are inter-linked with the performance of one bearing an impact on the
other. Whereas industry performance regarding multiple aspects (Revenues earned, Productivity etc)
considered then and there could be concurrent or reverse impact.
These can be:
 Lead
 Lag
 Concurrent
Linkage Indicators
There are many indicators that link the prospects between economy and industry. A few are mentioned
below-
Cash Reserve Ratio (CRR)
CRR is one among the inflation regulatory tool adopted by RBI in its monetary policy. When RBI wants to
curb inflation it increases the CRR so that money can be squeezed from the economy and vice versa. Increase
in inflation reduces the credit availability with the banks thereby reducing the pumping of money into the
Types of Indicator Indicators Industries
Lead  Order Book Position
 New Company formation
 Financial surplus/deficit of industrial and
commercial companies
 Building permits for new private housing units
 Index of Stock Prices
 Production, Raw material prices
 Money Supply, Deposit, Inverted yield curve
 Exports
 Change in consumers' outstanding borrowing
Engineering,
Construction,
Equity,
Cement,
Steel and iron,
Lag  Interest rate spread
 Unemployment Rate
 Ratio, Manufacturing and trade inventories to
 Commercial and industrial loans outstanding
 Ratio of consumer installment credit to
personal income
 Change in CPI for services
Consumer
durables,
Housing,
Automobile,
FMCG
Concurrent  Real GDP
 Real Non-Agricultural GDP
 Employees on non-agricultural payrolls
 Personal income less transfer payments
 Index of industrial production
 Manufacturing and trade sales
IT,
Telecom
Banking,
Insurance,
Health care
economy. An increase in CRR increases the interest rates thereby an increase in CRR up to 7% by RBI has
resulted in an increase in interest rate of around 100 to 150 basis points.
Impact on the banking sector, Housing, Consumer durables and Automobile
An increase in the CRR has affected the profitability of the banks. This is due to the fact that a hike in CRR
increases the interest rate thereby increasing the cost of borrowing and leading to decrease in the number of
borrowers. Moreover it also weakens the bank stocks. Almost 70% of the total automobile’s sales, 80% of
housing sales and 60% of consumer durables sales is comes through finance and loans. So if there is any
change in the interest rate directly affect the automobile, housing and consumer durable industries incentives.
Statutory Liquidity Ratio (SLR)
SLR is the percentage of demand and time liabilities that a bank should maintain in the form of cash, gold or
approved securities. It is also one among the anti inflationary measure adopted by RBI in its monetary policy.
Over the past ten years, SLR has fallen and now it is fixed by RBI at 25%.
Impact on the banking sector:
As regards with SLR, a rise in this ratio also affects the interest rates not because of the fact that the credit
availability with the banks gets reduced but because of the banks’ investment in gilt edged securities of
government. The more the government borrows the more will be the investment and interest rates and vice
versa.
Bank rate
Bank rate is the rate at which the central bank provides loans to commercial banks. Bank rate is one of the
anti inflationary measures adopted by RBI. In order to curb inflation an increase in bank rate is adopted and
vice versa. At present the bank rate is 6%.
Impact on banking sector:
An increase in the bank rate would increase the lending rates of banks as well thereby reducing the demand
for the types of loans availed by the customers thereby having a negative impact on bank’s profitability.
Repo rate
Repo rate is the rate at which the banks borrow from the RBI. Usually it is fixed at a particular rate which acts
as a base rate for all rates. Currently, Repo rate is 7.75%.An increase or decrease in Repo rates will have an
impact on the bank rate. If the Repo rate is reduced the bank rate will also be reduced and vice versa.
A cut in the bank rate could set off a series of rate reduction on fixed-income instruments. Banks, for
instance, will lower the interest rate on their fixed-deposits. There could also be a small reduction in the loan
rates they offer companies. This would prompt companies to lower interest rates offered on fresh retail bond
offers. The Repo rate has a direct bearing on the overnight or the call money market
Economy & Capital Markets
GDP, Market Capitalisation & P/E Ratio
GDP (Gross Domestic Product) gives a real
value of Industrial productivity and their
services. GDP is a means by which
production performance of various industries
can be evaluated. Higher GDP growth rate
gives higher confidence on the performance
of industries increasing the level of expected
returns. Higher expectation on the returns
attracts investments heavily resulting in the
growth of market capitalization. P/E ratio of
the market shows the relative movement of
the GDP and market capitalization
Reasons for low P/E growth
An increase in the number of FIIs and Mutual Funds investments has created more liquidity. Hence there is
more demand for stocks resulting in the increase in their respective market values. But on the other hand
these stocks are constantly providing good returns to the investors. A handful of companies account for a
larger share of market capitalization in India. Intrinsic values of these companies are much less than that
reflected in their market capitalisation. Companies are making better profit after tax. So, earning per share is
also increasing and it makes the P/E at the same level or just a low growth. Thus we can say that increase in
both the market value and earning per share is nullifying the P/E ratio and results a lower growth.
The tax GDP ratio of the Centre has steadily risen from 8.8% in 2002-03 to 10.3% in 2005-06 and was 11.2%
in 2006-07. If there is an increase in Tax-GDP ratio, then the profitability of the industries will decrease as
they’ll have less amount of money for their expansion. This will effect the industrial growth. It’ll come down.
Industries will be forced to increase the prices of their products, which will lead to a rise in the inflation rate.
Comparison with emerging & developed world
Foreign Trade
India has emerged as the fastest growing nation in the global services trade and contrary to popular belief, the
country’s import growth in commercial services has outpaced exports in 2006.
Against the world average of 10%, India’s services imports grew by a hefty 40% in 2006 while exports
jumped by 34.3%, thus emerging as the most dynamic country in services trade. Ranked at the 10th
position,
the country’s services exports totaled USUS$73 billion while imports were only a shade below at USUS$70
billion with the global ranking of 12. In goods trade, India ranked ad the 17th
largest importer and 28th
as
exporter. India is growing at an impressive rate in both exports and imports of services amid stagnant global
trend. The country’s share in both global services exports and imports is 2.7%.
Source: www.rbi.org.in
-20
0
20
40
60
80
100
120
2003-04 2004-05 2005-06 2006-07
Growth(%)
GDP Vs Market Capitalization & P/E Ratio
Market Capitalization P/E Ratio GDP
0
2
4
6
8
10
12
2004 2005 2006 2007
Percentage
Years
Growth Rateof EmergingEconomies
U.K. Brazil China India United States Russia
Source: IMF
India & China leads the growth rate among world Economies
The graph shows the GDP growth rate over
the past few years of BRIC nations along
with US and UK. The unprecedented growth
in china is due to strong infrastructure facility
available where the development started a
decade ago. It has allowed 100% FDI
investment for all the sectors. On the other
hand the infrastructure facility in India has
just started recently. The Developed
economies like US and UK has stagnant
growth, mainly due to market reaching a
peak. The other economies like Russia have a
very high Inflation rate even though they
have high growth rate as compared to other
economies.
Indian and Chinese economies are the ones
which are looked upon in the world, the
Indian economy is revolving around the
banking system, and unlike China whose
growth is contributed to other factor like FDI
investments which are three time that of India.

More Related Content

What's hot

Macroeconomic environment of Nepal 2017
Macroeconomic environment of Nepal 2017Macroeconomic environment of Nepal 2017
Macroeconomic environment of Nepal 2017Upama Rai
 
The performance of manufacturing sector and utilization capacity in nigeria
The performance of manufacturing sector and utilization capacity in nigeriaThe performance of manufacturing sector and utilization capacity in nigeria
The performance of manufacturing sector and utilization capacity in nigeriaorlhawahlay
 
(E1915) State Of Industry
(E1915) State Of Industry(E1915) State Of Industry
(E1915) State Of IndustryAmanda Meth
 
Cement report
Cement reportCement report
Cement reportsamrv411
 
Effect of international trade on economic growth in kenya
Effect of international trade on economic growth in kenyaEffect of international trade on economic growth in kenya
Effect of international trade on economic growth in kenyaAlexander Decker
 
Afghanistan economic 2012
Afghanistan economic 2012Afghanistan economic 2012
Afghanistan economic 2012Mazloomyar
 
U.S. employment update and outlook: October 2014
U.S. employment update and outlook: October 2014U.S. employment update and outlook: October 2014
U.S. employment update and outlook: October 2014JLL
 
Indian Macroeconomics
Indian MacroeconomicsIndian Macroeconomics
Indian MacroeconomicsCitizenjourno
 
Impact of covid on various sectors of economy
Impact of covid on various sectors of economyImpact of covid on various sectors of economy
Impact of covid on various sectors of economyDivyanshuKumarsingh4
 
Economic Condition of Bangladesh
Economic Condition of BangladeshEconomic Condition of Bangladesh
Economic Condition of BangladeshAtaus Salam Shourav
 
Malaysia macroeconomic view
Malaysia macroeconomic viewMalaysia macroeconomic view
Malaysia macroeconomic viewDhiraj bonda
 
Geonesis July 2018
Geonesis July 2018Geonesis July 2018
Geonesis July 2018Lijin Sunil
 
IRJET - India Economy in the Beginning of 21th Century
IRJET -  	  India Economy in the Beginning of 21th CenturyIRJET -  	  India Economy in the Beginning of 21th Century
IRJET - India Economy in the Beginning of 21th CenturyIRJET Journal
 
Economic aspect India 2020
Economic aspect  India 2020 Economic aspect  India 2020
Economic aspect India 2020 Sushovit Rout
 
Working capital management and the performance of selected quoted manufacturi...
Working capital management and the performance of selected quoted manufacturi...Working capital management and the performance of selected quoted manufacturi...
Working capital management and the performance of selected quoted manufacturi...Alexander Decker
 

What's hot (20)

Macroeconomic environment of Nepal 2017
Macroeconomic environment of Nepal 2017Macroeconomic environment of Nepal 2017
Macroeconomic environment of Nepal 2017
 
The performance of manufacturing sector and utilization capacity in nigeria
The performance of manufacturing sector and utilization capacity in nigeriaThe performance of manufacturing sector and utilization capacity in nigeria
The performance of manufacturing sector and utilization capacity in nigeria
 
Infrastructural Decay in Sub-Saharan Africa: Evidence from the Nigerian Manuf...
Infrastructural Decay in Sub-Saharan Africa: Evidence from the Nigerian Manuf...Infrastructural Decay in Sub-Saharan Africa: Evidence from the Nigerian Manuf...
Infrastructural Decay in Sub-Saharan Africa: Evidence from the Nigerian Manuf...
 
Mets 2010 Indicus - MaFoi Randstad
Mets 2010 Indicus - MaFoi RandstadMets 2010 Indicus - MaFoi Randstad
Mets 2010 Indicus - MaFoi Randstad
 
(E1915) State Of Industry
(E1915) State Of Industry(E1915) State Of Industry
(E1915) State Of Industry
 
Cement report
Cement reportCement report
Cement report
 
Effect of international trade on economic growth in kenya
Effect of international trade on economic growth in kenyaEffect of international trade on economic growth in kenya
Effect of international trade on economic growth in kenya
 
Afghanistan economic 2012
Afghanistan economic 2012Afghanistan economic 2012
Afghanistan economic 2012
 
U.S. employment update and outlook: October 2014
U.S. employment update and outlook: October 2014U.S. employment update and outlook: October 2014
U.S. employment update and outlook: October 2014
 
Indian Macroeconomics
Indian MacroeconomicsIndian Macroeconomics
Indian Macroeconomics
 
Impact of covid on various sectors of economy
Impact of covid on various sectors of economyImpact of covid on various sectors of economy
Impact of covid on various sectors of economy
 
India & China
India & ChinaIndia & China
India & China
 
Economic Condition of Bangladesh
Economic Condition of BangladeshEconomic Condition of Bangladesh
Economic Condition of Bangladesh
 
Malaysia macroeconomic view
Malaysia macroeconomic viewMalaysia macroeconomic view
Malaysia macroeconomic view
 
Geonesis July 2018
Geonesis July 2018Geonesis July 2018
Geonesis July 2018
 
ado 2008
ado 2008ado 2008
ado 2008
 
IRJET - India Economy in the Beginning of 21th Century
IRJET -  	  India Economy in the Beginning of 21th CenturyIRJET -  	  India Economy in the Beginning of 21th Century
IRJET - India Economy in the Beginning of 21th Century
 
Economy of bangladeh
Economy of bangladehEconomy of bangladeh
Economy of bangladeh
 
Economic aspect India 2020
Economic aspect  India 2020 Economic aspect  India 2020
Economic aspect India 2020
 
Working capital management and the performance of selected quoted manufacturi...
Working capital management and the performance of selected quoted manufacturi...Working capital management and the performance of selected quoted manufacturi...
Working capital management and the performance of selected quoted manufacturi...
 

Similar to Economic analysis

Consulting club presents 'The Indian Econonmic Outlook'
Consulting club presents 'The Indian Econonmic Outlook'Consulting club presents 'The Indian Econonmic Outlook'
Consulting club presents 'The Indian Econonmic Outlook'Consultancyscmhrd
 
India macroeconomy
India macroeconomyIndia macroeconomy
India macroeconomygarimayadav7
 
DECIPHERING THE DYNAMICS OF INDIAN GROWTH- INDIAN ECONOMY.pptx
DECIPHERING THE DYNAMICS OF INDIAN GROWTH- INDIAN ECONOMY.pptxDECIPHERING THE DYNAMICS OF INDIAN GROWTH- INDIAN ECONOMY.pptx
DECIPHERING THE DYNAMICS OF INDIAN GROWTH- INDIAN ECONOMY.pptxPearlShell2
 
AUGUST IIP NUMBER BEATS SLOWDOWN SPECIAL REPORT
 AUGUST IIP NUMBER BEATS SLOWDOWN SPECIAL REPORT AUGUST IIP NUMBER BEATS SLOWDOWN SPECIAL REPORT
AUGUST IIP NUMBER BEATS SLOWDOWN SPECIAL REPORTequityreport11
 
State of the Economy in 2018-19: A Macro View
State of the Economy in 2018-19: A Macro ViewState of the Economy in 2018-19: A Macro View
State of the Economy in 2018-19: A Macro ViewDVSResearchFoundatio
 
Indian cement industry report
Indian cement industry report Indian cement industry report
Indian cement industry report js slides
 
GDP & Comms (Mar Qtr 2016) - June 2016
GDP & Comms (Mar Qtr 2016) - June 2016GDP & Comms (Mar Qtr 2016) - June 2016
GDP & Comms (Mar Qtr 2016) - June 2016Mark Kooymans (M.Econ)
 
Eco 8th Lecture[1]
Eco 8th Lecture[1]Eco 8th Lecture[1]
Eco 8th Lecture[1]dimplenift
 
The_indicators_OF_Indian_Economy_PPT_at.ppt
The_indicators_OF_Indian_Economy_PPT_at.pptThe_indicators_OF_Indian_Economy_PPT_at.ppt
The_indicators_OF_Indian_Economy_PPT_at.pptNidhiSingh239244
 
Government Capital Expenditure and Manufacturing Sector Output in Nigeria
Government Capital Expenditure and Manufacturing Sector Output in NigeriaGovernment Capital Expenditure and Manufacturing Sector Output in Nigeria
Government Capital Expenditure and Manufacturing Sector Output in Nigeriaijtsrd
 
Indian cement industry report
Indian cement industry reportIndian cement industry report
Indian cement industry reportshonethattil
 
Indian cement industry report
Indian cement industry reportIndian cement industry report
Indian cement industry reportshonethattil
 

Similar to Economic analysis (20)

Consulting club presents 'The Indian Econonmic Outlook'
Consulting club presents 'The Indian Econonmic Outlook'Consulting club presents 'The Indian Econonmic Outlook'
Consulting club presents 'The Indian Econonmic Outlook'
 
India macroeconomy
India macroeconomyIndia macroeconomy
India macroeconomy
 
DECIPHERING THE DYNAMICS OF INDIAN GROWTH- INDIAN ECONOMY.pptx
DECIPHERING THE DYNAMICS OF INDIAN GROWTH- INDIAN ECONOMY.pptxDECIPHERING THE DYNAMICS OF INDIAN GROWTH- INDIAN ECONOMY.pptx
DECIPHERING THE DYNAMICS OF INDIAN GROWTH- INDIAN ECONOMY.pptx
 
Pak industries
Pak  industriesPak  industries
Pak industries
 
Pak industries
Pak  industriesPak  industries
Pak industries
 
Industry and Infrastructure
Industry and InfrastructureIndustry and Infrastructure
Industry and Infrastructure
 
AUGUST IIP NUMBER BEATS SLOWDOWN SPECIAL REPORT
 AUGUST IIP NUMBER BEATS SLOWDOWN SPECIAL REPORT AUGUST IIP NUMBER BEATS SLOWDOWN SPECIAL REPORT
AUGUST IIP NUMBER BEATS SLOWDOWN SPECIAL REPORT
 
State of the Economy in 2018-19: A Macro View
State of the Economy in 2018-19: A Macro ViewState of the Economy in 2018-19: A Macro View
State of the Economy in 2018-19: A Macro View
 
Indian cement industry report
Indian cement industry report Indian cement industry report
Indian cement industry report
 
Growth and investment
Growth and investmentGrowth and investment
Growth and investment
 
The organized sector in India created 346,000 jobs
The organized sector in India created 346,000 jobs The organized sector in India created 346,000 jobs
The organized sector in India created 346,000 jobs
 
GDP & Comms (Mar Qtr 2016) - June 2016
GDP & Comms (Mar Qtr 2016) - June 2016GDP & Comms (Mar Qtr 2016) - June 2016
GDP & Comms (Mar Qtr 2016) - June 2016
 
Russia
RussiaRussia
Russia
 
Lyes Boudiaf
Lyes Boudiaf Lyes Boudiaf
Lyes Boudiaf
 
Eco 8th Lecture[1]
Eco 8th Lecture[1]Eco 8th Lecture[1]
Eco 8th Lecture[1]
 
The_indicators_OF_Indian_Economy_PPT_at.ppt
The_indicators_OF_Indian_Economy_PPT_at.pptThe_indicators_OF_Indian_Economy_PPT_at.ppt
The_indicators_OF_Indian_Economy_PPT_at.ppt
 
Government Capital Expenditure and Manufacturing Sector Output in Nigeria
Government Capital Expenditure and Manufacturing Sector Output in NigeriaGovernment Capital Expenditure and Manufacturing Sector Output in Nigeria
Government Capital Expenditure and Manufacturing Sector Output in Nigeria
 
Indian cement industry report
Indian cement industry reportIndian cement industry report
Indian cement industry report
 
Indian cement industry report
Indian cement industry reportIndian cement industry report
Indian cement industry report
 
Construction industry
Construction industryConstruction industry
Construction industry
 

Recently uploaded

Log your LOA pain with Pension Lab's brilliant campaign
Log your LOA pain with Pension Lab's brilliant campaignLog your LOA pain with Pension Lab's brilliant campaign
Log your LOA pain with Pension Lab's brilliant campaignHenry Tapper
 
Financial institutions facilitate financing, economic transactions, issue fun...
Financial institutions facilitate financing, economic transactions, issue fun...Financial institutions facilitate financing, economic transactions, issue fun...
Financial institutions facilitate financing, economic transactions, issue fun...Avanish Goel
 
Chapter 2.ppt of macroeconomics by mankiw 9th edition
Chapter 2.ppt of macroeconomics by mankiw 9th editionChapter 2.ppt of macroeconomics by mankiw 9th edition
Chapter 2.ppt of macroeconomics by mankiw 9th editionMuhammadHusnain82237
 
Monthly Market Risk Update: April 2024 [SlideShare]
Monthly Market Risk Update: April 2024 [SlideShare]Monthly Market Risk Update: April 2024 [SlideShare]
Monthly Market Risk Update: April 2024 [SlideShare]Commonwealth
 
20240417-Calibre-April-2024-Investor-Presentation.pdf
20240417-Calibre-April-2024-Investor-Presentation.pdf20240417-Calibre-April-2024-Investor-Presentation.pdf
20240417-Calibre-April-2024-Investor-Presentation.pdfAdnet Communications
 
Unveiling the Top Chartered Accountants in India and Their Staggering Net Worth
Unveiling the Top Chartered Accountants in India and Their Staggering Net WorthUnveiling the Top Chartered Accountants in India and Their Staggering Net Worth
Unveiling the Top Chartered Accountants in India and Their Staggering Net WorthShaheen Kumar
 
government_intervention_in_business_ownership[1].pdf
government_intervention_in_business_ownership[1].pdfgovernment_intervention_in_business_ownership[1].pdf
government_intervention_in_business_ownership[1].pdfshaunmashale756
 
Interimreport1 January–31 March2024 Elo Mutual Pension Insurance Company
Interimreport1 January–31 March2024 Elo Mutual Pension Insurance CompanyInterimreport1 January–31 March2024 Elo Mutual Pension Insurance Company
Interimreport1 January–31 March2024 Elo Mutual Pension Insurance CompanyTyöeläkeyhtiö Elo
 
How Automation is Driving Efficiency Through the Last Mile of Reporting
How Automation is Driving Efficiency Through the Last Mile of ReportingHow Automation is Driving Efficiency Through the Last Mile of Reporting
How Automation is Driving Efficiency Through the Last Mile of ReportingAggregage
 
Instant Issue Debit Cards - High School Spirit
Instant Issue Debit Cards - High School SpiritInstant Issue Debit Cards - High School Spirit
Instant Issue Debit Cards - High School Spiritegoetzinger
 
Andheri Call Girls In 9825968104 Mumbai Hot Models
Andheri Call Girls In 9825968104 Mumbai Hot ModelsAndheri Call Girls In 9825968104 Mumbai Hot Models
Andheri Call Girls In 9825968104 Mumbai Hot Modelshematsharma006
 
(DIYA) Bhumkar Chowk Call Girls Just Call 7001035870 [ Cash on Delivery ] Pun...
(DIYA) Bhumkar Chowk Call Girls Just Call 7001035870 [ Cash on Delivery ] Pun...(DIYA) Bhumkar Chowk Call Girls Just Call 7001035870 [ Cash on Delivery ] Pun...
(DIYA) Bhumkar Chowk Call Girls Just Call 7001035870 [ Cash on Delivery ] Pun...ranjana rawat
 
BPPG response - Options for Defined Benefit schemes - 19Apr24.pdf
BPPG response - Options for Defined Benefit schemes - 19Apr24.pdfBPPG response - Options for Defined Benefit schemes - 19Apr24.pdf
BPPG response - Options for Defined Benefit schemes - 19Apr24.pdfHenry Tapper
 
Russian Call Girls In Gtb Nagar (Delhi) 9711199012 💋✔💕😘 Naughty Call Girls Se...
Russian Call Girls In Gtb Nagar (Delhi) 9711199012 💋✔💕😘 Naughty Call Girls Se...Russian Call Girls In Gtb Nagar (Delhi) 9711199012 💋✔💕😘 Naughty Call Girls Se...
Russian Call Girls In Gtb Nagar (Delhi) 9711199012 💋✔💕😘 Naughty Call Girls Se...shivangimorya083
 
Vip B Aizawl Call Girls #9907093804 Contact Number Escorts Service Aizawl
Vip B Aizawl Call Girls #9907093804 Contact Number Escorts Service AizawlVip B Aizawl Call Girls #9907093804 Contact Number Escorts Service Aizawl
Vip B Aizawl Call Girls #9907093804 Contact Number Escorts Service Aizawlmakika9823
 
High Class Call Girls Nashik Maya 7001305949 Independent Escort Service Nashik
High Class Call Girls Nashik Maya 7001305949 Independent Escort Service NashikHigh Class Call Girls Nashik Maya 7001305949 Independent Escort Service Nashik
High Class Call Girls Nashik Maya 7001305949 Independent Escort Service NashikCall Girls in Nagpur High Profile
 
Lundin Gold April 2024 Corporate Presentation v4.pdf
Lundin Gold April 2024 Corporate Presentation v4.pdfLundin Gold April 2024 Corporate Presentation v4.pdf
Lundin Gold April 2024 Corporate Presentation v4.pdfAdnet Communications
 
VIP Call Girls Service Begumpet Hyderabad Call +91-8250192130
VIP Call Girls Service Begumpet Hyderabad Call +91-8250192130VIP Call Girls Service Begumpet Hyderabad Call +91-8250192130
VIP Call Girls Service Begumpet Hyderabad Call +91-8250192130Suhani Kapoor
 

Recently uploaded (20)

Commercial Bank Economic Capsule - April 2024
Commercial Bank Economic Capsule - April 2024Commercial Bank Economic Capsule - April 2024
Commercial Bank Economic Capsule - April 2024
 
Log your LOA pain with Pension Lab's brilliant campaign
Log your LOA pain with Pension Lab's brilliant campaignLog your LOA pain with Pension Lab's brilliant campaign
Log your LOA pain with Pension Lab's brilliant campaign
 
Financial institutions facilitate financing, economic transactions, issue fun...
Financial institutions facilitate financing, economic transactions, issue fun...Financial institutions facilitate financing, economic transactions, issue fun...
Financial institutions facilitate financing, economic transactions, issue fun...
 
Chapter 2.ppt of macroeconomics by mankiw 9th edition
Chapter 2.ppt of macroeconomics by mankiw 9th editionChapter 2.ppt of macroeconomics by mankiw 9th edition
Chapter 2.ppt of macroeconomics by mankiw 9th edition
 
Monthly Market Risk Update: April 2024 [SlideShare]
Monthly Market Risk Update: April 2024 [SlideShare]Monthly Market Risk Update: April 2024 [SlideShare]
Monthly Market Risk Update: April 2024 [SlideShare]
 
20240417-Calibre-April-2024-Investor-Presentation.pdf
20240417-Calibre-April-2024-Investor-Presentation.pdf20240417-Calibre-April-2024-Investor-Presentation.pdf
20240417-Calibre-April-2024-Investor-Presentation.pdf
 
Unveiling the Top Chartered Accountants in India and Their Staggering Net Worth
Unveiling the Top Chartered Accountants in India and Their Staggering Net WorthUnveiling the Top Chartered Accountants in India and Their Staggering Net Worth
Unveiling the Top Chartered Accountants in India and Their Staggering Net Worth
 
government_intervention_in_business_ownership[1].pdf
government_intervention_in_business_ownership[1].pdfgovernment_intervention_in_business_ownership[1].pdf
government_intervention_in_business_ownership[1].pdf
 
Interimreport1 January–31 March2024 Elo Mutual Pension Insurance Company
Interimreport1 January–31 March2024 Elo Mutual Pension Insurance CompanyInterimreport1 January–31 March2024 Elo Mutual Pension Insurance Company
Interimreport1 January–31 March2024 Elo Mutual Pension Insurance Company
 
How Automation is Driving Efficiency Through the Last Mile of Reporting
How Automation is Driving Efficiency Through the Last Mile of ReportingHow Automation is Driving Efficiency Through the Last Mile of Reporting
How Automation is Driving Efficiency Through the Last Mile of Reporting
 
Instant Issue Debit Cards - High School Spirit
Instant Issue Debit Cards - High School SpiritInstant Issue Debit Cards - High School Spirit
Instant Issue Debit Cards - High School Spirit
 
Andheri Call Girls In 9825968104 Mumbai Hot Models
Andheri Call Girls In 9825968104 Mumbai Hot ModelsAndheri Call Girls In 9825968104 Mumbai Hot Models
Andheri Call Girls In 9825968104 Mumbai Hot Models
 
(DIYA) Bhumkar Chowk Call Girls Just Call 7001035870 [ Cash on Delivery ] Pun...
(DIYA) Bhumkar Chowk Call Girls Just Call 7001035870 [ Cash on Delivery ] Pun...(DIYA) Bhumkar Chowk Call Girls Just Call 7001035870 [ Cash on Delivery ] Pun...
(DIYA) Bhumkar Chowk Call Girls Just Call 7001035870 [ Cash on Delivery ] Pun...
 
BPPG response - Options for Defined Benefit schemes - 19Apr24.pdf
BPPG response - Options for Defined Benefit schemes - 19Apr24.pdfBPPG response - Options for Defined Benefit schemes - 19Apr24.pdf
BPPG response - Options for Defined Benefit schemes - 19Apr24.pdf
 
Russian Call Girls In Gtb Nagar (Delhi) 9711199012 💋✔💕😘 Naughty Call Girls Se...
Russian Call Girls In Gtb Nagar (Delhi) 9711199012 💋✔💕😘 Naughty Call Girls Se...Russian Call Girls In Gtb Nagar (Delhi) 9711199012 💋✔💕😘 Naughty Call Girls Se...
Russian Call Girls In Gtb Nagar (Delhi) 9711199012 💋✔💕😘 Naughty Call Girls Se...
 
Vip B Aizawl Call Girls #9907093804 Contact Number Escorts Service Aizawl
Vip B Aizawl Call Girls #9907093804 Contact Number Escorts Service AizawlVip B Aizawl Call Girls #9907093804 Contact Number Escorts Service Aizawl
Vip B Aizawl Call Girls #9907093804 Contact Number Escorts Service Aizawl
 
High Class Call Girls Nashik Maya 7001305949 Independent Escort Service Nashik
High Class Call Girls Nashik Maya 7001305949 Independent Escort Service NashikHigh Class Call Girls Nashik Maya 7001305949 Independent Escort Service Nashik
High Class Call Girls Nashik Maya 7001305949 Independent Escort Service Nashik
 
🔝+919953056974 🔝young Delhi Escort service Pusa Road
🔝+919953056974 🔝young Delhi Escort service Pusa Road🔝+919953056974 🔝young Delhi Escort service Pusa Road
🔝+919953056974 🔝young Delhi Escort service Pusa Road
 
Lundin Gold April 2024 Corporate Presentation v4.pdf
Lundin Gold April 2024 Corporate Presentation v4.pdfLundin Gold April 2024 Corporate Presentation v4.pdf
Lundin Gold April 2024 Corporate Presentation v4.pdf
 
VIP Call Girls Service Begumpet Hyderabad Call +91-8250192130
VIP Call Girls Service Begumpet Hyderabad Call +91-8250192130VIP Call Girls Service Begumpet Hyderabad Call +91-8250192130
VIP Call Girls Service Begumpet Hyderabad Call +91-8250192130
 

Economic analysis

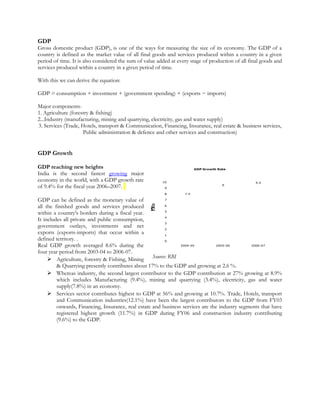
  • 1. GDP Gross domestic product (GDP), is one of the ways for measuring the size of its economy. The GDP of a country is defined as the market value of all final goods and services produced within a country in a given period of time. It is also considered the sum of value added at every stage of production of all final goods and services produced within a country in a given period of time. With this we can derive the equation: GDP = consumption + investment + (government spending) + (exports − imports) Major components- 1. Agriculture (forestry & fishing) 2...Industry (manufacturing, mining and quarrying, electricity, gas and water supply) 3. Services (Trade, Hotels, transport & Communication, Financing, Insurance, real estate & business services, Public administration & defence and other services and construction) GDP Growth GDP reaching new heights India is the second fastest growing major economy in the world, with a GDP growth rate of 9.4% for the fiscal year 2006–2007. GDP can be defined as the monetary value of all the finished goods and services produced within a country's borders during a fiscal year. It includes all private and public consumption, government outlays, investments and net exports (exports-imports) that occur within a defined territory. . Real GDP growth averaged 8.6% during the four year period from 2003-04 to 2006-07.  Agriculture, forestry & Fishing, Mining & Quarrying presently contributes about 17% to the GDP and growing at 2.6 %.  Whereas industry, the second largest contributor to the GDP contribution at 27% growing at 8.9% which includes Manufacturing (9.4%), mining and quarrying (3.4%), electricity, gas and water supply(7.8%) in an economy.  Services sector contributes highest to GDP at 56% and growing at 10.7%. Trade, Hotels, transport and Communication industries(12.1%) have been the largest contributors to the GDP from FY03 onwards, Financing, Insurance, real estate and business services are the industry segments that have registered highest growth (11.7%) in GDP during FY06 and construction industry contributing (9.6%) to the GDP. 7.5 9 9.4 0 1 2 3 4 5 6 7 8 9 10 2004-05 2005-06 2006-07 in% GDP Growth Rate Source: RBI
  • 2. Sectors contribution to GDP Agriculture Sector Agriculture Sector growth hampered by uneven distribution of rain .The contribution of the agricultural sector to GDP has declined from 19.7% in the year 2005-06 to 17% in the year 2006-07. Growth rate of the agriculture sector is lagging in compare to their peer sectors. ‘Agriculture and allied activities’ growth slowed down from 6.0 per cent in 2005-06 to 2.7 per cent in 2006-07. But there not had seen any shortage in the production of food grain and the area covered in year 2006-07, in compare to previous year the total food grain production is increased by 11.4 million tones. This falling contribution to GDP has been a matter of concern, the reasons being • Uneven distribution of rainfall and falling water levels • Inadequate adoption of modern agricultural practices and use of technology • Conversion of agricultural land to SEZs, and their urbanization • inadequate or inefficient finance and marketing services for farm produce and produce that do not meet international standards • Underdeveloped Infrastructure facilities. • Low quality seeds. Industrial Sector Industrial Sector backed by manufacturing sector The over-all industrial growth for the first quarter of 2007-08 is 11.7% as compared to 11.5% during 2006-07 and 8.2% in 2005-06. The manufacturing sector grew by 12.3 per cent during April-March 2006-07 when compared to 11.3%. It remained the key driver of industrial growth. The manufacturing sector with double digit growth 10.9% continued to be the key driver of industrial activity, contributing almost 92.5% of the growth in industry. The growth of manufacturing sector is backed by the strong demand of “machinery and equipments”, “basic metal and alloy industry”. The capital goods sector maintained its growth momentum (18.3 per cent during April-March 2006-07 as compared with 16.3 per cent a year ago) on the back of strong investment demand. It is mainly benefited from growth in agricultural implements, boilers, diesel engines, insulated cable wires, computer systems and their peripherals. Mining and electricity sectors too pushed the overall industrial growth posting a high growth of 5.1% and 7.2% in 2006-07 0 5 10 15 Mining Manufacturing Elctricity in% Major Industrial Sector Growth 2005-06 2006-07 Source: RBI Publications Industry wise growth 5.5 5.9 10.4 -0.3 12.6 9.4 7.2 9 0.7 10.1 -0.1 15 7.4 8.1 -2 0 2 4 6 8 10 12 14 16 Electricity coal Finishedsteel crude petroleum petroleumref. products cement overall infrastructure percent Apr-May 06 Apr-May07 Source: RBI Publications
  • 3. respectively as against the 1.0% and 5.3% growth respectively in 2005-06. Basic goods and intermediate goods sectors recorded growth of 10.3 per cent and 11.9 per cent, respectively - the highest growth rates since 1995-96 - spurred by higher production of cement, high speed diesel, iron and steel products, polyester fiber, viscose staple fiber Growth in consumer goods sector, both durables and non-durables, decelerated. Decline in production of some food products and a few drugs contributed to the lower growth in consumer non-durables. Services Sector Largest contributor to the GDP The Key driver of this year’s GDP growth rate has been the Service sector contributing a little over 55.1% to the GDP with double-digit growth has further strengthened its place as the leading sector of the Indian economy. The services sector, with a growth rate of 11.0 per cent as compared with 10.3 per cent a year ago, continued to be the key driver of economic activity. ‘Trade, hotels, transport and communication’(13.0%) and ‘financing, insurance, real estate and business services’(10.6%) registered double-digit growth rates, offsetting the deceleration in ‘construction’(currently 10.7%). The IT/ITES contributes to India's GDP from 1.2% during 1999-2000 to 5.4% in 2006-07. The tourism industry also made a remarkable growth. However, there is still huge scope for improvement including the tourism industry. The total foreign exchange earnings during January- May 2007 stood at USUS$ 3071.34 million against USUS$ 2616.24 million for the same period in 2006. Financing, insurance, real estate and business services is supported by acceleration of growth in bank deposits, sustained growth in non-food credit and continued buoyancy in business process outsourcing and information technology-enabled services exports. Index of industrial Production (IIP) Index of Industrial Production is an economic indicator that gives real production output of a country. This index gives the idea about the performance of the industry and the type of returns that can be expected as an investor. The index of Industrial production (IIP) is an indicator to measure the changes in the physical volume of the output of Industrial sector. The General Index stands at 264.2, which is 11.1% higher as compared to the level in the month of May 2006. The cumulative growth for the period April-May 2007-08 stands at 11.7% over the corresponding period of the pervious year .IIP-General Index had its seasonal peak of 108.0 in March and trough of 95.8 in April. This seasonal peak of IIP-General Index in March had remained same over the years, but the trough varied in the months of April, June and September. Capital goods fuels IIP Index Capital goods have to a great extent contributed to the rise of the IIP. The industries in the year 2006-07 have concentrated on Capacity expansion. Capital goods recorded a growth rate of 17.7% in the FY06-07. Source: RBI Publications 0 500 1000 1500 2000 1999- 00 2000- 01 2001- 02 2002- 03 2003- 04 2004- 05 2005- 06 2006- 07 Index(Base100) Index of Industrial Production Basic Goods Capital Goods Consumer Goods Electricity IIP General Index IntermediateGoods Manufacturing Mining & Quarrying
  • 4. Growth of Manufacturing sector 0 5 10 15 20 25 Basic Goods Capital Goods Consumer Goods Intermediate Goods Years Growth% 2004-05 2005-06 2006-07 www.rbi.org.in Manufacturing Sector’s contribution to the IIP The Manufacturing industry has been suffering due to obsolete technology and ageing machinery. However, the introduction of FDIs in the sector has not only increased the productivity in the industry but also enabled exports from the sector. This growth has happened mainly because of the growth in mining, manufacturing and electricity with corresponding growth rate of 3.7%, 11.9% and 9.4% respectively. Basic goods and intermediate goods sectors recorded growth of 10.3 % and 11.9 %, respectively - the highest growth rates since 1995-96 - spurred by higher production of cement, high speed diesel, iron and steel products, polyester fiber, viscose staple fiber Growth in consumer goods sector, both durables and non-durables, decelerated. The reason why capital goods’ growth has increased is because of the demand for infrastructural facility. Indian government is targeting the development of almost 350 non metro airports throughout the country. Because of this, there is a rise even for basic goods like cement and metals. External trade High growth in Non-POL have fuelled growth In 2006-07, the growth in export and import is one and the same. India’s balance of payments position has continued to remain comfortable during 2006-07. Merchandise exports recorded strong growth, but lower than last year. 14.05% in June 2007 from last year’s 18.07%. India’s merchandise exports during 2006-07 registered a growth of 20.9% as compared with 26.3% a year ago. Merchandise exports of the country surged to US$125 bn in the year ending March 2007 from US$63.84 bn three years ago. The contribution of services to exports stood at US$76bn. Out of the total services, software contributed US$31.4bn, engineering stood at US$24.9bn while, others contributed US$39.7bn. Merchandise contributed 62% to total export thus remaining the key growth driver. For the first quarter of the financial year 2007-08, the exports amounted US$34.3bn. Import & Export with growth rate 0 50 100 150 200 250 1999-00 2001-02 2003-04 2005-06 US$billion -10 0 10 20 30 40 50 %Rate Exports (LHS) Imports (LHS) % Change in Exports (RHS) % Change in Imports (RHS) ' Source: http://indiabudget.nic.in/
  • 5. India’s merchandise imports stood at US$181.37 bn with non-oil constituting US$124.1 bn and oil imports US$57.27 bn. Service imports touched US$71.64 bn in 2006- 07. India’s merchandise imports registered a growth of 21.6% during 2006-07 on top of 33.8% growth a year ago. During 2006-07, non-oil imports grew by 25.7% and accounted for almost 64% of the rise in total imports. For the first quarter of the financial year 2007- 08 the imports amounted to US$54.9bn whereas the oil imports amounted to US$14.83bn, the non-oil imports amounted to US$40bn. The trade deficit for the same period stood at US$20.6bn. Major contributor’s to GDP Software contributed 16% to the total exports. Personal & recreational services, banking and financial services registered an unbelievably high growth of 82.4%, 96.0% and 88.5% respectively. Imports on the other hand, accounted for US$185 billion, major imports being capital goods. The non-POL (petroleum, oil and lubricants) constitutes almost 78-80% of total imports and have registered a growth of 47% over the previous year. Major export and import partner The major part of the Indian export is shared by US (16.7%), UAE (8.5%), China (6.6%), Singapore (5.3%) and UK (4.9%) and the major items of export are Textiles goods, gems and jewellery, Engineering goods, chemicals and lather manufactures The major part of Indian import comes from China (7.3%), US (5.6%) and Switzerland (4.7%), the major items of Indian import are crude oil, machinery, gems, fertilizer and chemicals. Monetary Policy RBI’s Monetary Policy Plan for a growing economy Monetary policy is the process by which the government, central bank, or monetary authority manages the money supply to achieve specific goals like constraining inflation or deflation and maintaining an exchange rate. RBI, Indian Central bank and monetary authority announces its policy twice in a year and is reviewed on a regular basis. Continuing high levels of crude oil prices during the first half of the year and rising primary commodity prices in the international market impacted price developments in the domestic economy. Considering the emerging trends, the objectives and overall stance of policy announced by the RBI in its Annual Policy Statement for 2006-07 were: (i) to ensure a monetary and interest rate environment that enables continuation of the growth momentum consistent with price stability (ii) to focus on credit quality and financial market conditions to support export and investment demand in the economy for maintaining macroeconomic stability and, in particular, financial stability (iii) to respond swiftly to evolving global developments.
  • 6. Monthly Inflation rate 0 1 2 3 4 5 6 7 8 A pr M ay June July A ug S ep O ct N ov D ec Jan Feb M ar In% 2005-06 2006-07 Source: indiastat.com In view of the impact of the increases in key rates in the past year, the RBI has justifiably not tinkered with them this time around — Bank rate (6%), reverse repo rate (6%) and repo rate (7.75%) — to ensure that the growth momentum continues. On a review of the current liquidity situation, it is considered desirable to increase the CRR by 50 basis points to 7.0 per cent with effect from the fortnight beginning August 4, 2007 which will drain out around Rs16000 crore. This measure is expected to lift the overnight call money rates from below 1% levels prevailing for over two months to almost 6%. In view of the current macroeconomic and overall monetary and liquidity conditions, it has been decided to withdraw the ceiling of Rs. 3,000 crore on daily reverse repo under the LAF with effect from Monday, August 6, 2007. The Reserve Bank, however, retains the discretion to re-impose a ceiling as appropriate and has the flexibility to conduct repo/reverse repo auctions at a fixed rate or at variable rates as circumstances warrant. • Growth in non-food credit has remained above 30 percent; broad money growth was 19.0 percent, Reserve money growth was 20.4 per cent year-on-year (y-o-y) basis. • Listed Indian companies limit for portfolio investment in listed overseas companies enhanced to 35% of net worth • The overseas investment limit (total financial commitment) for Indian companies has been enhanced to 300% of their net worth. • The aggregate ceiling on overseas investment by mutual funds has been raised to US$4billion • Prepayment of External Commercial Borrowings(ECBs) without RBI approval has been increased to US$400 million. • Raising the limit for individuals for any permitted current or capital account transaction from US$50,000 to US$100,000 per financial year Major reason of inflation – Primary food items Inflation is the rate at which the general level of prices for goods and services are rising and subsequently increasing the purchasing power. Inflation has both positive and negative effect according to the range in which it operates Primary food articles prices have emerged as the key driver of inflation during 2006-07 so far. Pre-emptive monetary and fiscal measures have helped in containing inflationary expectations although underlying inflationary pressures remain. Taking into account the impact of real, monetary and global factors on domestic prices, the Reserve Bank in its Quarterly Policy Statement for 2007-08 (July 2007) noted that containing inflationary expectations would continue to pose a challenge to monetary management. Accordingly, holding headline inflation within 5.0 per cent in 2007-08 assumes priority in the policy hierarchy; while reinforcing the medium-term objective to condition policy and perceptions to reduce inflation to 4.0-4.5 per cent on a sustained basis. Interest Rate
  • 7. Source: rbi.org.in -200 -100 0 100 200 300 400 500 in Rs billion 2003-04 2004-05 2005-06 2006-07 India's Fiscal Deficit Revenue receipts Revenue expenditure Fiscal Deficit 10-year G-Sec interest Rate rise Interest rates are the rate of return on an investment in specific investment tools. The information given below gives the details of return (yield) on government securities. During the early part of 2006-07, yields on 10-year G-sec hardened further because of the following reasons:  a surge in the crude oil prices in the international market,  tightening of monetary policy in the US and other economies,  hike in domestic policy rates The 10 year G-sec rates peaked at 8.39% on July 11, 2006, and remained above 8.00 % up to August 23, 2006. It declined gradually to 7.38% on December 5, 2006 in consonance with a rally in the price of US bonds of similar maturity, following a pause in the US Federal funds rate hike and downward movement in the crude oil prices in the world markets. This softening trend was reversed thereafter and, with continued high growth in bank credit and the announcement on December 8, 2006 of hikes in the CRR by 25basis points each in two phases in the next 30 days to curb monetary accommodation of inflation, the yield started hardening. Yield increased from 7.39% on December 8, to 7.87% on January 23, 2007 and softened to 7.73% on January 31, 2007, before hardening again on February 14, 2007 to 8.08%. The yields on Government securities with 10-year and 20-year residual maturity also eased during this period from 7.97 per cent to 7.89 per cent and from 8.23 per cent to 8.21 per cent, respectively. Consequently, the yield spread between 10-year and one-year Government securities widened from 42 basis points to 105 basis points whereas the spread between 20-year and one-year Government securities widened from 68 basis points to 137 basis points over this period. Fiscal Policy Fiscal policy is the instrument by which a government adjusts its levels of spending in order to monitor a nation's economy. It is the sister strategy to monetary policy, with which a RBI influences a nation's money supply. These two policies are used in various combinations in an order to direct a country's economic goals.. Unproductive expenditure, tax distortions and high deficits are considered to have constrained the economy from realizing its full growth potential. The medium-term fiscal policy stance of Government, therefore, has been to reduce deficits; prioritize expenditure and ensure that these results in intended outcomes; and augment resources by widening the tax base and improving the Yeild on 10yr G-Sec Bonds 7.89 6.67 7.51 6 6.5 7 7.5 8 2004-05 2005-06 2006-07* In%age Source: rbi.org.in
  • 8. combined Deficit Indicators:Centre and States 0 2 4 6 8 10 12 2001-02 2002-03 2003-04 2004-05 2005-06 2006-07 fiscal deficit revenue deficit primary deficit Source: rbi.org.in compliance while maintaining moderate rates. The key fiscal indicators, viz., gross fiscal deficit (GFD), revenue deficit and primary deficit of combined finances of the Central and State Governments are budgeted to decline by 0.7-0.9 percentage points of GDP during 2007-08 over the revised estimates (RE) for 2006-07.. Tax to GDP Ratio The revenue deficit, primary deficit, fiscal deficit are at: 2.1%, 0.2% and 3.8%, respectively as a percentage of GDP.. The gross tax-GDP ratio, which had stagnated at 8-10 per cent range, increased to 10.3 per cent in 2005-06 and is expected to improve further to 10.8 per cent in 2006-07(BE). This low tax/GDP ratio has been a central feature of India's fiscal problem. It determines what part of GDP the government is keeping with itself, as tax. Expenditures of Government are generally sticky. A significant part of the expenditure, particularly interest payments; pay and allowances; transfers to the States and Union Territories are committed, and there is very little possibility of their compression in the short run. Approach to Fiscal Consolidation The approach to fiscal consolidation was, therefore, largely revenue-led, though an attempt was made to balance it by emphasising outcomes of expenditure. Budget for 2006-07, continuing with this revenue-led strategy, estimated a growth of 15.8% in revenue receipts over 2005- 06 (RE), composed of 19.4% growth in tax revenue accruing to the Central Government and 2.6% growth in non- tax revenues.. On the Expenditure side, there has been a considerable decrease in growth rates of planned expenditure as well as subsidies. Non planned expenditure rose by only 4.7% as against 13.1% in the previous year. Growth in Subsidies fell to 9.26% as compared to 26.4% in the previous year. Economy-Industry Linkage Source: rbi.org.in 9.2 9.8 10.3 11.4 0 2 4 6 8 10 12 2003-04 2004-05 2005-06 2006-07 %toGDP Period Gross tax revenue to GDP
  • 9. Type of Linkage Economy and Industry as a whole are inter-linked with the performance of one bearing an impact on the other. Whereas industry performance regarding multiple aspects (Revenues earned, Productivity etc) considered then and there could be concurrent or reverse impact. These can be:  Lead  Lag  Concurrent Linkage Indicators There are many indicators that link the prospects between economy and industry. A few are mentioned below- Cash Reserve Ratio (CRR) CRR is one among the inflation regulatory tool adopted by RBI in its monetary policy. When RBI wants to curb inflation it increases the CRR so that money can be squeezed from the economy and vice versa. Increase in inflation reduces the credit availability with the banks thereby reducing the pumping of money into the Types of Indicator Indicators Industries Lead  Order Book Position  New Company formation  Financial surplus/deficit of industrial and commercial companies  Building permits for new private housing units  Index of Stock Prices  Production, Raw material prices  Money Supply, Deposit, Inverted yield curve  Exports  Change in consumers' outstanding borrowing Engineering, Construction, Equity, Cement, Steel and iron, Lag  Interest rate spread  Unemployment Rate  Ratio, Manufacturing and trade inventories to  Commercial and industrial loans outstanding  Ratio of consumer installment credit to personal income  Change in CPI for services Consumer durables, Housing, Automobile, FMCG Concurrent  Real GDP  Real Non-Agricultural GDP  Employees on non-agricultural payrolls  Personal income less transfer payments  Index of industrial production  Manufacturing and trade sales IT, Telecom Banking, Insurance, Health care
  • 10. economy. An increase in CRR increases the interest rates thereby an increase in CRR up to 7% by RBI has resulted in an increase in interest rate of around 100 to 150 basis points. Impact on the banking sector, Housing, Consumer durables and Automobile An increase in the CRR has affected the profitability of the banks. This is due to the fact that a hike in CRR increases the interest rate thereby increasing the cost of borrowing and leading to decrease in the number of borrowers. Moreover it also weakens the bank stocks. Almost 70% of the total automobile’s sales, 80% of housing sales and 60% of consumer durables sales is comes through finance and loans. So if there is any change in the interest rate directly affect the automobile, housing and consumer durable industries incentives. Statutory Liquidity Ratio (SLR) SLR is the percentage of demand and time liabilities that a bank should maintain in the form of cash, gold or approved securities. It is also one among the anti inflationary measure adopted by RBI in its monetary policy. Over the past ten years, SLR has fallen and now it is fixed by RBI at 25%. Impact on the banking sector: As regards with SLR, a rise in this ratio also affects the interest rates not because of the fact that the credit availability with the banks gets reduced but because of the banks’ investment in gilt edged securities of government. The more the government borrows the more will be the investment and interest rates and vice versa. Bank rate Bank rate is the rate at which the central bank provides loans to commercial banks. Bank rate is one of the anti inflationary measures adopted by RBI. In order to curb inflation an increase in bank rate is adopted and vice versa. At present the bank rate is 6%. Impact on banking sector: An increase in the bank rate would increase the lending rates of banks as well thereby reducing the demand for the types of loans availed by the customers thereby having a negative impact on bank’s profitability. Repo rate Repo rate is the rate at which the banks borrow from the RBI. Usually it is fixed at a particular rate which acts as a base rate for all rates. Currently, Repo rate is 7.75%.An increase or decrease in Repo rates will have an impact on the bank rate. If the Repo rate is reduced the bank rate will also be reduced and vice versa. A cut in the bank rate could set off a series of rate reduction on fixed-income instruments. Banks, for instance, will lower the interest rate on their fixed-deposits. There could also be a small reduction in the loan rates they offer companies. This would prompt companies to lower interest rates offered on fresh retail bond offers. The Repo rate has a direct bearing on the overnight or the call money market
  • 11. Economy & Capital Markets GDP, Market Capitalisation & P/E Ratio GDP (Gross Domestic Product) gives a real value of Industrial productivity and their services. GDP is a means by which production performance of various industries can be evaluated. Higher GDP growth rate gives higher confidence on the performance of industries increasing the level of expected returns. Higher expectation on the returns attracts investments heavily resulting in the growth of market capitalization. P/E ratio of the market shows the relative movement of the GDP and market capitalization Reasons for low P/E growth An increase in the number of FIIs and Mutual Funds investments has created more liquidity. Hence there is more demand for stocks resulting in the increase in their respective market values. But on the other hand these stocks are constantly providing good returns to the investors. A handful of companies account for a larger share of market capitalization in India. Intrinsic values of these companies are much less than that reflected in their market capitalisation. Companies are making better profit after tax. So, earning per share is also increasing and it makes the P/E at the same level or just a low growth. Thus we can say that increase in both the market value and earning per share is nullifying the P/E ratio and results a lower growth. The tax GDP ratio of the Centre has steadily risen from 8.8% in 2002-03 to 10.3% in 2005-06 and was 11.2% in 2006-07. If there is an increase in Tax-GDP ratio, then the profitability of the industries will decrease as they’ll have less amount of money for their expansion. This will effect the industrial growth. It’ll come down. Industries will be forced to increase the prices of their products, which will lead to a rise in the inflation rate. Comparison with emerging & developed world Foreign Trade India has emerged as the fastest growing nation in the global services trade and contrary to popular belief, the country’s import growth in commercial services has outpaced exports in 2006. Against the world average of 10%, India’s services imports grew by a hefty 40% in 2006 while exports jumped by 34.3%, thus emerging as the most dynamic country in services trade. Ranked at the 10th position, the country’s services exports totaled USUS$73 billion while imports were only a shade below at USUS$70 billion with the global ranking of 12. In goods trade, India ranked ad the 17th largest importer and 28th as exporter. India is growing at an impressive rate in both exports and imports of services amid stagnant global trend. The country’s share in both global services exports and imports is 2.7%. Source: www.rbi.org.in -20 0 20 40 60 80 100 120 2003-04 2004-05 2005-06 2006-07 Growth(%) GDP Vs Market Capitalization & P/E Ratio Market Capitalization P/E Ratio GDP
  • 12. 0 2 4 6 8 10 12 2004 2005 2006 2007 Percentage Years Growth Rateof EmergingEconomies U.K. Brazil China India United States Russia Source: IMF India & China leads the growth rate among world Economies The graph shows the GDP growth rate over the past few years of BRIC nations along with US and UK. The unprecedented growth in china is due to strong infrastructure facility available where the development started a decade ago. It has allowed 100% FDI investment for all the sectors. On the other hand the infrastructure facility in India has just started recently. The Developed economies like US and UK has stagnant growth, mainly due to market reaching a peak. The other economies like Russia have a very high Inflation rate even though they have high growth rate as compared to other economies. Indian and Chinese economies are the ones which are looked upon in the world, the Indian economy is revolving around the banking system, and unlike China whose growth is contributed to other factor like FDI investments which are three time that of India.