Download to read offline


![“[This] project isn’t the first
attempt to present data like this
to the public, but it stands out for
its custom graphics, which make
abstract, complex numbers
quickly comprehensible.” - NPR
Our nation, in numbers.
Federal, state, and local data
from over 70 government
sources.
usafacts.org
HOW DOES THE MONEY
FLOW IN AND OUT OF
GOVERNMENT?](https://image.slidesharecdn.com/infographics-ncdacpicleveland-191025010310/85/Infographics-NCDA-CPI-Cleveland-2019-Charlotte-2020-8-320.jpg)


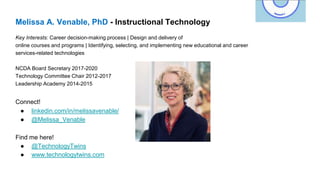
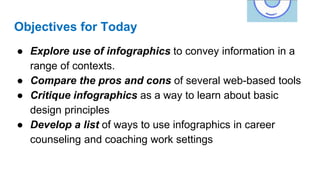
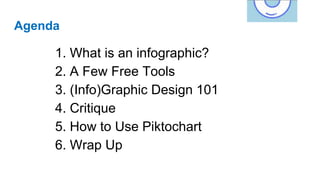
The document discusses the use of infographics in career counseling and coaching, exploring various web-based tools for creating them while outlining essential design principles. Melissa A. Venable, PhD, highlights objectives for utilizing infographics, including effective communication and enhancing client engagement. The agenda covers topics from introductory infographic concepts to practical design tool applications and encourages exploration of visual aids in professional settings.


