SlideShare a Scribd company logo
1 of 12
Download to read offline
Table 4.1 Mean, SD, median and percentile values of daily energy, macronutrient,
vitamin and mineral intakes for the total population
                                                      Total Population (n=594)
                                                                           Percentiles
                                              Mean     SD     Median      5th     95th
Macronutrients & Fibre
Energy (MJ)                                    7.0    1.5       6.9      4.8      9.7
Energy (kcals)                                1671    362      1645     1133     2314
Protein (g)                                    56.7   15.2      55.0     35.4     84.2
Fat (g)                                        63.1   16.5      60.9     39.4     92.9
CHO (g)                                       231.3   53.3     227.0    154.9    331.2
% total energy from protein                    13.6    2.2      13.4     10.1     17.2
% total energy from CHO                        52.0    4.8      51.7     44.2     59.8
% total energy from fat                        33.9    4.2      33.8     27.1     41.1
NSP (g)                                        9.4     3.2      9.1      5.2      15.3
Vitamins*
Retinol (mg)                                   366     408      245       82     1052
Carotene (mg)                                 2122    1949     1589      230     5784
Total Vitamin A (mg)                           719     538      599      164     1695
Vitamin D (mg)                                 2.3     2.3      1.5      0.4      6.4
Vitamin E (mg)                                 6.4     4.3      5.3       2.3    14.5
Thiamin (mg)                                   1.5     1.6      1.4       0.8     2.5
Riboflavin (mg)                                1.9     1.6      1.7       0.8     3.2
Pre-formed Niacin (mg)                        17.1     6.6     16.0      8.7     29.3
Total Niacin Equivalents (mg)                 28.4     8.8     27.1      16.5    45.0
Vitamin B6 (mg)                                2.0     1.7      1.8      1.0      3.4
Vitamin B12 (mg)                               4.4     2.4      4.0       1.7     8.5
Folate (mg)                                    225      98      203      112      421
Biotin (mg)                                   25.4    24.2     20.1      9.4     58.3
Pantothenate (mg)                              5.3     2.6      4.9       2.5     9.4
Vitamin C (mg)                                  87      68       70       23      195
Minerals*
Calcium (mg)                                   862     300      832      461     1433
Magnesium (mg)                                 194      53      186      123      297
Phosphorous (mg)                              1026     287      983      627     1511
Iron (mg)                                      9.4     3.5      9.0      5.2     15.9
Copper (mg)                                    0.8     0.4      0.7      0.4      1.4
Zinc (mg)                                      6.6     2.3      6.3      3.9     10.4
* All sources including dietary supplements
Table 4.2 Mean, SD, median and percentile values of daily energy, macronutrient, vitamin and mineral intakes for all boys and by age group
                                    All Boys 5-12y (n=293)                       5-8y (n=145)                           9-12y (n=148)
                                                      Percentiles                            Percentiles                             Percentiles
                              Mean SD Median 5th 95th                Mean SD Median 5th 95th                 Mean SD Median 5th 95th
Macronutrients & Fibre
Energy (MJ)                     7.4    1.6    7.3     4.9 10.2         6.8    1.5     6.8     4.6   9.6        8.0    1.6     7.9     5.8 10.5
Energy (kcals)                1759 387 1734 1155 2432                 1625 359 1608 1106 2287                 1890 369 1871 1383 2495
Protein (g)                    59.8 16.4 58.6 36.6 88.1               55.3 15.8 52.5 33.8 82.8                64.2 15.8 63.6 40.9 90.9
Fat (g)                       65.5 17.9 63.4 41.2 98.3                60.7 16.7 58.3 37.4 93.2                70.2 17.8 68.6 45.9 101.7
CHO (g)                       245.5 56.4 241.1 157.6 341.2           226.4 50.5 227.5 150.9 311.9            264.3 55.7 260.5 167.0 369.0
% total energy from protein    13.6 2.2       13.5 10.0 17.3          13.6 2.0       13.3 10.6 17.1           13.6 2.4       13.8     9.5 18.0
% total energy from CHO       52.5 5.0        52.2 44.7 60.8          52.4 4.8       52.5 44.5 60.2           52.5 5.3       51.9 44.6 61.1
% total energy from fat        33.4 4.4       33.4 26.2 40.8          33.5 4.3       33.3 25.9 40.8           33.3 4.5       33.4 26.2 40.8
NSP (g)                       10.0 3.5        9.5     5.3 16.2         9.2    3.0     9.1     4.8 15.4        10.8 3.7       10.2     5.5 17.7
Vitamins*
Retinol (mg)                   376 387        257      84 1060        379 344         234     80 1085         373 426        272      87   984
Carotene (mg)                 2357 2138 1743 196 6818                 2134 1918 1641 257 5451                 2575 2320 1833 174 7531
Total Vitamin A (mg)           769 544        658     155 1855         735 511        603    178 1603          803 575       716     125 1873
Vitamin D (mg)                  2.2    2.2    1.4     0.4     6.4      2.3    2.4     1.3     0.4   7.7        2.2    2.0     1.5     0.3   6.3
Vitamin E (mg)                  6.8    4.6     5.4    2.1 15.4         6.5    4.6     5.0     2.0 15.5         7.1    4.6     5.9     2.4 14.9
Thiamin (mg)                   1.6     0.6    1.5     0.9     2.6      1.5    0.5     1.4     0.8   2.6        1.7    0.6     1.7     0.9   2.7
Riboflavin (mg)                 2.0    0.8    1.9     0.8     3.4      1.9    0.7     1.8     0.8   3.2        2.1    0.8     2.0     0.9   3.7
Pre-formed Niacin (mg)         18.4 6.7       17.1    9.3 30.2        16.9 6.5       15.9     8.7 30.0        19.9 6.5       19.0 10.6 31.2
Total Niacin Equivalents (mg) 30.3 9.1        29.1 17.3 46.7          28.0 8.9       26.7 16.0 45.2           32.6 8.7       31.9 19.9 48.7
Vitamin B6 (mg)                 2.1    0.8     2.0    1.0     3.5      2.0    0.8     1.9     0.9   3.4        2.3    0.8     2.2     1.1   3.7
Vitamin B12 (mg)               4.7     2.3    4.4     1.8     8.8      4.3    2.0     4.2     1.5   8.9        5.0    2.5     4.7     2.0   8.7
Folate (mg)                    243 103        225     113 451         224 101         203    105 401          261 101        246     126 485
Biotin (mg)                    26.9 22.9 21.9         9.3 60.9        26.0 23.8 19.7          9.2 65.4        27.8 22.0 24.2          9.9 57.7
Pantothenate (mg)               5.7    2.2    5.5     2.6 10.4         5.4    2.2     5.1     2.6   9.8        5.9    2.3     5.7     2.6 10.5
Vitamin C (mg)                  86     73      68      21    178       81     48       71     21    168        91      90     66      21   220
Minerals*
Calcium (mg)                             918   318   883    461   1490    869   301   854     452   1453     965     328    910     478   1507
Magnesium (mg)                           206    58    196   125    311   190    53    181     118   301      222     59     216     139    339
Phosphorous (mg)                        1090   306   1049   651   1624   1022   293   971     630   1615     1156    305    1136    688   1628
Iron (mg)                               10.3   3.8    9.8   5.5   17.1    9.3   3.6   8.8     5.2   15.9     11.2    3.8    10.8    5.9   17.8
Copper (mg)                              0.8   0.4    0.8   0.4    1.5    0.8   0.4   0.7     0.4    1.5      0.9    0.4     0.9    0.5    1.6
Zinc (mg)                                7.1   2.7    6.6   3.8   11.7    6.4   2.5   5.9     3.6   10.7      7.6    2.6     7.1    4.3   12.1
* All sources including dietary supplements
Table 4.3 Mean, SD, median and percentile values of daily energy, macronutrient, vitamin and mineral intakes for all girls and by age group
                                   All Girls 5-12y (n=301)                       5-8y (n=151)                            9-12y (n=150)
                                                      Percentiles                            Percentiles                              Percentiles
                             Mean SD Median 5th 95th                 Mean SD Median 5th 95th                Mean SD Median 5th 95th
Macronutrients & Fibre
Energy (MJ)                    6.7    1.3     6.6     4.7    8.9       6.4   1.2      6.2     4.6   8.4        7.0     1.4     6.9     4.6   9.4
Energy (kcals)                1585 314 1562 1107 2125                1517 278 1467 1105 1985                 1654 333 1649 1089 2227
Protein (g)                   53.7 13.2 52.3 35.2 76.2                51.9 12.8 49.9 34.7 73.0                55.6 13.4 55.2 35.8 80.5
Fat (g)                       60.8 14.7 59.3 39.2 86.2                58.2 13.5 56.2 38.8 81.9                63.4 15.4 61.5 39.2 91.1
CHO (g)                      217.4 46.0 211.3 152.7 299.8            207.9 40.4 201.0 152.7 288.0            226.9 49.4 223.2 145.1 313.5
% total energy from protein   13.6 2.1       13.4 10.2 17.1           13.7 2.1       13.5 10.3 17.1           13.5 2.2        13.3     9.8 17.2
% total energy from CHO       51.5 4.5       51.2 44.0 59.3           51.5 4.6       51.6 43.4 59.6           51.5 4.5        51.2 44.2 59.1
% total energy from fat       34.4 4.0       34.2 27.9 41.5           34.4 3.9       34.1 27.9 41.0           34.4 4.2        34.3 27.6 41.7
NSP (g)                        8.8    2.8     8.4     5.1 14.2        8.5    2.5      8.3     4.7 13.0         9.2     2.9     8.7     5.3 15.2
Vitamins*
Retinol (mg)                             356 428     239     80 1037     385 511      255     109 1096        326 322        213      72 1047
Carotene (mg)                           1892 1719    1449   251 5020     1707 1381    1285    239 4728        2079 1989      1601    251 6341
Total Vitamin A (mg)                    671 527      555    164 1603      669 581     555     174 1486        673 469        555     155 1626
Vitamin D (mg)                           2.3  2.3     1.5    0.4  6.4     2.2  2.4     1.4    0.4  6.8         2.3  2.3       1.6     0.4  6.4
Vitamin E (mg)                           6.1  3.9     5.0    2.3 13.3     5.8  3.7     4.8    2.2 12.8         6.3  4.1       5.2     2.4 13.7
Thiamin (mg)                             1.5  2.2     1.3    0.8  2.4     1.3  0.5     1.2    0.7  2.4         1.7  3.0       1.3     0.8  2.4
Riboflavin (mg)                          1.8  2.2     1.6    0.7  2.9     1.7  0.6     1.6    0.8  2.9         1.9  3.0       1.5     0.7  3.0
Pre-formed Niacin (mg)                  15.9 6.3     14.7    8.5 27.3    15.0 5.8     13.8    8.2 26.7        16.8 6.7       15.6     8.8 28.6
Total Niacin Equivalents (mg)           26.6 8.1     25.2   16.3 42.6    25.3 7.6     24.0    15.7 38.4       28.0 8.4       26.3    17.3 45.0
Vitamin B6 (mg)                          1.9  2.2     1.7    1.0  3.2     1.8  0.6     1.7    1.0  2.9         2.1  3.1       1.7     1.1  3.3
Vitamin B12 (mg)                         4.2  2.6     3.8    1.5  8.0     4.3  2.7     3.8    1.5  8.0         4.1  2.4       3.7     1.5 8.4
Folate (mg)                             207   90     186    111 417      204   84     186     113 378         210   95       186     106 429
Biotin (mg)                             23.9 25.4    19.4    9.5 54.0    23.3 26.5    19.1    9.9 52.2        24.4 24.3      19.6     9.1 61.5
Pantothenate (mg)                        4.9  2.9     4.4    2.4  8.5     4.7  1.8     4.4    2.5  7.8         5.1  3.8       4.5     2.3  9.0
Vitamin C (mg)                            88  63      74     25  203      85   56      73      24  196         92   68        74      25  216
Minerals*
Calcium (mg)                             808   270   765    438   1297   815   244    795     456    1213      801    295    730     427   1425
Magnesium (mg)                           182    44   178    122   266    177   41     173     114    262       188     45    180     126    272
Phosphorous (mg)                         963   253   938    594   1445   953   238    935     587    1446      973    268    939     595   1452
Iron (mg)                                8.5   2.8   8.0    4.9   13.7   8.4   2.7    7.9     5.0    13.7      8.7    2.9    8.5     4.8   13.8
Copper (mg)                              0.8   0.4   0.7    0.4    1.3   0.7   0.4    0.7     0.4     1.2      0.8    0.3    0.8     0.5    1.3
Zinc (mg)                                6.2   1.7   5.9    3.9    9.8   6.0   1.7    5.6     3.7     9.9      6.4    1.8    6.3     4.1    9.8
* All sources including dietary supplements
Table 4.4 Contribution of food groups (kcal & %) to mean daily energy intakes by sex and age group
                                                            Total                           Boys                                   Girls
                                                            5-12y           All Ages        5-8y         9-12y      All Ages       5-8y         9-12y
                                                           (n=594)          (n=293)       (n=145)      (n=148)      (n=301)      (n=151)      (n=150)
                                                          kcal     %       kcal %        kcal %       kcal %       kcal %       kcal %       kcal %
Milk & yoghurt                                            218      13.1    241   13.8    238   14.7   245   12.8   196   12.4   217   14.4   174   10.4
Sugars, confectionery, preserves & savoury snacks         212      12.7    216   12.3    194   11.9   237   12.6   209   13.2   192   12.7   226   13.7
Meat & meat products                                      209      12.6    222   12.7    200   12.4   243   13.0   196   12.5   180   11.8   213   13.2
Bread & rolls                                             200      12.0    209   11.9    198   12.2   221   11.6   191   12.1   174   11.5   209   12.7
Potatoes & potato products                                134       8.1    141    8.1    127    7.9   155    8.4   127    8.1   109    7.2   145    8.9
Breakfast cereals                                         124      7.4     149   8.4     133   8.1    164    8.7   100    6.4   104    6.9   97     5.9
Biscuits, cakes & pastries                                109       6.5    116    6.6    113    6.9   119    6.3   101    6.4    97    6.5   106    6.4
Grains, rice, pasta & savouries                            93       5.6     89    5.1     72    4.6   106    5.6   96     6.0    87    5.7   105    6.3
Beverages                                                  83       4.9     93   5.2     75    4.7    110   5.8     73    4.7    67    4.4   80     4.9
Fruit & fruit juices                                       70       4.2     66   3.8     69    4.3     63    3.3    74    4.7    77    5.1   71     4.2
Butter, spreading fats & oils                              54       3.2     58    3.2     54    3.2    62    3.2    51    3.2    51    3.3   52     3.1
Creams, ice-creams & chilled desserts                      53       3.1     50    2.9     50    3.1   50    2.7    55    3.4    46     3.1   63     3.8
Cheeses                                                    27       1.6     25   1.4     23    1.4     27    1.4    29    1.8    31    2.0   28     1.7
Veg & veg dishes                                           27       1.6     27   1.5     23    1.4     30    1.6    27    1.7    30    2.0   25     1.5
Soups, sauces & miscellaneous foods                        18       1.1     17    0.9     13    0.8    20   1.1    20     1.3    17    1.2   23     1.4
Fish & fish products                                       16       1.0     17   1.0     18    1.1     15    0.8    15    1.0    15    1.0   14     0.9
Eggs & egg dishes                                          15       0.9     15   0.8     16    0.9     14    0.7    15    0.9    14    0.9   15     0.9
Nuts & seeds, herbs & spices                                5       0.3      6    0.3     4     0.3     7    0.3     3    0.2     4    0.2    3     0.2
Nutritional supplements                                     1       0.1      2    0.1      3    0.2     0    0.0     1    0.1     2    0.1    0     0.0

Total                                                    1668       100    1757 100      1623 100     1888 100     1582 100     1514 100     1650 100
Table 4.5 Mean, SD and median values of daily energy intake (MJ/day) for boys by demographic variables and age group
                                                         All 5-12y (n=293)                  5-8y (n=145)             9-12y (n=148)
                                                    Mean    SD Median         n      Mean    SD Median     n    Mean  SD Median      n
Location
Open country & village                               7.5    1.7     7.2      133     7.0    1.7     6.7    65   7.9    1.6     7.8   68
Small town                                           7.8    1.2     7.7      17      7.0    1.1     7.3     8   8.4    0.8     8.4    9
Large town                                           7.0    1.7     7.1      67      6.4    1.3     6.5    34   7.7    1.7     7.4   33
City                                                 7.5    1.5     7.6      76      6.9    1.3     6.8    38   8.2    1.4     8.2   38
Education levela                                               n=292                           n=144                      n=148
Primary                                              7.2    3.7    9.3        3      0.0    0.0    0.0      0   7.2    3.7     9.3    3
Intermediate                                         7.7    1.9    7.5        57     7.2    2.2    7.3     25   8.1    1.7     8.2   32
Secondary                                            7.2    1.6    7.1       113     6.6    1.4    6.6     61   7.9    1.6     7.8   52
Tertiary                                             7.5    1.4    7.3       119     6.9    1.3    6.8     58   8.0    1.4     7.8   61
Social class b                                                 n=287                           n=142                      n=145
Professional/managerial & technical                  7.5    1.6     7.3      144.0   6.9    1.4     6.7    68   8.0    1.6     7.7   76
Non-manual                                           7.4    1.4     7.3      59.0    6.6    1.1     6.9    26   7.9    1.3     7.9   33
Skilled manual                                       7.1    1.9     7.0      51.0    6.4    1.8     6.6    30   8.0    1.6     8.4   21
Unskilled/semi-skilled manual                        7.4    1.9     7.6      33.0    7.3    1.9     7.3    18   7.5    1.8     8.1   15
a parental education (highest level of education)
b social class of family
Table 4.6 Mean, SD and median values of daily energy intake (MJ/day) for girls by demographic variables and age group
                                           All 5-12y(n=301)                      5-8y (n=151)                   9-12y (n=150)
                                      Mean    SD Median         n       Mean      SD Median       n        Mean  SD Median        n
Location
Open country & village                  6.6     1.3     6.3    109        6.3     1.1     6.1     52        6.8     1.4     6.8   57
Small town                              6.2     1.2     6.0    17         6.1     1.1     6.0      8        6.3     1.3     5.5    9
Large town                              6.6     1.3     6.6    80         6.3     1.3     6.0     42        6.9     1.3     7.1   38
City                                    6.9     1.3     6.7    95         6.6     1.1     6.5     49        7.3     1.5     6.9   46
Education level                                    n=297                             n=150                             n=147
Primary                                 7.6     1.3    7.9       5        6.2     0.7    6.2       2        8.5     0.5    8.6     3
Intermediate                            6.7     1.5    6.6      44        7.0     1.5    7.0      18        6.4     1.5    6.1    26
Secondary                               6.5     1.3    6.4     116        6.2     1.1    5.9      61        6.9     1.4    7.1    55
Tertiary                                6.8     1.3    6.6     132        6.4     1.1    6.2      69        7.2     1.4    7.2    63
            b
Social class                                       n=298                             n=150                             n=148
Professional Workers                    6.7     1.3     6.6    163        6.4     1.1     6.2     80        7.1     1.3     7.1   83
Non-manual Workers                      6.7     1.3     6.7    58         6.1     1.1     5.8     27        7.2     1.2     7.5   31
Skilled manual Workers                  6.6     1.5     6.1    42         6.3     1.0     6.0     22        6.9     1.8     6.3   20
Unskilled Workers                       6.5     1.5     6.1    35         6.7     1.5     6.7     21        6.2     1.5     6.0   14
Table 4.7 Contribution of food groups (g & %) to mean daily protein intakes by sex and age group
                                                           Total                      Boys                                       Girls
                                                           5-12y       All Ages       5-8y           9-12y       All Ages        5-8y          9-12y
                                                         (n=594)       (n=293)      (n=145)        (n=148)       (n=301)       (n=151)       (n=150)
                                                         g     %        g    %       g    %         g    %        g    %        g     %       g    %
Meat & meat products                                    18.3 31.7     19.5   31.8   17.5   30.8    21.4   32.7   17.3   31.6   15.9   29.8   18.6   33.5
Milk & yoghurt                                          10.8 19.1     11.9   19.9   11.4   20.9    12.3   18.8   9.9    18.3   10.8   20.9   8.9    15.6
Bread & rolls                                            7.0 12.6      7.4   12.6    6.9   12.7     7.8   12.4    6.7   12.5    6.1   11.8    7.3   13.2
Grains, rice, pasta & savouries                          3.3 5.9       3.2    5.5    2.6    5.0     3.8    6.0    3.4    6.4    3.1    6.0    3.8    6.7
Breakfast cereals                                        2.7 4.8       3.3    5.4    2.9    5.2     3.6    5.7    2.2    4.1    2.3    4.4    2.1    3.8
Sugars, confectionery, preserves & savoury snacks        2.5 4.6       2.4    4.3    2.2    4.2     2.7    4.5   2.5     4.9    2.2    4.6   2.7    5.2
Potatoes & potato products                               2.4 4.4       2.6    4.6    2.4    4.4     2.8    4.7   2.3     4.3    2.0    3.9    2.6    4.8
Cheeses                                                  1.8 3.1       1.7    2.7    1.6    2.7     1.8    2.6    1.9    3.5    2.1    3.9    1.7    3.0
Biscuits, cakes & pastries                               1.6 2.9       1.6    2.9    1.5    2.9     1.7    2.9   1.5     2.9    1.4    2.9    1.6    3.0
Fish & fish products                                    1.4 2.5       1.4    2.3    1.5    2.5     1.4    2.1    1.4    2.6    1.5     2.8   1.4    2.4
Veg & veg dishes                                         1.3 2.3       1.3    2.2    1.2    2.2     1.5    2.2    1.3    2.3    1.3    2.6    1.2    2.1
Creams, ice-creams & chilled desserts                    0.9 1.7       0.9    1.6    1.0    1.8     0.9    1.3    0.9    1.8    0.8    1.7    1.1    2.0
Eggs & egg dishes                                        1.0 1.6       1.0    1.5    1.0    1.6     0.9    1.4    1.0    1.8    0.9    1.8    1.0    1.7
Others                                                   1.6 2.9       1.7    2.8    1.7    3.0     1.7    2.6    1.5    2.9    1.4    2.9    1.6    3.0

Total                                                   56.7   100    59.8 100      55.3 100       64.2 100      53.6 100      51.7 100      55.5 100
Table 4.8 Contribution of food groups (g & %) to mean daily fat intakes by sex and age group
                                                         Total                      Boys                                      Girls
                                                         5-12y      All Ages        5-8y          9-12y       All Ages        5-8y          9-12y
                                                       (n=594)      (n=293)       (n=145)       (n=148)       (n=301)       (n=151)       (n=150)
                                                        g    %       g    %        g    %        g    %        g    %        g     %       g    %
Meat & meat products                                  11.9   18.9   12.7   19.4   11.5   18.9   13.9   19.9   11.1   18.5   10.2   17.6   12.0   19.4
Milk & yoghurt                                        11.3   18.0   12.6   19.4   12.4   20.7   12.7   18.2   10.1   16.7   11.2   19.3   8.9    14.0
Sugars, confectionery, preserves & savoury snacks     8.9    14.4    8.8   13.7    7.9   13.3    9.7   14.0    9.0   15.1    8.1   14.2   10.0   15.9
Butter, spreading fats & oils                         6.0     9.2   6.4    9.4    5.9    9.3     6.8    9.4    5.6    9.1    5.6    9.3   5.7     8.8
Biscuits, cakes & pastries                             4.8    7.6    5.2    7.9    5.0    8.2    5.3    7.5   4.4     7.4    4.2    7.5   4.6     7.3
Potatoes & potato products                            4.6     7.3   4.7    7.3    4.1    6.9     5.3    7.6   4.4     7.2    3.6    6.2   5.2     8.3
Creams, ice-creams & chilled desserts                 2.7     4.3   2.5    3.9    2.5     4.2    2.5    3.6    2.9    4.7    2.4    4.2   3.4     5.2
Grains, rice, pasta & savouries                       2.7     4.3   2.6    4.0    2.0    3.5    3.2     4.5    2.8    4.5    2.4    4.2   3.1     4.9
Bread & rolls                                          2.3    3.7    2.3    3.5    2.2    3.6    2.4    3.4    2.4    3.9    2.1    3.7   2.6    4.1
Cheeses                                                2.2    3.3    2.0    2.9    1.8    2.8    2.2    3.0    2.4    3.7    2.4    4.0   2.3    3.5
Eggs & egg dishes                                      1.2    1.8    1.2    1.8    1.3    2.0    1.2    1.6   1.2    1.9    1.2    1.9    1.3     1.8
Breakfast cereals                                      1.1    1.7    1.3    1.9    1.2    1.9    1.4    1.9    0.9    1.5    1.0    1.7   0.9    1.3
Soups, sauces & miscellaneous foods                   1.0     1.7   0.9    1.3    0.7    1.1     1.1    1.6    1.2    1.9    1.1    1.9   1.3     2.0
Veg & veg dishes                                       0.8    1.3    0.8    1.1    0.5    0.8    1.0    1.4   0.9    1.5    1.0    1.8    0.8     1.3
Others                                                 1.5    2.4    1.6    2.5    1.6    2.7    1.6    2.3    1.4    2.4    1.5    2.5   1.3    2.2

Total                                                 63.0 100      65.4 100      60.6 100      70.2 100      60.7 100      58.0 100      63.3 100
Table 4.9 Contribution of food groups (g & %) to mean daily carbohydrate intakes by sex and age group
                                                         Total                      Boys                                      Girls
                                                         5-12y      All Ages        5-8y         9-12y         All Ages       5-8y        9-12y
                                                       (n=594)      (n=293)       (n=145)      (n=148)         (n=301)      (n=151)     (n=150)
                                                        g     %      g    %        g     %      g     %         g    %       g     %     g     %
Bread & rolls                                         40.3 17.5     42.4 17.3    40.0 17.7     44.8     16.9   38.2 17.7   34.8 16.8   41.7 18.5
Sugars, confectionery, preserves & savoury snacks     31.6 13.5     32.8 13.2    29.5 12.7     36.0     13.6   30.4 13.9   28.4 13.6   32.4 14.2
Breakfast cereals                                     27.1 11.5     32.4 13.0    28.9 12.6     35.9     13.5   21.8 10.0   22.6 10.8   21.1 9.2
Potatoes & potato products                            22.2 9.8      23.6 9.8     21.5 9.6      25.6     10.0   20.9 9.8    18.3 8.9    23.4 10.6
Beverages                                             21.3 9.0      23.9 9.4     19.4 8.5      28.3     10.4   18.7 8.5    17.1 8.2    20.3 8.9
Milk & yoghurt                                        19.4 8.5      21.4 8.9     21.3 9.6      21.5      8.2   17.4 8.2    19.4 9.5    15.4 6.8
Fruit & fruit juices                                  17.3 7.5      16.2 6.6     16.9 7.5      15.5      5.8   18.3 8.3    19.0 9.0    17.6 7.5
Biscuits, cakes & pastries                            15.7 6.8      16.7 6.9     16.2 7.2      17.1      6.6   14.7 6.8    14.1 6.8    15.3 6.8
Grains, rice, pasta & savouries                       14.6 6.4      14.0 5.8     11.5 5.3      16.4      6.3   15.3 7.0    14.1 6.8    16.5 7.2
Meat & meat products                                   7.5 3.4       7.8 3.3      7.2 3.3       8.4      3.3    7.3 3.4     6.5 3.2     8.0 3.7
Creams, ice-creams & chilled desserts                  6.4 2.8       6.3 2.6      6.3 2.8       6.4      2.4    6.5 3.0     5.6 2.7     7.5 3.3
Veg & veg dishes                                       3.8 1.6       3.8 1.6      3.5 1.5       4.2      1.6    3.8 1.7     4.2 1.9     3.4 1.5
Others                                                 3.8 1.7       3.9 1.6      3.9 1.7       3.9      1.5    3.7 1.7     3.4 1.7     4.0 1.8

Total                                                230.9 100     245.3 100    226.0 100     264.1 100        216.9 100   207.5 100   226.4 100
Table 4.10 Mean, SD and median values of macronutrient intakes for boys and girls by geographical location
                                        Open country & village            Small town                   Large town                    City
                                        Mean    SD Median            Mean    SD Median            Mean     SD Median         Mean    SD      Median
Boys                                            n=133                         n=17                           n=67                    n=76
Protein (g)                             62.3     16.9     59.5       60.7      11.6    60.8       55.1        15.8   54.7    59.5     16.4    58.0
Fat (g)                                 66.8     19.7     64.3       69.1      12.0    71.9       61.4        16.6    60.1    66.1    16.3    64.2
Carbohydrate (g)                        244.3    58.8     238.7      259.4     44.5    257.1      236.9       59.8   231.1   252.3    50.8   248.0
% total energy from protein              14.1     2.2      13.9       13.1      1.6     13.0       13.2        2.2    13.0    13.2     2.2    13.0
% total energy from fat                 33.7      4.8      33.9       33.6      2.7     33.6       33.0        4.3    32.9    33.1     4.1    32.8
% total energy from carbohydrate        51.8      5.3      51.2       52.6      3.8     52.7      53.2         5.2    53.2    53.0     4.5    53.4
Girls                                           n=109                         n=17                           n=80                    n=95
Protein (g)                             53.4     12.6     52.1       49.8      11.5    50.2       54.6        13.9   54.8    54.1     13.7    50.8
Fat (g)                                 60.0     14.9     58.8       57.2      12.7    52.9       59.8        14.7    58.6    63.2    14.6    61.7
Carbohydrate (g)                        215.7    47.6     206.9      199.6     41.6    180.3      212.8       43.0   207.2   226.4    46.4   221.7
% total energy from protein              13.7     2.3      13.5       13.5      1.6     13.1       14.0        2.1    13.9    13.1     1.9    13.2
% total energy from fat                 34.3      4.6      34.0       35.0      3.9     33.6       34.3        3.5    34.1    34.5     3.8    34.7
% total energy from carbohydrate        51.6      5.1      51.3       50.9      4.1     51.0      51.2         4.0    50.9    51.7     4.3    51.6
Table 4.11 Mean, SD and median values of macronutrient intakes for boys and girls by level of education of parents
                                             Intermediate                   Secondary                    Tertiary
                                         Mean     SD Median            Mean    SD Median            Mean   SD Median
Boys                                              n=60                         n=113                        n=119
Protein (g)                              61.3      19.9    60.0        57.5     15.9    55.2        61.4     14.7     60.6
Fat (g)                                   67.6     19.5     67.2        63.6    18.9     60.3        66.3    16.0     64.4
Carbohydrate (g)                         256.6     70.0    249.1       239.2    53.1    236.1       245.6    51.3    243.7
% total energy from protein              13.4      2.3     13.0        13.5     2.3     13.3        13.9     2.0     13.7
% total energy from fat                  33.3      4.5     33.1        33.3     4.5     33.1        33.6     4.3      34.0
% total energy from carbohydrate         52.8       5.0    52.5        52.7     5.2     52.7         52.0     4.8     51.6
Girls                                             n=49                         n=116                        n=132
Protein (g)                              53.7      16.6    51.5        52.8     12.6    51.8        54.3     12.0     53.3
Fat (g)                                   62.9     16.2     62.9        59.3    14.5     57.0        61.3    14.4     59.2
Carbohydrate (g)                         217.8     52.4    219.1       212.6    43.2    203.9       221.8    46.2    216.1
% total energy from protein              13.3      2.2     13.2        13.6     1.9     13.5        13.6     2.2     13.4
% total energy from fat                  35.3      4.8     35.5        34.3     4.0     34.7        34.2     3.8      33.7
% total energy from carbohydrate         50.9       5.5    51.3        51.6     4.3     51.1         51.7     4.4     51.6
Table 4.12 Mean, SD and median values of macronutrient intakes for boys and girls by social class
                                          Professional Workers            Non-Manual                   Skilled Manual            Non-skilled
                                         Mean      SD Median          Mean    SD Median             Mean     SD Median      Mean    SD Median
Boys                                              n=144                        n=59                         n=51                    n=33
Protein (g)                               62.1     16.3     60.8       60.4     14.9    58.3         55.2    17.9    51.8    55.1    15.3    51.9
Fat (g)                                   67.0     18.0     64.5       64.6     15.8    63.3         62.7    20.2   60.8    63.4     17.3   63.4
Carbohydrate (g)                         246.0     53.0    239.5      245.3     49.0    240.1       235.2    63.9   242.1   256.6    69.1   261.0
% total energy from protein               13.9      2.1     13.8       13.8      2.4    13.8         13.2     2.2   13.1    12.6      2.3   12.4
% total energy from fat                   33.7      4.1     34.2       33.1      4.1    32.7         33.6     5.5    34.0    32.2     4.3    32.3
% total energy from carbohydrate          51.9      4.6     51.5       52.6      4.9    52.7         52.7     5.9   53.3    54.6      5.1   53.5
Girls                                             n=163                        n=58                         n=42                    n=35
Protein (g)                                54.4     11.8     53.8      54.7     12.1    55.7         50.6    15.3    46.6    52.8    17.8    49.8
Fat (g)                                    60.9     13.9     59.4     61.2      15.4    60.9         61.6    16.2   57.5    59.0     15.6   57.2
Carbohydrate (g)                          219.1     46.1    214.9     215.6     42.1    214.3       214.4    47.3   200.5   214.8    49.9   207.1
% total energy from protein                13.7      2.0     13.6      13.8      2.1    13.5         12.8    2.0    12.5    13.5      2.5   13.1
% total energy from fat                    34.3      4.0     33.9      34.5      4.2    34.8         35.2     4.1    35.5    34.1     4.1    34.2
% total energy from carbohydrate           51.5      4.5     51.4      51.1      4.1    50.6        51.4     4.7    51.4    51.9      5.2   51.6

More Related Content

Viewers also liked

15th Annual Professional Responsibility Seminar
15th Annual Professional Responsibility Seminar 15th Annual Professional Responsibility Seminar
15th Annual Professional Responsibility Seminar Kegler Brown Hill + Ritter
 
Animal Fiber Comparison Table
Animal Fiber Comparison TableAnimal Fiber Comparison Table
Animal Fiber Comparison Tabletovman
 
Scholastic demo lesson
Scholastic demo lessonScholastic demo lesson
Scholastic demo lessonbuckskinlily
 
Copy cat 비교하기
Copy cat 비교하기Copy cat 비교하기
Copy cat 비교하기Park SooJin
 
PRISM & FISA Fact Sheet
PRISM & FISA Fact SheetPRISM & FISA Fact Sheet
PRISM & FISA Fact SheetAmy Gaskins
 
Populating a Release History Database (ICSM 2013 MIP)
Populating a Release History Database (ICSM 2013 MIP)Populating a Release History Database (ICSM 2013 MIP)
Populating a Release History Database (ICSM 2013 MIP)Martin Pinzger
 
Art Works By M.J.Lacey Glb
Art Works By M.J.Lacey GlbArt Works By M.J.Lacey Glb
Art Works By M.J.Lacey GlbGeta Lucia
 
Hasselblad Electronic Imaging
Hasselblad Electronic ImagingHasselblad Electronic Imaging
Hasselblad Electronic ImagingChris Sandström
 
11 project color theory pages
11 project color theory pages11 project color theory pages
11 project color theory pagesRiverwood HS
 
Dani Wang Resume_CBAP_PMP_SCJP_PM_Updated_1
Dani Wang Resume_CBAP_PMP_SCJP_PM_Updated_1Dani Wang Resume_CBAP_PMP_SCJP_PM_Updated_1
Dani Wang Resume_CBAP_PMP_SCJP_PM_Updated_1Dani Wang
 
Interactive STEM Learning with zSpace
Interactive STEM Learning with zSpaceInteractive STEM Learning with zSpace
Interactive STEM Learning with zSpacezSpace
 
20150129 smb nemo healthcare
20150129 smb   nemo healthcare20150129 smb   nemo healthcare
20150129 smb nemo healthcareSMBBV
 

Viewers also liked (18)

Ijsea04031014
Ijsea04031014Ijsea04031014
Ijsea04031014
 
15th Annual Professional Responsibility Seminar
15th Annual Professional Responsibility Seminar 15th Annual Professional Responsibility Seminar
15th Annual Professional Responsibility Seminar
 
Animal Fiber Comparison Table
Animal Fiber Comparison TableAnimal Fiber Comparison Table
Animal Fiber Comparison Table
 
Scholastic demo lesson
Scholastic demo lessonScholastic demo lesson
Scholastic demo lesson
 
Copy cat 비교하기
Copy cat 비교하기Copy cat 비교하기
Copy cat 비교하기
 
Guide to Cheap Cruises
Guide to Cheap CruisesGuide to Cheap Cruises
Guide to Cheap Cruises
 
College transition for students at risk
College transition for students at riskCollege transition for students at risk
College transition for students at risk
 
PRISM & FISA Fact Sheet
PRISM & FISA Fact SheetPRISM & FISA Fact Sheet
PRISM & FISA Fact Sheet
 
Idioms
IdiomsIdioms
Idioms
 
Populating a Release History Database (ICSM 2013 MIP)
Populating a Release History Database (ICSM 2013 MIP)Populating a Release History Database (ICSM 2013 MIP)
Populating a Release History Database (ICSM 2013 MIP)
 
Art Works By M.J.Lacey Glb
Art Works By M.J.Lacey GlbArt Works By M.J.Lacey Glb
Art Works By M.J.Lacey Glb
 
Ctr manufacturing-industries-limited
Ctr manufacturing-industries-limitedCtr manufacturing-industries-limited
Ctr manufacturing-industries-limited
 
Hasselblad Electronic Imaging
Hasselblad Electronic ImagingHasselblad Electronic Imaging
Hasselblad Electronic Imaging
 
Cadca Capacity Primer
Cadca Capacity PrimerCadca Capacity Primer
Cadca Capacity Primer
 
11 project color theory pages
11 project color theory pages11 project color theory pages
11 project color theory pages
 
Dani Wang Resume_CBAP_PMP_SCJP_PM_Updated_1
Dani Wang Resume_CBAP_PMP_SCJP_PM_Updated_1Dani Wang Resume_CBAP_PMP_SCJP_PM_Updated_1
Dani Wang Resume_CBAP_PMP_SCJP_PM_Updated_1
 
Interactive STEM Learning with zSpace
Interactive STEM Learning with zSpaceInteractive STEM Learning with zSpace
Interactive STEM Learning with zSpace
 
20150129 smb nemo healthcare
20150129 smb   nemo healthcare20150129 smb   nemo healthcare
20150129 smb nemo healthcare
 

Similar to NCFS - C4 T4 P1to12

Final presentation
Final presentationFinal presentation
Final presentationnasharma
 
Nutrition Profile of Shea Fruit Pulp from Nigeria
Nutrition Profile of Shea Fruit Pulp from NigeriaNutrition Profile of Shea Fruit Pulp from Nigeria
Nutrition Profile of Shea Fruit Pulp from NigeriaWest Africa Trade Hub
 
Beyond protein intake: Bushmeat as source of micronutrients in the tri-fronti...
Beyond protein intake: Bushmeat as source of micronutrients in the tri-fronti...Beyond protein intake: Bushmeat as source of micronutrients in the tri-fronti...
Beyond protein intake: Bushmeat as source of micronutrients in the tri-fronti...Fundsi88
 
Growth Week 2011: Ideas for Growth Session 1 - Agriculture
Growth Week 2011: Ideas for Growth Session 1 - AgricultureGrowth Week 2011: Ideas for Growth Session 1 - Agriculture
Growth Week 2011: Ideas for Growth Session 1 - AgricultureThe International Growth Centre
 
Sacred Chocolate Nutritional Analysis Gingeroo
Sacred Chocolate Nutritional Analysis GingerooSacred Chocolate Nutritional Analysis Gingeroo
Sacred Chocolate Nutritional Analysis GingerooSacred Chocolate, LLC
 
[Reg #00019] Report created 24 September 2010 Page 1Diary .docx
[Reg #00019] Report created 24 September 2010 Page 1Diary .docx[Reg #00019] Report created 24 September 2010 Page 1Diary .docx
[Reg #00019] Report created 24 September 2010 Page 1Diary .docxdanielfoster65629
 
Manual de alimentación de rumiantes Errata version 2
Manual de alimentación de rumiantes Errata version 2Manual de alimentación de rumiantes Errata version 2
Manual de alimentación de rumiantes Errata version 2Victor Alonso Martinez Torres
 
Lalita 6c dietary assessment
Lalita 6c dietary assessmentLalita 6c dietary assessment
Lalita 6c dietary assessmentSizwan Ahammed
 
【東京医科歯科大学】平成20年環境報告書
【東京医科歯科大学】平成20年環境報告書【東京医科歯科大学】平成20年環境報告書
【東京医科歯科大学】平成20年環境報告書env58
 
Importance of Tropical tubers in solving global hunger by Pallavi Wani.pptx
Importance of Tropical tubers in solving global hunger by Pallavi Wani.pptxImportance of Tropical tubers in solving global hunger by Pallavi Wani.pptx
Importance of Tropical tubers in solving global hunger by Pallavi Wani.pptxPallavi Wani
 
2° Meeting "Taste of Freedom" / Presentations on Project activities - Spain
2° Meeting "Taste of Freedom" / Presentations on Project activities - Spain2° Meeting "Taste of Freedom" / Presentations on Project activities - Spain
2° Meeting "Taste of Freedom" / Presentations on Project activities - SpainTASTE OF FREEDOM
 
Recap des résultats 2010 sociétés cotées
Recap des résultats 2010 sociétés cotéesRecap des résultats 2010 sociétés cotées
Recap des résultats 2010 sociétés cotéesIDIR2001
 
Recap des sociétés cotées
Recap des sociétés cotéesRecap des sociétés cotées
Recap des sociétés cotéesIDIR2001
 
NCFS - C5 T5 PG1-19
NCFS - C5 T5 PG1-19NCFS - C5 T5 PG1-19
NCFS - C5 T5 PG1-19LBG
 

Similar to NCFS - C4 T4 P1to12 (20)

Final presentation
Final presentationFinal presentation
Final presentation
 
Nutrition Profile of Shea Fruit Pulp from Nigeria
Nutrition Profile of Shea Fruit Pulp from NigeriaNutrition Profile of Shea Fruit Pulp from Nigeria
Nutrition Profile of Shea Fruit Pulp from Nigeria
 
chicken and egg
chicken and eggchicken and egg
chicken and egg
 
Beyond protein intake: Bushmeat as source of micronutrients in the tri-fronti...
Beyond protein intake: Bushmeat as source of micronutrients in the tri-fronti...Beyond protein intake: Bushmeat as source of micronutrients in the tri-fronti...
Beyond protein intake: Bushmeat as source of micronutrients in the tri-fronti...
 
Producción petrolera 2012
Producción petrolera 2012Producción petrolera 2012
Producción petrolera 2012
 
Nutritional comparison
Nutritional comparisonNutritional comparison
Nutritional comparison
 
Growth Week 2011: Ideas for Growth Session 1 - Agriculture
Growth Week 2011: Ideas for Growth Session 1 - AgricultureGrowth Week 2011: Ideas for Growth Session 1 - Agriculture
Growth Week 2011: Ideas for Growth Session 1 - Agriculture
 
Sacred Chocolate Nutritional Analysis Gingeroo
Sacred Chocolate Nutritional Analysis GingerooSacred Chocolate Nutritional Analysis Gingeroo
Sacred Chocolate Nutritional Analysis Gingeroo
 
[Reg #00019] Report created 24 September 2010 Page 1Diary .docx
[Reg #00019] Report created 24 September 2010 Page 1Diary .docx[Reg #00019] Report created 24 September 2010 Page 1Diary .docx
[Reg #00019] Report created 24 September 2010 Page 1Diary .docx
 
Impact of Secondary and Micronutrients on Fruit and Vegetable Production and ...
Impact of Secondary and Micronutrients on Fruit and Vegetable Production and ...Impact of Secondary and Micronutrients on Fruit and Vegetable Production and ...
Impact of Secondary and Micronutrients on Fruit and Vegetable Production and ...
 
The Pie Lies
The Pie LiesThe Pie Lies
The Pie Lies
 
Manual de alimentación de rumiantes Errata version 2
Manual de alimentación de rumiantes Errata version 2Manual de alimentación de rumiantes Errata version 2
Manual de alimentación de rumiantes Errata version 2
 
Lalita 6c dietary assessment
Lalita 6c dietary assessmentLalita 6c dietary assessment
Lalita 6c dietary assessment
 
【東京医科歯科大学】平成20年環境報告書
【東京医科歯科大学】平成20年環境報告書【東京医科歯科大学】平成20年環境報告書
【東京医科歯科大学】平成20年環境報告書
 
Importance of Tropical tubers in solving global hunger by Pallavi Wani.pptx
Importance of Tropical tubers in solving global hunger by Pallavi Wani.pptxImportance of Tropical tubers in solving global hunger by Pallavi Wani.pptx
Importance of Tropical tubers in solving global hunger by Pallavi Wani.pptx
 
2° Meeting "Taste of Freedom" / Presentations on Project activities - Spain
2° Meeting "Taste of Freedom" / Presentations on Project activities - Spain2° Meeting "Taste of Freedom" / Presentations on Project activities - Spain
2° Meeting "Taste of Freedom" / Presentations on Project activities - Spain
 
Recap des résultats 2010 sociétés cotées
Recap des résultats 2010 sociétés cotéesRecap des résultats 2010 sociétés cotées
Recap des résultats 2010 sociétés cotées
 
Recap des sociétés cotées
Recap des sociétés cotéesRecap des sociétés cotées
Recap des sociétés cotées
 
NCFS - C5 T5 PG1-19
NCFS - C5 T5 PG1-19NCFS - C5 T5 PG1-19
NCFS - C5 T5 PG1-19
 
4 q2014stats
4 q2014stats4 q2014stats
4 q2014stats
 

More from LBG

Ink ex pop_up
Ink ex pop_upInk ex pop_up
Ink ex pop_upLBG
 
INKEx FAS placement
INKEx FAS placementINKEx FAS placement
INKEx FAS placementLBG
 
NTFS - Chapter 6 Tables
NTFS - Chapter 6 TablesNTFS - Chapter 6 Tables
NTFS - Chapter 6 TablesLBG
 
NTFS - Chapter 5 Tables
NTFS - Chapter 5 TablesNTFS - Chapter 5 Tables
NTFS - Chapter 5 TablesLBG
 
NTFS - Chapter 3 Tables
NTFS - Chapter 3 TablesNTFS - Chapter 3 Tables
NTFS - Chapter 3 TablesLBG
 
NTFS - Chapter 2 Tables
NTFS - Chapter 2 TablesNTFS - Chapter 2 Tables
NTFS - Chapter 2 TablesLBG
 
NTFS - Chapter 1 Methodology
NTFS - Chapter 1 MethodologyNTFS - Chapter 1 Methodology
NTFS - Chapter 1 MethodologyLBG
 
NTFS - Chapter 1 Background
NTFS - Chapter 1 BackgroundNTFS - Chapter 1 Background
NTFS - Chapter 1 BackgroundLBG
 
NTFS - Table of Contents
NTFS - Table of ContentsNTFS - Table of Contents
NTFS - Table of ContentsLBG
 
NTFS - Summary Report
NTFS - Summary ReportNTFS - Summary Report
NTFS - Summary ReportLBG
 
NS - Food Survey Full Report 2001
NS - Food Survey Full Report 2001NS - Food Survey Full Report 2001
NS - Food Survey Full Report 2001LBG
 
NS - Food Survey Summary 2001
NS - Food Survey Summary 2001NS - Food Survey Summary 2001
NS - Food Survey Summary 2001LBG
 
NCFS - C6 T6 P1to11
NCFS - C6 T6 P1to11NCFS - C6 T6 P1to11
NCFS - C6 T6 P1to11LBG
 
NCFS C4 T4 13to44
NCFS C4 T4 13to44NCFS C4 T4 13to44
NCFS C4 T4 13to44LBG
 
NCFS - Contents
NCFS - ContentsNCFS - Contents
NCFS - ContentsLBG
 
NCFS - Methodology
NCFS - MethodologyNCFS - Methodology
NCFS - MethodologyLBG
 
NCFS - Background
NCFS - BackgroundNCFS - Background
NCFS - BackgroundLBG
 
NCFS - C2 T2 P1to10
NCFS - C2 T2 P1to10NCFS - C2 T2 P1to10
NCFS - C2 T2 P1to10LBG
 
NCFS - C3 T3 P1to6
NCFS - C3 T3 P1to6NCFS - C3 T3 P1to6
NCFS - C3 T3 P1to6LBG
 
E Learning Presentation
E Learning PresentationE Learning Presentation
E Learning PresentationLBG
 

More from LBG (20)

Ink ex pop_up
Ink ex pop_upInk ex pop_up
Ink ex pop_up
 
INKEx FAS placement
INKEx FAS placementINKEx FAS placement
INKEx FAS placement
 
NTFS - Chapter 6 Tables
NTFS - Chapter 6 TablesNTFS - Chapter 6 Tables
NTFS - Chapter 6 Tables
 
NTFS - Chapter 5 Tables
NTFS - Chapter 5 TablesNTFS - Chapter 5 Tables
NTFS - Chapter 5 Tables
 
NTFS - Chapter 3 Tables
NTFS - Chapter 3 TablesNTFS - Chapter 3 Tables
NTFS - Chapter 3 Tables
 
NTFS - Chapter 2 Tables
NTFS - Chapter 2 TablesNTFS - Chapter 2 Tables
NTFS - Chapter 2 Tables
 
NTFS - Chapter 1 Methodology
NTFS - Chapter 1 MethodologyNTFS - Chapter 1 Methodology
NTFS - Chapter 1 Methodology
 
NTFS - Chapter 1 Background
NTFS - Chapter 1 BackgroundNTFS - Chapter 1 Background
NTFS - Chapter 1 Background
 
NTFS - Table of Contents
NTFS - Table of ContentsNTFS - Table of Contents
NTFS - Table of Contents
 
NTFS - Summary Report
NTFS - Summary ReportNTFS - Summary Report
NTFS - Summary Report
 
NS - Food Survey Full Report 2001
NS - Food Survey Full Report 2001NS - Food Survey Full Report 2001
NS - Food Survey Full Report 2001
 
NS - Food Survey Summary 2001
NS - Food Survey Summary 2001NS - Food Survey Summary 2001
NS - Food Survey Summary 2001
 
NCFS - C6 T6 P1to11
NCFS - C6 T6 P1to11NCFS - C6 T6 P1to11
NCFS - C6 T6 P1to11
 
NCFS C4 T4 13to44
NCFS C4 T4 13to44NCFS C4 T4 13to44
NCFS C4 T4 13to44
 
NCFS - Contents
NCFS - ContentsNCFS - Contents
NCFS - Contents
 
NCFS - Methodology
NCFS - MethodologyNCFS - Methodology
NCFS - Methodology
 
NCFS - Background
NCFS - BackgroundNCFS - Background
NCFS - Background
 
NCFS - C2 T2 P1to10
NCFS - C2 T2 P1to10NCFS - C2 T2 P1to10
NCFS - C2 T2 P1to10
 
NCFS - C3 T3 P1to6
NCFS - C3 T3 P1to6NCFS - C3 T3 P1to6
NCFS - C3 T3 P1to6
 
E Learning Presentation
E Learning PresentationE Learning Presentation
E Learning Presentation
 

Recently uploaded

Romantic Opera MUSIC FOR GRADE NINE pptx
Romantic Opera MUSIC FOR GRADE NINE pptxRomantic Opera MUSIC FOR GRADE NINE pptx
Romantic Opera MUSIC FOR GRADE NINE pptxsqpmdrvczh
 
ENGLISH 7_Q4_LESSON 2_ Employing a Variety of Strategies for Effective Interp...
ENGLISH 7_Q4_LESSON 2_ Employing a Variety of Strategies for Effective Interp...ENGLISH 7_Q4_LESSON 2_ Employing a Variety of Strategies for Effective Interp...
ENGLISH 7_Q4_LESSON 2_ Employing a Variety of Strategies for Effective Interp...JhezDiaz1
 
Employee wellbeing at the workplace.pptx
Employee wellbeing at the workplace.pptxEmployee wellbeing at the workplace.pptx
Employee wellbeing at the workplace.pptxNirmalaLoungPoorunde1
 
Field Attribute Index Feature in Odoo 17
Field Attribute Index Feature in Odoo 17Field Attribute Index Feature in Odoo 17
Field Attribute Index Feature in Odoo 17Celine George
 
Solving Puzzles Benefits Everyone (English).pptx
Solving Puzzles Benefits Everyone (English).pptxSolving Puzzles Benefits Everyone (English).pptx
Solving Puzzles Benefits Everyone (English).pptxOH TEIK BIN
 
Types of Journalistic Writing Grade 8.pptx
Types of Journalistic Writing Grade 8.pptxTypes of Journalistic Writing Grade 8.pptx
Types of Journalistic Writing Grade 8.pptxEyham Joco
 
Gas measurement O2,Co2,& ph) 04/2024.pptx
Gas measurement O2,Co2,& ph) 04/2024.pptxGas measurement O2,Co2,& ph) 04/2024.pptx
Gas measurement O2,Co2,& ph) 04/2024.pptxDr.Ibrahim Hassaan
 
Proudly South Africa powerpoint Thorisha.pptx
Proudly South Africa powerpoint Thorisha.pptxProudly South Africa powerpoint Thorisha.pptx
Proudly South Africa powerpoint Thorisha.pptxthorishapillay1
 
Alper Gobel In Media Res Media Component
Alper Gobel In Media Res Media ComponentAlper Gobel In Media Res Media Component
Alper Gobel In Media Res Media ComponentInMediaRes1
 
Full Stack Web Development Course for Beginners
Full Stack Web Development Course  for BeginnersFull Stack Web Development Course  for Beginners
Full Stack Web Development Course for BeginnersSabitha Banu
 
AMERICAN LANGUAGE HUB_Level2_Student'sBook_Answerkey.pdf
AMERICAN LANGUAGE HUB_Level2_Student'sBook_Answerkey.pdfAMERICAN LANGUAGE HUB_Level2_Student'sBook_Answerkey.pdf
AMERICAN LANGUAGE HUB_Level2_Student'sBook_Answerkey.pdfphamnguyenenglishnb
 
ECONOMIC CONTEXT - PAPER 1 Q3: NEWSPAPERS.pptx
ECONOMIC CONTEXT - PAPER 1 Q3: NEWSPAPERS.pptxECONOMIC CONTEXT - PAPER 1 Q3: NEWSPAPERS.pptx
ECONOMIC CONTEXT - PAPER 1 Q3: NEWSPAPERS.pptxiammrhaywood
 
ROOT CAUSE ANALYSIS PowerPoint Presentation
ROOT CAUSE ANALYSIS PowerPoint PresentationROOT CAUSE ANALYSIS PowerPoint Presentation
ROOT CAUSE ANALYSIS PowerPoint PresentationAadityaSharma884161
 
Introduction to AI in Higher Education_draft.pptx
Introduction to AI in Higher Education_draft.pptxIntroduction to AI in Higher Education_draft.pptx
Introduction to AI in Higher Education_draft.pptxpboyjonauth
 
Quarter 4 Peace-education.pptx Catch Up Friday
Quarter 4 Peace-education.pptx Catch Up FridayQuarter 4 Peace-education.pptx Catch Up Friday
Quarter 4 Peace-education.pptx Catch Up FridayMakMakNepo
 
Judging the Relevance and worth of ideas part 2.pptx
Judging the Relevance  and worth of ideas part 2.pptxJudging the Relevance  and worth of ideas part 2.pptx
Judging the Relevance and worth of ideas part 2.pptxSherlyMaeNeri
 

Recently uploaded (20)

Romantic Opera MUSIC FOR GRADE NINE pptx
Romantic Opera MUSIC FOR GRADE NINE pptxRomantic Opera MUSIC FOR GRADE NINE pptx
Romantic Opera MUSIC FOR GRADE NINE pptx
 
ENGLISH 7_Q4_LESSON 2_ Employing a Variety of Strategies for Effective Interp...
ENGLISH 7_Q4_LESSON 2_ Employing a Variety of Strategies for Effective Interp...ENGLISH 7_Q4_LESSON 2_ Employing a Variety of Strategies for Effective Interp...
ENGLISH 7_Q4_LESSON 2_ Employing a Variety of Strategies for Effective Interp...
 
Employee wellbeing at the workplace.pptx
Employee wellbeing at the workplace.pptxEmployee wellbeing at the workplace.pptx
Employee wellbeing at the workplace.pptx
 
Model Call Girl in Bikash Puri Delhi reach out to us at 🔝9953056974🔝
Model Call Girl in Bikash Puri  Delhi reach out to us at 🔝9953056974🔝Model Call Girl in Bikash Puri  Delhi reach out to us at 🔝9953056974🔝
Model Call Girl in Bikash Puri Delhi reach out to us at 🔝9953056974🔝
 
Field Attribute Index Feature in Odoo 17
Field Attribute Index Feature in Odoo 17Field Attribute Index Feature in Odoo 17
Field Attribute Index Feature in Odoo 17
 
Solving Puzzles Benefits Everyone (English).pptx
Solving Puzzles Benefits Everyone (English).pptxSolving Puzzles Benefits Everyone (English).pptx
Solving Puzzles Benefits Everyone (English).pptx
 
Types of Journalistic Writing Grade 8.pptx
Types of Journalistic Writing Grade 8.pptxTypes of Journalistic Writing Grade 8.pptx
Types of Journalistic Writing Grade 8.pptx
 
9953330565 Low Rate Call Girls In Rohini Delhi NCR
9953330565 Low Rate Call Girls In Rohini  Delhi NCR9953330565 Low Rate Call Girls In Rohini  Delhi NCR
9953330565 Low Rate Call Girls In Rohini Delhi NCR
 
Gas measurement O2,Co2,& ph) 04/2024.pptx
Gas measurement O2,Co2,& ph) 04/2024.pptxGas measurement O2,Co2,& ph) 04/2024.pptx
Gas measurement O2,Co2,& ph) 04/2024.pptx
 
Raw materials used in Herbal Cosmetics.pptx
Raw materials used in Herbal Cosmetics.pptxRaw materials used in Herbal Cosmetics.pptx
Raw materials used in Herbal Cosmetics.pptx
 
Proudly South Africa powerpoint Thorisha.pptx
Proudly South Africa powerpoint Thorisha.pptxProudly South Africa powerpoint Thorisha.pptx
Proudly South Africa powerpoint Thorisha.pptx
 
Alper Gobel In Media Res Media Component
Alper Gobel In Media Res Media ComponentAlper Gobel In Media Res Media Component
Alper Gobel In Media Res Media Component
 
Full Stack Web Development Course for Beginners
Full Stack Web Development Course  for BeginnersFull Stack Web Development Course  for Beginners
Full Stack Web Development Course for Beginners
 
AMERICAN LANGUAGE HUB_Level2_Student'sBook_Answerkey.pdf
AMERICAN LANGUAGE HUB_Level2_Student'sBook_Answerkey.pdfAMERICAN LANGUAGE HUB_Level2_Student'sBook_Answerkey.pdf
AMERICAN LANGUAGE HUB_Level2_Student'sBook_Answerkey.pdf
 
ECONOMIC CONTEXT - PAPER 1 Q3: NEWSPAPERS.pptx
ECONOMIC CONTEXT - PAPER 1 Q3: NEWSPAPERS.pptxECONOMIC CONTEXT - PAPER 1 Q3: NEWSPAPERS.pptx
ECONOMIC CONTEXT - PAPER 1 Q3: NEWSPAPERS.pptx
 
ROOT CAUSE ANALYSIS PowerPoint Presentation
ROOT CAUSE ANALYSIS PowerPoint PresentationROOT CAUSE ANALYSIS PowerPoint Presentation
ROOT CAUSE ANALYSIS PowerPoint Presentation
 
Introduction to AI in Higher Education_draft.pptx
Introduction to AI in Higher Education_draft.pptxIntroduction to AI in Higher Education_draft.pptx
Introduction to AI in Higher Education_draft.pptx
 
Rapple "Scholarly Communications and the Sustainable Development Goals"
Rapple "Scholarly Communications and the Sustainable Development Goals"Rapple "Scholarly Communications and the Sustainable Development Goals"
Rapple "Scholarly Communications and the Sustainable Development Goals"
 
Quarter 4 Peace-education.pptx Catch Up Friday
Quarter 4 Peace-education.pptx Catch Up FridayQuarter 4 Peace-education.pptx Catch Up Friday
Quarter 4 Peace-education.pptx Catch Up Friday
 
Judging the Relevance and worth of ideas part 2.pptx
Judging the Relevance  and worth of ideas part 2.pptxJudging the Relevance  and worth of ideas part 2.pptx
Judging the Relevance and worth of ideas part 2.pptx
 

NCFS - C4 T4 P1to12

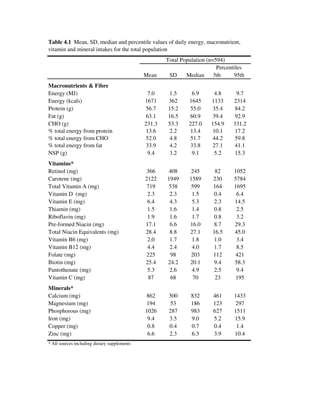
  • 1. Table 4.1 Mean, SD, median and percentile values of daily energy, macronutrient, vitamin and mineral intakes for the total population Total Population (n=594) Percentiles Mean SD Median 5th 95th Macronutrients & Fibre Energy (MJ) 7.0 1.5 6.9 4.8 9.7 Energy (kcals) 1671 362 1645 1133 2314 Protein (g) 56.7 15.2 55.0 35.4 84.2 Fat (g) 63.1 16.5 60.9 39.4 92.9 CHO (g) 231.3 53.3 227.0 154.9 331.2 % total energy from protein 13.6 2.2 13.4 10.1 17.2 % total energy from CHO 52.0 4.8 51.7 44.2 59.8 % total energy from fat 33.9 4.2 33.8 27.1 41.1 NSP (g) 9.4 3.2 9.1 5.2 15.3 Vitamins* Retinol (mg) 366 408 245 82 1052 Carotene (mg) 2122 1949 1589 230 5784 Total Vitamin A (mg) 719 538 599 164 1695 Vitamin D (mg) 2.3 2.3 1.5 0.4 6.4 Vitamin E (mg) 6.4 4.3 5.3 2.3 14.5 Thiamin (mg) 1.5 1.6 1.4 0.8 2.5 Riboflavin (mg) 1.9 1.6 1.7 0.8 3.2 Pre-formed Niacin (mg) 17.1 6.6 16.0 8.7 29.3 Total Niacin Equivalents (mg) 28.4 8.8 27.1 16.5 45.0 Vitamin B6 (mg) 2.0 1.7 1.8 1.0 3.4 Vitamin B12 (mg) 4.4 2.4 4.0 1.7 8.5 Folate (mg) 225 98 203 112 421 Biotin (mg) 25.4 24.2 20.1 9.4 58.3 Pantothenate (mg) 5.3 2.6 4.9 2.5 9.4 Vitamin C (mg) 87 68 70 23 195 Minerals* Calcium (mg) 862 300 832 461 1433 Magnesium (mg) 194 53 186 123 297 Phosphorous (mg) 1026 287 983 627 1511 Iron (mg) 9.4 3.5 9.0 5.2 15.9 Copper (mg) 0.8 0.4 0.7 0.4 1.4 Zinc (mg) 6.6 2.3 6.3 3.9 10.4 * All sources including dietary supplements
  • 2. Table 4.2 Mean, SD, median and percentile values of daily energy, macronutrient, vitamin and mineral intakes for all boys and by age group All Boys 5-12y (n=293) 5-8y (n=145) 9-12y (n=148) Percentiles Percentiles Percentiles Mean SD Median 5th 95th Mean SD Median 5th 95th Mean SD Median 5th 95th Macronutrients & Fibre Energy (MJ) 7.4 1.6 7.3 4.9 10.2 6.8 1.5 6.8 4.6 9.6 8.0 1.6 7.9 5.8 10.5 Energy (kcals) 1759 387 1734 1155 2432 1625 359 1608 1106 2287 1890 369 1871 1383 2495 Protein (g) 59.8 16.4 58.6 36.6 88.1 55.3 15.8 52.5 33.8 82.8 64.2 15.8 63.6 40.9 90.9 Fat (g) 65.5 17.9 63.4 41.2 98.3 60.7 16.7 58.3 37.4 93.2 70.2 17.8 68.6 45.9 101.7 CHO (g) 245.5 56.4 241.1 157.6 341.2 226.4 50.5 227.5 150.9 311.9 264.3 55.7 260.5 167.0 369.0 % total energy from protein 13.6 2.2 13.5 10.0 17.3 13.6 2.0 13.3 10.6 17.1 13.6 2.4 13.8 9.5 18.0 % total energy from CHO 52.5 5.0 52.2 44.7 60.8 52.4 4.8 52.5 44.5 60.2 52.5 5.3 51.9 44.6 61.1 % total energy from fat 33.4 4.4 33.4 26.2 40.8 33.5 4.3 33.3 25.9 40.8 33.3 4.5 33.4 26.2 40.8 NSP (g) 10.0 3.5 9.5 5.3 16.2 9.2 3.0 9.1 4.8 15.4 10.8 3.7 10.2 5.5 17.7 Vitamins* Retinol (mg) 376 387 257 84 1060 379 344 234 80 1085 373 426 272 87 984 Carotene (mg) 2357 2138 1743 196 6818 2134 1918 1641 257 5451 2575 2320 1833 174 7531 Total Vitamin A (mg) 769 544 658 155 1855 735 511 603 178 1603 803 575 716 125 1873 Vitamin D (mg) 2.2 2.2 1.4 0.4 6.4 2.3 2.4 1.3 0.4 7.7 2.2 2.0 1.5 0.3 6.3 Vitamin E (mg) 6.8 4.6 5.4 2.1 15.4 6.5 4.6 5.0 2.0 15.5 7.1 4.6 5.9 2.4 14.9 Thiamin (mg) 1.6 0.6 1.5 0.9 2.6 1.5 0.5 1.4 0.8 2.6 1.7 0.6 1.7 0.9 2.7 Riboflavin (mg) 2.0 0.8 1.9 0.8 3.4 1.9 0.7 1.8 0.8 3.2 2.1 0.8 2.0 0.9 3.7 Pre-formed Niacin (mg) 18.4 6.7 17.1 9.3 30.2 16.9 6.5 15.9 8.7 30.0 19.9 6.5 19.0 10.6 31.2 Total Niacin Equivalents (mg) 30.3 9.1 29.1 17.3 46.7 28.0 8.9 26.7 16.0 45.2 32.6 8.7 31.9 19.9 48.7 Vitamin B6 (mg) 2.1 0.8 2.0 1.0 3.5 2.0 0.8 1.9 0.9 3.4 2.3 0.8 2.2 1.1 3.7 Vitamin B12 (mg) 4.7 2.3 4.4 1.8 8.8 4.3 2.0 4.2 1.5 8.9 5.0 2.5 4.7 2.0 8.7 Folate (mg) 243 103 225 113 451 224 101 203 105 401 261 101 246 126 485 Biotin (mg) 26.9 22.9 21.9 9.3 60.9 26.0 23.8 19.7 9.2 65.4 27.8 22.0 24.2 9.9 57.7 Pantothenate (mg) 5.7 2.2 5.5 2.6 10.4 5.4 2.2 5.1 2.6 9.8 5.9 2.3 5.7 2.6 10.5 Vitamin C (mg) 86 73 68 21 178 81 48 71 21 168 91 90 66 21 220 Minerals* Calcium (mg) 918 318 883 461 1490 869 301 854 452 1453 965 328 910 478 1507 Magnesium (mg) 206 58 196 125 311 190 53 181 118 301 222 59 216 139 339 Phosphorous (mg) 1090 306 1049 651 1624 1022 293 971 630 1615 1156 305 1136 688 1628 Iron (mg) 10.3 3.8 9.8 5.5 17.1 9.3 3.6 8.8 5.2 15.9 11.2 3.8 10.8 5.9 17.8 Copper (mg) 0.8 0.4 0.8 0.4 1.5 0.8 0.4 0.7 0.4 1.5 0.9 0.4 0.9 0.5 1.6 Zinc (mg) 7.1 2.7 6.6 3.8 11.7 6.4 2.5 5.9 3.6 10.7 7.6 2.6 7.1 4.3 12.1 * All sources including dietary supplements
  • 3. Table 4.3 Mean, SD, median and percentile values of daily energy, macronutrient, vitamin and mineral intakes for all girls and by age group All Girls 5-12y (n=301) 5-8y (n=151) 9-12y (n=150) Percentiles Percentiles Percentiles Mean SD Median 5th 95th Mean SD Median 5th 95th Mean SD Median 5th 95th Macronutrients & Fibre Energy (MJ) 6.7 1.3 6.6 4.7 8.9 6.4 1.2 6.2 4.6 8.4 7.0 1.4 6.9 4.6 9.4 Energy (kcals) 1585 314 1562 1107 2125 1517 278 1467 1105 1985 1654 333 1649 1089 2227 Protein (g) 53.7 13.2 52.3 35.2 76.2 51.9 12.8 49.9 34.7 73.0 55.6 13.4 55.2 35.8 80.5 Fat (g) 60.8 14.7 59.3 39.2 86.2 58.2 13.5 56.2 38.8 81.9 63.4 15.4 61.5 39.2 91.1 CHO (g) 217.4 46.0 211.3 152.7 299.8 207.9 40.4 201.0 152.7 288.0 226.9 49.4 223.2 145.1 313.5 % total energy from protein 13.6 2.1 13.4 10.2 17.1 13.7 2.1 13.5 10.3 17.1 13.5 2.2 13.3 9.8 17.2 % total energy from CHO 51.5 4.5 51.2 44.0 59.3 51.5 4.6 51.6 43.4 59.6 51.5 4.5 51.2 44.2 59.1 % total energy from fat 34.4 4.0 34.2 27.9 41.5 34.4 3.9 34.1 27.9 41.0 34.4 4.2 34.3 27.6 41.7 NSP (g) 8.8 2.8 8.4 5.1 14.2 8.5 2.5 8.3 4.7 13.0 9.2 2.9 8.7 5.3 15.2 Vitamins* Retinol (mg) 356 428 239 80 1037 385 511 255 109 1096 326 322 213 72 1047 Carotene (mg) 1892 1719 1449 251 5020 1707 1381 1285 239 4728 2079 1989 1601 251 6341 Total Vitamin A (mg) 671 527 555 164 1603 669 581 555 174 1486 673 469 555 155 1626 Vitamin D (mg) 2.3 2.3 1.5 0.4 6.4 2.2 2.4 1.4 0.4 6.8 2.3 2.3 1.6 0.4 6.4 Vitamin E (mg) 6.1 3.9 5.0 2.3 13.3 5.8 3.7 4.8 2.2 12.8 6.3 4.1 5.2 2.4 13.7 Thiamin (mg) 1.5 2.2 1.3 0.8 2.4 1.3 0.5 1.2 0.7 2.4 1.7 3.0 1.3 0.8 2.4 Riboflavin (mg) 1.8 2.2 1.6 0.7 2.9 1.7 0.6 1.6 0.8 2.9 1.9 3.0 1.5 0.7 3.0 Pre-formed Niacin (mg) 15.9 6.3 14.7 8.5 27.3 15.0 5.8 13.8 8.2 26.7 16.8 6.7 15.6 8.8 28.6 Total Niacin Equivalents (mg) 26.6 8.1 25.2 16.3 42.6 25.3 7.6 24.0 15.7 38.4 28.0 8.4 26.3 17.3 45.0 Vitamin B6 (mg) 1.9 2.2 1.7 1.0 3.2 1.8 0.6 1.7 1.0 2.9 2.1 3.1 1.7 1.1 3.3 Vitamin B12 (mg) 4.2 2.6 3.8 1.5 8.0 4.3 2.7 3.8 1.5 8.0 4.1 2.4 3.7 1.5 8.4 Folate (mg) 207 90 186 111 417 204 84 186 113 378 210 95 186 106 429 Biotin (mg) 23.9 25.4 19.4 9.5 54.0 23.3 26.5 19.1 9.9 52.2 24.4 24.3 19.6 9.1 61.5 Pantothenate (mg) 4.9 2.9 4.4 2.4 8.5 4.7 1.8 4.4 2.5 7.8 5.1 3.8 4.5 2.3 9.0 Vitamin C (mg) 88 63 74 25 203 85 56 73 24 196 92 68 74 25 216 Minerals* Calcium (mg) 808 270 765 438 1297 815 244 795 456 1213 801 295 730 427 1425 Magnesium (mg) 182 44 178 122 266 177 41 173 114 262 188 45 180 126 272 Phosphorous (mg) 963 253 938 594 1445 953 238 935 587 1446 973 268 939 595 1452 Iron (mg) 8.5 2.8 8.0 4.9 13.7 8.4 2.7 7.9 5.0 13.7 8.7 2.9 8.5 4.8 13.8 Copper (mg) 0.8 0.4 0.7 0.4 1.3 0.7 0.4 0.7 0.4 1.2 0.8 0.3 0.8 0.5 1.3 Zinc (mg) 6.2 1.7 5.9 3.9 9.8 6.0 1.7 5.6 3.7 9.9 6.4 1.8 6.3 4.1 9.8 * All sources including dietary supplements
  • 4. Table 4.4 Contribution of food groups (kcal & %) to mean daily energy intakes by sex and age group Total Boys Girls 5-12y All Ages 5-8y 9-12y All Ages 5-8y 9-12y (n=594) (n=293) (n=145) (n=148) (n=301) (n=151) (n=150) kcal % kcal % kcal % kcal % kcal % kcal % kcal % Milk & yoghurt 218 13.1 241 13.8 238 14.7 245 12.8 196 12.4 217 14.4 174 10.4 Sugars, confectionery, preserves & savoury snacks 212 12.7 216 12.3 194 11.9 237 12.6 209 13.2 192 12.7 226 13.7 Meat & meat products 209 12.6 222 12.7 200 12.4 243 13.0 196 12.5 180 11.8 213 13.2 Bread & rolls 200 12.0 209 11.9 198 12.2 221 11.6 191 12.1 174 11.5 209 12.7 Potatoes & potato products 134 8.1 141 8.1 127 7.9 155 8.4 127 8.1 109 7.2 145 8.9 Breakfast cereals 124 7.4 149 8.4 133 8.1 164 8.7 100 6.4 104 6.9 97 5.9 Biscuits, cakes & pastries 109 6.5 116 6.6 113 6.9 119 6.3 101 6.4 97 6.5 106 6.4 Grains, rice, pasta & savouries 93 5.6 89 5.1 72 4.6 106 5.6 96 6.0 87 5.7 105 6.3 Beverages 83 4.9 93 5.2 75 4.7 110 5.8 73 4.7 67 4.4 80 4.9 Fruit & fruit juices 70 4.2 66 3.8 69 4.3 63 3.3 74 4.7 77 5.1 71 4.2 Butter, spreading fats & oils 54 3.2 58 3.2 54 3.2 62 3.2 51 3.2 51 3.3 52 3.1 Creams, ice-creams & chilled desserts 53 3.1 50 2.9 50 3.1 50 2.7 55 3.4 46 3.1 63 3.8 Cheeses 27 1.6 25 1.4 23 1.4 27 1.4 29 1.8 31 2.0 28 1.7 Veg & veg dishes 27 1.6 27 1.5 23 1.4 30 1.6 27 1.7 30 2.0 25 1.5 Soups, sauces & miscellaneous foods 18 1.1 17 0.9 13 0.8 20 1.1 20 1.3 17 1.2 23 1.4 Fish & fish products 16 1.0 17 1.0 18 1.1 15 0.8 15 1.0 15 1.0 14 0.9 Eggs & egg dishes 15 0.9 15 0.8 16 0.9 14 0.7 15 0.9 14 0.9 15 0.9 Nuts & seeds, herbs & spices 5 0.3 6 0.3 4 0.3 7 0.3 3 0.2 4 0.2 3 0.2 Nutritional supplements 1 0.1 2 0.1 3 0.2 0 0.0 1 0.1 2 0.1 0 0.0 Total 1668 100 1757 100 1623 100 1888 100 1582 100 1514 100 1650 100
  • 5. Table 4.5 Mean, SD and median values of daily energy intake (MJ/day) for boys by demographic variables and age group All 5-12y (n=293) 5-8y (n=145) 9-12y (n=148) Mean SD Median n Mean SD Median n Mean SD Median n Location Open country & village 7.5 1.7 7.2 133 7.0 1.7 6.7 65 7.9 1.6 7.8 68 Small town 7.8 1.2 7.7 17 7.0 1.1 7.3 8 8.4 0.8 8.4 9 Large town 7.0 1.7 7.1 67 6.4 1.3 6.5 34 7.7 1.7 7.4 33 City 7.5 1.5 7.6 76 6.9 1.3 6.8 38 8.2 1.4 8.2 38 Education levela n=292 n=144 n=148 Primary 7.2 3.7 9.3 3 0.0 0.0 0.0 0 7.2 3.7 9.3 3 Intermediate 7.7 1.9 7.5 57 7.2 2.2 7.3 25 8.1 1.7 8.2 32 Secondary 7.2 1.6 7.1 113 6.6 1.4 6.6 61 7.9 1.6 7.8 52 Tertiary 7.5 1.4 7.3 119 6.9 1.3 6.8 58 8.0 1.4 7.8 61 Social class b n=287 n=142 n=145 Professional/managerial & technical 7.5 1.6 7.3 144.0 6.9 1.4 6.7 68 8.0 1.6 7.7 76 Non-manual 7.4 1.4 7.3 59.0 6.6 1.1 6.9 26 7.9 1.3 7.9 33 Skilled manual 7.1 1.9 7.0 51.0 6.4 1.8 6.6 30 8.0 1.6 8.4 21 Unskilled/semi-skilled manual 7.4 1.9 7.6 33.0 7.3 1.9 7.3 18 7.5 1.8 8.1 15 a parental education (highest level of education) b social class of family
  • 6. Table 4.6 Mean, SD and median values of daily energy intake (MJ/day) for girls by demographic variables and age group All 5-12y(n=301) 5-8y (n=151) 9-12y (n=150) Mean SD Median n Mean SD Median n Mean SD Median n Location Open country & village 6.6 1.3 6.3 109 6.3 1.1 6.1 52 6.8 1.4 6.8 57 Small town 6.2 1.2 6.0 17 6.1 1.1 6.0 8 6.3 1.3 5.5 9 Large town 6.6 1.3 6.6 80 6.3 1.3 6.0 42 6.9 1.3 7.1 38 City 6.9 1.3 6.7 95 6.6 1.1 6.5 49 7.3 1.5 6.9 46 Education level n=297 n=150 n=147 Primary 7.6 1.3 7.9 5 6.2 0.7 6.2 2 8.5 0.5 8.6 3 Intermediate 6.7 1.5 6.6 44 7.0 1.5 7.0 18 6.4 1.5 6.1 26 Secondary 6.5 1.3 6.4 116 6.2 1.1 5.9 61 6.9 1.4 7.1 55 Tertiary 6.8 1.3 6.6 132 6.4 1.1 6.2 69 7.2 1.4 7.2 63 b Social class n=298 n=150 n=148 Professional Workers 6.7 1.3 6.6 163 6.4 1.1 6.2 80 7.1 1.3 7.1 83 Non-manual Workers 6.7 1.3 6.7 58 6.1 1.1 5.8 27 7.2 1.2 7.5 31 Skilled manual Workers 6.6 1.5 6.1 42 6.3 1.0 6.0 22 6.9 1.8 6.3 20 Unskilled Workers 6.5 1.5 6.1 35 6.7 1.5 6.7 21 6.2 1.5 6.0 14
  • 7. Table 4.7 Contribution of food groups (g & %) to mean daily protein intakes by sex and age group Total Boys Girls 5-12y All Ages 5-8y 9-12y All Ages 5-8y 9-12y (n=594) (n=293) (n=145) (n=148) (n=301) (n=151) (n=150) g % g % g % g % g % g % g % Meat & meat products 18.3 31.7 19.5 31.8 17.5 30.8 21.4 32.7 17.3 31.6 15.9 29.8 18.6 33.5 Milk & yoghurt 10.8 19.1 11.9 19.9 11.4 20.9 12.3 18.8 9.9 18.3 10.8 20.9 8.9 15.6 Bread & rolls 7.0 12.6 7.4 12.6 6.9 12.7 7.8 12.4 6.7 12.5 6.1 11.8 7.3 13.2 Grains, rice, pasta & savouries 3.3 5.9 3.2 5.5 2.6 5.0 3.8 6.0 3.4 6.4 3.1 6.0 3.8 6.7 Breakfast cereals 2.7 4.8 3.3 5.4 2.9 5.2 3.6 5.7 2.2 4.1 2.3 4.4 2.1 3.8 Sugars, confectionery, preserves & savoury snacks 2.5 4.6 2.4 4.3 2.2 4.2 2.7 4.5 2.5 4.9 2.2 4.6 2.7 5.2 Potatoes & potato products 2.4 4.4 2.6 4.6 2.4 4.4 2.8 4.7 2.3 4.3 2.0 3.9 2.6 4.8 Cheeses 1.8 3.1 1.7 2.7 1.6 2.7 1.8 2.6 1.9 3.5 2.1 3.9 1.7 3.0 Biscuits, cakes & pastries 1.6 2.9 1.6 2.9 1.5 2.9 1.7 2.9 1.5 2.9 1.4 2.9 1.6 3.0 Fish & fish products 1.4 2.5 1.4 2.3 1.5 2.5 1.4 2.1 1.4 2.6 1.5 2.8 1.4 2.4 Veg & veg dishes 1.3 2.3 1.3 2.2 1.2 2.2 1.5 2.2 1.3 2.3 1.3 2.6 1.2 2.1 Creams, ice-creams & chilled desserts 0.9 1.7 0.9 1.6 1.0 1.8 0.9 1.3 0.9 1.8 0.8 1.7 1.1 2.0 Eggs & egg dishes 1.0 1.6 1.0 1.5 1.0 1.6 0.9 1.4 1.0 1.8 0.9 1.8 1.0 1.7 Others 1.6 2.9 1.7 2.8 1.7 3.0 1.7 2.6 1.5 2.9 1.4 2.9 1.6 3.0 Total 56.7 100 59.8 100 55.3 100 64.2 100 53.6 100 51.7 100 55.5 100
  • 8. Table 4.8 Contribution of food groups (g & %) to mean daily fat intakes by sex and age group Total Boys Girls 5-12y All Ages 5-8y 9-12y All Ages 5-8y 9-12y (n=594) (n=293) (n=145) (n=148) (n=301) (n=151) (n=150) g % g % g % g % g % g % g % Meat & meat products 11.9 18.9 12.7 19.4 11.5 18.9 13.9 19.9 11.1 18.5 10.2 17.6 12.0 19.4 Milk & yoghurt 11.3 18.0 12.6 19.4 12.4 20.7 12.7 18.2 10.1 16.7 11.2 19.3 8.9 14.0 Sugars, confectionery, preserves & savoury snacks 8.9 14.4 8.8 13.7 7.9 13.3 9.7 14.0 9.0 15.1 8.1 14.2 10.0 15.9 Butter, spreading fats & oils 6.0 9.2 6.4 9.4 5.9 9.3 6.8 9.4 5.6 9.1 5.6 9.3 5.7 8.8 Biscuits, cakes & pastries 4.8 7.6 5.2 7.9 5.0 8.2 5.3 7.5 4.4 7.4 4.2 7.5 4.6 7.3 Potatoes & potato products 4.6 7.3 4.7 7.3 4.1 6.9 5.3 7.6 4.4 7.2 3.6 6.2 5.2 8.3 Creams, ice-creams & chilled desserts 2.7 4.3 2.5 3.9 2.5 4.2 2.5 3.6 2.9 4.7 2.4 4.2 3.4 5.2 Grains, rice, pasta & savouries 2.7 4.3 2.6 4.0 2.0 3.5 3.2 4.5 2.8 4.5 2.4 4.2 3.1 4.9 Bread & rolls 2.3 3.7 2.3 3.5 2.2 3.6 2.4 3.4 2.4 3.9 2.1 3.7 2.6 4.1 Cheeses 2.2 3.3 2.0 2.9 1.8 2.8 2.2 3.0 2.4 3.7 2.4 4.0 2.3 3.5 Eggs & egg dishes 1.2 1.8 1.2 1.8 1.3 2.0 1.2 1.6 1.2 1.9 1.2 1.9 1.3 1.8 Breakfast cereals 1.1 1.7 1.3 1.9 1.2 1.9 1.4 1.9 0.9 1.5 1.0 1.7 0.9 1.3 Soups, sauces & miscellaneous foods 1.0 1.7 0.9 1.3 0.7 1.1 1.1 1.6 1.2 1.9 1.1 1.9 1.3 2.0 Veg & veg dishes 0.8 1.3 0.8 1.1 0.5 0.8 1.0 1.4 0.9 1.5 1.0 1.8 0.8 1.3 Others 1.5 2.4 1.6 2.5 1.6 2.7 1.6 2.3 1.4 2.4 1.5 2.5 1.3 2.2 Total 63.0 100 65.4 100 60.6 100 70.2 100 60.7 100 58.0 100 63.3 100
  • 9. Table 4.9 Contribution of food groups (g & %) to mean daily carbohydrate intakes by sex and age group Total Boys Girls 5-12y All Ages 5-8y 9-12y All Ages 5-8y 9-12y (n=594) (n=293) (n=145) (n=148) (n=301) (n=151) (n=150) g % g % g % g % g % g % g % Bread & rolls 40.3 17.5 42.4 17.3 40.0 17.7 44.8 16.9 38.2 17.7 34.8 16.8 41.7 18.5 Sugars, confectionery, preserves & savoury snacks 31.6 13.5 32.8 13.2 29.5 12.7 36.0 13.6 30.4 13.9 28.4 13.6 32.4 14.2 Breakfast cereals 27.1 11.5 32.4 13.0 28.9 12.6 35.9 13.5 21.8 10.0 22.6 10.8 21.1 9.2 Potatoes & potato products 22.2 9.8 23.6 9.8 21.5 9.6 25.6 10.0 20.9 9.8 18.3 8.9 23.4 10.6 Beverages 21.3 9.0 23.9 9.4 19.4 8.5 28.3 10.4 18.7 8.5 17.1 8.2 20.3 8.9 Milk & yoghurt 19.4 8.5 21.4 8.9 21.3 9.6 21.5 8.2 17.4 8.2 19.4 9.5 15.4 6.8 Fruit & fruit juices 17.3 7.5 16.2 6.6 16.9 7.5 15.5 5.8 18.3 8.3 19.0 9.0 17.6 7.5 Biscuits, cakes & pastries 15.7 6.8 16.7 6.9 16.2 7.2 17.1 6.6 14.7 6.8 14.1 6.8 15.3 6.8 Grains, rice, pasta & savouries 14.6 6.4 14.0 5.8 11.5 5.3 16.4 6.3 15.3 7.0 14.1 6.8 16.5 7.2 Meat & meat products 7.5 3.4 7.8 3.3 7.2 3.3 8.4 3.3 7.3 3.4 6.5 3.2 8.0 3.7 Creams, ice-creams & chilled desserts 6.4 2.8 6.3 2.6 6.3 2.8 6.4 2.4 6.5 3.0 5.6 2.7 7.5 3.3 Veg & veg dishes 3.8 1.6 3.8 1.6 3.5 1.5 4.2 1.6 3.8 1.7 4.2 1.9 3.4 1.5 Others 3.8 1.7 3.9 1.6 3.9 1.7 3.9 1.5 3.7 1.7 3.4 1.7 4.0 1.8 Total 230.9 100 245.3 100 226.0 100 264.1 100 216.9 100 207.5 100 226.4 100
  • 10. Table 4.10 Mean, SD and median values of macronutrient intakes for boys and girls by geographical location Open country & village Small town Large town City Mean SD Median Mean SD Median Mean SD Median Mean SD Median Boys n=133 n=17 n=67 n=76 Protein (g) 62.3 16.9 59.5 60.7 11.6 60.8 55.1 15.8 54.7 59.5 16.4 58.0 Fat (g) 66.8 19.7 64.3 69.1 12.0 71.9 61.4 16.6 60.1 66.1 16.3 64.2 Carbohydrate (g) 244.3 58.8 238.7 259.4 44.5 257.1 236.9 59.8 231.1 252.3 50.8 248.0 % total energy from protein 14.1 2.2 13.9 13.1 1.6 13.0 13.2 2.2 13.0 13.2 2.2 13.0 % total energy from fat 33.7 4.8 33.9 33.6 2.7 33.6 33.0 4.3 32.9 33.1 4.1 32.8 % total energy from carbohydrate 51.8 5.3 51.2 52.6 3.8 52.7 53.2 5.2 53.2 53.0 4.5 53.4 Girls n=109 n=17 n=80 n=95 Protein (g) 53.4 12.6 52.1 49.8 11.5 50.2 54.6 13.9 54.8 54.1 13.7 50.8 Fat (g) 60.0 14.9 58.8 57.2 12.7 52.9 59.8 14.7 58.6 63.2 14.6 61.7 Carbohydrate (g) 215.7 47.6 206.9 199.6 41.6 180.3 212.8 43.0 207.2 226.4 46.4 221.7 % total energy from protein 13.7 2.3 13.5 13.5 1.6 13.1 14.0 2.1 13.9 13.1 1.9 13.2 % total energy from fat 34.3 4.6 34.0 35.0 3.9 33.6 34.3 3.5 34.1 34.5 3.8 34.7 % total energy from carbohydrate 51.6 5.1 51.3 50.9 4.1 51.0 51.2 4.0 50.9 51.7 4.3 51.6
  • 11. Table 4.11 Mean, SD and median values of macronutrient intakes for boys and girls by level of education of parents Intermediate Secondary Tertiary Mean SD Median Mean SD Median Mean SD Median Boys n=60 n=113 n=119 Protein (g) 61.3 19.9 60.0 57.5 15.9 55.2 61.4 14.7 60.6 Fat (g) 67.6 19.5 67.2 63.6 18.9 60.3 66.3 16.0 64.4 Carbohydrate (g) 256.6 70.0 249.1 239.2 53.1 236.1 245.6 51.3 243.7 % total energy from protein 13.4 2.3 13.0 13.5 2.3 13.3 13.9 2.0 13.7 % total energy from fat 33.3 4.5 33.1 33.3 4.5 33.1 33.6 4.3 34.0 % total energy from carbohydrate 52.8 5.0 52.5 52.7 5.2 52.7 52.0 4.8 51.6 Girls n=49 n=116 n=132 Protein (g) 53.7 16.6 51.5 52.8 12.6 51.8 54.3 12.0 53.3 Fat (g) 62.9 16.2 62.9 59.3 14.5 57.0 61.3 14.4 59.2 Carbohydrate (g) 217.8 52.4 219.1 212.6 43.2 203.9 221.8 46.2 216.1 % total energy from protein 13.3 2.2 13.2 13.6 1.9 13.5 13.6 2.2 13.4 % total energy from fat 35.3 4.8 35.5 34.3 4.0 34.7 34.2 3.8 33.7 % total energy from carbohydrate 50.9 5.5 51.3 51.6 4.3 51.1 51.7 4.4 51.6
  • 12. Table 4.12 Mean, SD and median values of macronutrient intakes for boys and girls by social class Professional Workers Non-Manual Skilled Manual Non-skilled Mean SD Median Mean SD Median Mean SD Median Mean SD Median Boys n=144 n=59 n=51 n=33 Protein (g) 62.1 16.3 60.8 60.4 14.9 58.3 55.2 17.9 51.8 55.1 15.3 51.9 Fat (g) 67.0 18.0 64.5 64.6 15.8 63.3 62.7 20.2 60.8 63.4 17.3 63.4 Carbohydrate (g) 246.0 53.0 239.5 245.3 49.0 240.1 235.2 63.9 242.1 256.6 69.1 261.0 % total energy from protein 13.9 2.1 13.8 13.8 2.4 13.8 13.2 2.2 13.1 12.6 2.3 12.4 % total energy from fat 33.7 4.1 34.2 33.1 4.1 32.7 33.6 5.5 34.0 32.2 4.3 32.3 % total energy from carbohydrate 51.9 4.6 51.5 52.6 4.9 52.7 52.7 5.9 53.3 54.6 5.1 53.5 Girls n=163 n=58 n=42 n=35 Protein (g) 54.4 11.8 53.8 54.7 12.1 55.7 50.6 15.3 46.6 52.8 17.8 49.8 Fat (g) 60.9 13.9 59.4 61.2 15.4 60.9 61.6 16.2 57.5 59.0 15.6 57.2 Carbohydrate (g) 219.1 46.1 214.9 215.6 42.1 214.3 214.4 47.3 200.5 214.8 49.9 207.1 % total energy from protein 13.7 2.0 13.6 13.8 2.1 13.5 12.8 2.0 12.5 13.5 2.5 13.1 % total energy from fat 34.3 4.0 33.9 34.5 4.2 34.8 35.2 4.1 35.5 34.1 4.1 34.2 % total energy from carbohydrate 51.5 4.5 51.4 51.1 4.1 50.6 51.4 4.7 51.4 51.9 5.2 51.6