Segmentation and Visualization of Human Coronary Artery Trees from CTA Datasets
wbc_rbc
1. Separation of WBC and RBC Using
Colour Based Segmentation
Technique
Litu Rout∗
Indian Institute of Space Science and Technology
liturout1997@gmail.com
October 15, 2016
Abstract
Blood cell segmentation and identification is important when blood is used as a health indicator.The
contents of blood in particular white blood cells and red blood cells determine a person’s health.When large
samples are taken for identification, it becomes tedious for the examiner to distinguish between these cells
and make a count of it.In this report I have proposed an efficient algorithm to separate WBC and RBC
from blood samples.The image processing toolbox in MATLAB has been used for the implementation of this
algorithm.This report also gives a brief description about the counting algorithm.The whole code can be found
in the appendix section.
I. Introduction
Human blood cells consists of mainly
three types of blood cells: White Blood
Cells(WBCs),Red Blood Cells(RBCs) and
Platelets. The counting of these blood cells is
known as a complete blood count and provides
information such as the lack or overabundance
of certain cells which could indicate certain dis-
eases such as leukemia or anemia.The count of
WBCs helps to find out the disease a person
might have.This is because WBCs are produced
as reaction to the disease.So making a count of
over or under production of WBCs will help
to find out the disease of a person.Since RBCs
carries oxygen from the lungs and carbon diox-
ide to the lungs, RBCs are good indicators of
oxygen level in body.
∗Litu Rout,Bachelor of Technology,Department of
Avionics,IIST
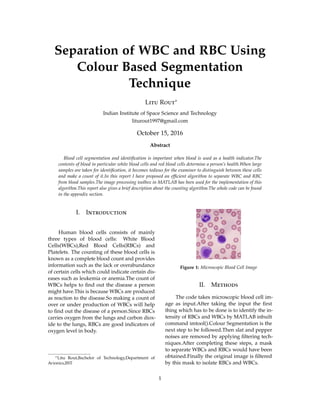
Figure 1: Microscopic Blood Cell Image
II. Methods
The code takes microscopic blood cell im-
age as input.After taking the input the first
thing which has to be done is to identify the in-
tensity of RBCs and WBCs by MATLAB inbuilt
command imtool().Colour Segmentation is the
next step to be followed.Then slat and pepper
noises are removed by applying filtering tech-
niques.After completing these steps, a mask
to separate WBCs and RBCs would have been
obtained.Finally the original image is filtered
by this mask to isolate RBCs and WBCs.
1
2. Indian Institute of Space Science and Technology
All the steps are clearly mentioned with the ex-
pected output images in the Algorithm section
below.
i. Algorithm
• Taking microscopic blood cell image an
input.
Figure 2: MRI of Brain
• Colour Segmentation : Before doing
segmentation the original image is anal-
ysed by using MATLAB inbuilt function
imtool().WBCs are larger in area and most
of the pixels present inside these cells
belong to the blue plane in RGB colour
space.That’s why these can be isolated by
subtracting the pixels which belong to red
and green plane from the blue plane.Since
WBCs also contain some pixels from red
and green plane too, R and G planes
aren’t subtracted completely from the B
plane.In my case 0.5 saturation seems to
work.
Figure 3: Extraction of Blue Plane Pixels
On the blue plane the WBCs can be
isolated by Applying Otsu’s thresholding.
Otsu’s thresholding is an efficient algo-
rithm to separate background pixels from
foreground.
Figure 4: Otsu’s Thresholding
• Image Filtering : In this process the salt
and pepper noises are eliminated by
removing all connected objects within 200
pixels.The number of pixels to be used
varies from image to image.200 pixels
seems to work in my case.
Figure 5: Removing Connected Objects
Then the noise present within the region
of interest(ROI) is removed by filling
these holes.MATLAB inbuilt function
imfill() is used for this purpose.BW2 =
imfill(BW,’holes’) fills holes in the binary
image BW. A hole is a set of background
pixels that cannot be reached by filling
in the background from the edge of the
image.
2
3. Indian Institute of Space Science and Technology
Figure 6: Removing Noise Within ROI
• The mask is dilated to get rid of the rest
of the purple surroundings.This helps to
remove the small abrupt changes at the
boundary of ROI by choosing a suitable
structure element,in this case a disk with
radius 5 .For different shapes of the images
different dilution techniques are adopted
for performance enhancement.
Figure 7: Dilation
• Reconstruction : After dilating the
mask,a 3 dimensional mask of iden-
tical size as the original image is
created.MATLAB function repmat() helps
in replicating matrix of specific dimen-
sions.The filtered image is reconstructed
by multiplying the original image with
the 3 dimensional mask created in the
above step.This mask helps to eliminate
the RBCs and inverting this mask would
help to eliminate the WBCs from the
original microscopic blood cell image.
Figure 8: Removed WBCs
Figure 9: Removed RBCs
III. Results and Discussion
After following the procedure as mentioned
above, WBCs and RBCs are isolated from the
microscopic blood cell image.
Figure 10: Isolated WBCs Image
The number of WBCs can also be counted by
measuring the total area of the black and white
mask and diving it with area of each WBCs.In
this process each WBCs are assumed to be cir-
cular.This gives an approximate count of the
number of WBCs present in the blood cell.The
diameter of the Cells is taken as the sample
mean of the diameters which gives a better ap-
proximation for the calculation of number of
WBCs.MATLAB function imdistline() helps to
find diameter of each pixel.
3
4. Indian Institute of Space Science and Technology
Figure 11: Isolated RBCs Image
Future work will be based on the op-
timization of this counting algorithm.The
counting algorithm provided in the appendix
section seems to work for the non overlapping
and approximately circular shaped objects.
The code lets user to find out diameter of these
cells by adjusting the length of the marker
and select the most appropriate diameter.The
result obtained from this algorithm is shown
below as such.
Area of each cell is 7.932718e+03
Total Area of the Cells is 2.320875e+04
Number fo Cells found is 3
References
1. Sadeghian F, Seman Z, Ramli A R,
Abdul Kahar B H and Saripan M I (2009),
â ˘AIJA Framework For White Blood Cell
Segmentation In Microscopic Blood Im-
ages Using Digital Image Processing.,â ˘A˙I
Biological procedures online, Vol. 11, No.
1, pp. 196- 206.
2. Hiremath P S (2010), â ˘AIJAuto-
mated Identification and Classification
of White Blood Cells ( Leukocytes ) in
Digital Microscopic Imagesâ ˘A˙I, IJCA
Special Issue on Recent Trends in Image
Processing and Pattern Recognition
(RTIPPR), Vol. 2, pp. 59-63.
3. Poomcokrak J and Neatpisarnvanit C
(2008), â ˘AIJRed Blood Cells Extraction
and Counting,â ˘A˙I The 3rd International
Symposium on Biomedical Engineering,
pp. 199-203.
4. Zamani F, SafaBakhsh R. Detect
the white blood cells in microscopic
images of human healthy blood, MSc
Thesis 101321, Faculty of Electrical and
Computer. Tehran, Iran: Amir Kabir
University; 2007.
5. Nguyen HT, Worring M, van den Boom-
gaard R. Watersnakes: Energy-driven
watershed segmentation. IEEE Trans Pat-
tern Anal Mach Intell. 2003;25:330â ˘A¸S42.
6. Safabakhsh R, Zamani F. â ˘AIJA
robust multi-orientation Gabor based
system for discriminating touching
white and red cells in microscopic blood
imageâ ˘A˙I, computer engineering and IT
Dpt. Tehran, Iran: AmirKabir University
of Technology; 2003.
7. Ray N, Acton ST. Motion gradi-
ent vector flow: An external force for
tracking rolling leukocytes with shape
and size constrained active contour. IEEE
Trans Med Imaging. 2004;23:1466â ˘A¸S78.
[PubMed]
8. Ray N, Acton ST. Tracking rolling
leukocytes with motion gradient vector
flow, accepted in Asilomar conference on
signals, systems, and computers. Pacific
Grove, CA, IEEE, conference, 1948:1952.
2003;2
9. Rezatofighia SH, Zadeha HS. Au-
tomatic recognition of five types of
white blood cells in peripheral blood.
Comput Med Imaging and Graph.
2011;35:333â ˘A¸S43. [PubMed]
4
6. Indian Institute of Space Science and Technology
imshow(img_wbc);
%% counting
figure(8);
imshow(bw3);
dist=imdistline();
pause();
api=iptgetapi(dist);
d=api.getDistance();
api.delete();
area_of_each_cell=pi*(d/2)^2;
fprintf('Area of each cell is %d rn',area_of_each_cell);
total_area=bwarea(bw3);
fprintf('Total Area of the Cells is %d rn',total_area);
num_of_cells=total_area/area_of_each_cell;
fprintf('Number fo Cells found is %d rn',round(num_of_cells));
%%
6