Raman microscopy and x ray diffraction a combined study of fibrillin-rich mic...
Optimization of Fibronectin Micro-contact Printing Protocol for Potential
1. Optimization of Fibronectin Micro-contact Printing Protocol
for Potential Nanoparticle Uptake Study
Laura A. McGimpsey1, Pouria Fattahi1, Justin L. Brown1, Peter J. Butler1
1The Pennsylvania State University, University Park, PA
ABSTRACT
According to the Center for Disease Control (CDC), heart and vascular diseases are
the leading causes of death in the United States. Vascular disease is the result of
atherosclerosis, which occurs when a fatty substance called plaque builds-up within
the endothelium along artery walls. It is now recognized that hemodynamic forces
arising in areas of disturbed laminar blood flow, located at the junctions of vessels,
elicit changes in endothelial cells that aid plaque build-up. These forces produce
changes in the normal mechanical properties of the endothelial cells lining blood
vessels. Recently, it has been shown that these changes in mechanical stiffness of
cells can alter the cells’ ability to uptake nanoparticles1.
Since nanoparticles are a potential approach for drug delivery to diseased tissues, the
work outlined here explores some of the mechanisms by which cell mechanics
influences nanoparticle uptake. Specifically, the goal of this project is to develop a
method of micro-contacting patterning to induce cause cells to adopt prescribed
aspect ratios and spread area that are characteristic of diseased and healthy
endothelial cells. Having achieved this, this protocol can be adopted in future
nanoparticle studies.
DISCUSSION
REFERENCES
1 Huang, C., PJ Butler, S. Tong, HS Muddana, and S. Zhang. "Substrate Stiffness
Regulates Cellular Uptake of Nanoparticles.“ National Center for Biotechnology
Information. U.S. National Library of Medicine, 10 Apr. 2013. Web. 29 July 2016.
Acknowledgements:
This Undergraduate Research Experience for Undergraduates is funded by the
American Heart Association, Grant #16UFEL27930008
METHODS
Micro-contacting Printing (µCP) was used to test the hypothesis that unstressed
Human Aortic Endothelial Cells (HAEC) are able to uptake nanoparticles more readily
than stressed HAEC. The polydimethylsiloxane (PDMS) stamps used in this study’s
µCP protocol standardized the following aspect ratios:
The lower aspect ratios were meant to mimic the unstressed HAEC. Conversely, the
higher aspect ratios were meant to mimic stressed HAEC. Each aspect ratio “island”
had an area of 2500µm2. Area was standardized in order to ensure that future
nanoparticle uptake comparisons would be dependent only on aspect ratio
variations.
PDMS stamps were coated with oxygen plasma and sterilized with ultraviolet (UV)
light prior to stamping. HiLyte Fluor™ 488 Fluorescent Fibronectin (FFN) was used as
ink during stamping. The FFN was diluted and stored in -40⁰C, according to supplier’s
instructions (Cytoskeleton Inc., Denver, CO). 200µL of FFN was added to the
patterned side of each stamp and let to sit for approximately 2 hours. During that
time, the stamps were covered to minimize the effect of the possible FFN
photobleaching. The FFN was removed and the stamps were washed with PBS 1x.
Once the stamps were completely dry, each was placed face down on a substrate.
Substrates were spin coated with PDMS and sterilized with UV light prior to stamping.
The optimization variable was the weight that was added atop the PDMS stamp at
the time of stamp-substrate contact, which lasted about 1 minute. The stamps were
then rinsed with PBS 1x to remove excess FFN. The weights tested were 15, 20, 25,
and 30 grams. Weights were created by adding appropriate amounts of water to
plastic test tubes.
The stamped PDMS substrates were imaged using a fluorescent microscope (Leica
DM5500 upright microscope, Buffalo Groove, IL) to qualitatively test for the presence
of FFN pattern. CellProfiler software (Broad Institute, Cambridge, MA) was used to
quantitatively analyze FFN intensity and area covered as a means of discovering each
weights’ effectiveness.
Figure 2. Average Fluorescent Fibronectin Intensity measured with CellProfiler and averaged for each aspect ratio. Images
were enhanced with ImageJ for more defined perimeters. Standard deviations were taken with variable "n“ values.
RESULTS
• Average FFN intensity and percentage of area covered data was collected using
CellProfiler software
• 15 grams and 20 grams weights had the most uniform intensity across all aspect
ratios
• The heaviest weight, 30 grams, produced the most intense FFN stamps
• For relative percentage of area covered, 25g and 30g stamps went over 100% area
covered, thus not giving the correct expected area of 2500μm2
• 15g and 20g fluctuated around 100% area. 15g percent of area covered stayed
below 100% and 20g area values averaged closer to 100%
RESULTS
CONCLUSIONS
The results indicate that the 20 gram weight is the best to use in μCP protocol
because it provides the most constant FFN intensity (Figure 1) and also has the most
accurate percent of area covered over 100% for the desired 2500 μm2 area (Figure 2).
This weight will be adopted into the protocol in Dr. Butler’s Mechanobiology
Laboratory at the Pennsylvania State University. Future studies will focus on cell
culture using patterns made with 20 gram weights and analyze the effect of cell
cytoskeletal alignments on the uptake of nanoparticles in HAEC, with the ultimate
goal of treating atherosclerosis.
0
200
400
600
800
1000
1200
1400
1600
1800
Circle 1 1.5 2 4 8 16
Intensity
Aspect Ratios
FFN Intensity vs. Aspect Ratios for Each Weight
15 grams 20 grams 25 grams 30 grams
0
50
100
150
200
250
15 g 20 g 25 g 30 g
Percentage
Weights
Percent Area Covered vs. Weights for Each Aspect Ratio
Circle 1 1.5 2 4 8 16
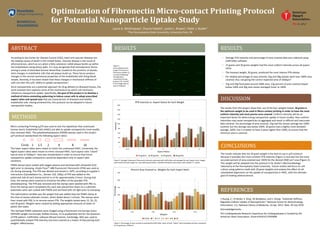
Figure 1.
Immunofluorescent
image of Fluorescent
Fibronectin pattern as
a result of following
the 20g Micro-
contacting Printing
protocol. All “islands“
in this image have an
area of 2500μm2
Figure 3. Percentage of area covered as analyzed by CellProfiler. Areas of each “island” were evaluated and then compared
to the goal area, 2500µm2.
The results from this project show that, out of the four weights tested, 20 grams is
the optimum weight to be used in Micro-contact printing in order to have the most
uniform intensity and most precise area covered. Uniform intensity will be an
important factor for determining nanoparticle uptake in future studies. Non-uniform
intensities may cause nanoparticles to aggregate and result in difficult and inaccurate
data retrieval. For percentage of area covered, 15g had the closest average too 100%
covered, but the average was below 100%. 20 grams had a slightly more deviated
average, 105%, but it is better to have a value higher than 100%, to ensure that the
minimum area is covered.