SlideShare a Scribd company logo
1 of 1
Download to read offline
Statistical Tests and Results
Determining a Relationship between Soil Moisture and Maximum
Temperatures
Parker Malek, Atmospheric Sciences, Dr. Abigail Swann, Atmospheric Sciences, Biology
Motivation
Soil moisture is a variable that is difficult to quantify due to its large spatial heterogeneity,
its lack of extensive ground-based measurement networks, and its strong dependence on
many meteorological and biological factors. However, records of soil moisture are essential
for developing more accurate climate models and providing constraints on processes
controlling plant productivity and heat fluxes. My research aims to further develop these
records by determining whether maximum temperatures can be related to the amount of
soil moisture in a particular region. We hypothesize that the variability of maximum
temperatures in vegetated regions is determined by the amount of soil water available
there. By analyzing latent heat, temperature, and soil moisture data collected from
various flux measurement towers around the United States, we show that days with
relatively low latent heat flux values occurring at high maximum temperatures have
statistically drier soils compared to days where high latent heat flux values occur at high
maximum temperatures.
1.) S. Seneviratne, T. Corti, E. Davin, M. Hirschi, E. Jaeger, I. Lehner, B. Orlowsky, and A. Teuling. Investigating soil moisture–climate interactions in a changing climate: A review. Earth-Science Reviews, 99(3):125–161, 2010.
2.) Bonfils, C., A. Angert,C. C. Henning, S. Biraud, S. C. Doney, and I. Fung (2005), Extending the record of photosynthetic activity in the eastern United States into the presatellite period using surface diurnal temperature range, Geophys. Res. Lett., 32, L08405, doi:10.1029/ 2005GL022583.
3.) http://ameriflux.ornl.gov/
Why Use Latent Heat?
• Previous studies have shown that plant transpiration alone accounts for more than 80%
of evapotranspiration (Seneviratne et al. 2010).1
• This assumption allows us to pair soil moisture with a variable that is more consistently
measured and a known control of temperature.
Fig 1: Simple visualization of stomatal
conductance, the primary mechanism for plant
transpiration.
Locations
• Three sites chosen based on the abundance and type of vegetation, the availability of
water in the region, and the availability of data at each site.
• Large evergreen needleleaf forests
• Data is recorded through various eddy covariance techniques and is gathered from
Ameriflux, a flux measurement network.3
Temperature Data
• Temperature data organized into time series consisting of daily
maximums.
• Created time series of maximum temperatures selected every 5
days to reduce masking of vegetation from clouds (Bonfils et
al. 2005).2
Fig 3: Map of the
western United States
with labels pinpointing
the location of the
three sites being
analyzed. State names
and borders are
outlined in white.
Fig 4: Visualization of
method used to
determine 5 day
maximum temperatures.
Adding Latent Heat and Soil Moisture
• Time series of 5 day maximum temperatures is correlated with
coincident time series of average daytime latent heat flux
values and average volumetric soil water content values.
Fig 5-7: Correlation plots
of 5 day maximum
temperatures vs.
average daily latent
heat fluxes on the same
day. Colors correspond to
average volumetric soil
water content. Days
chosen for analysis are
limited by the growing
season (April 1st –
November 1st).
Fig 5: Niwot Ridge
Fig 6: Blodgett Forest
Fig 7: Wind River
Fig 8: Visualization of
the buffer regions used
for statistical tests
comparing maximum
temperatures to soil
moisture.
Unexpected
Expected
Expected
Conclusion
• Low latent heat flux values occurring at high maximum
temperatures have statistically drier soils compared to days
where high latent heat flux values occur at high maximum
temperatures.
• Hypothesis only works well in wet environments that are
both rarely limited by water or energy (see figure 2).
Fig 2: Definition of soil moisture regimes
and corresponding evapotranspiration
regimes. EF denotes evaporative fraction.1
Linear Regression Model 1
𝐿𝑎𝑡𝑒𝑛𝑡 𝐻𝑒𝑎𝑡 𝐹𝑙𝑢𝑥 = 𝛼𝑥1 + 𝛽𝑥2
Table 1: Mean
values of soil
water content
above and
below original
linear
regression line
with
associated p
value for each
site.
Results show that high latent heat fluxes occurring at high maximum
temperatures exhibit larger average soil water amounts for Niwot Ridge and
Blodgett Forest with the opposite being true for Wind River.
Linear Regression Model 2
𝐿𝑎𝑡𝑒𝑛𝑡 𝐻𝑒𝑎𝑡 𝐹𝑙𝑢𝑥 = 𝛾𝑥3
𝑥1 = 5 day maximum temperature 𝑥3 = soil water content𝑥2 = precipitation
Table 2: R2 values associated with the linear regressions of latent heat flux and its
corresponding residuals as a function of either 5 day maximum temperatures and
precipitation or soil moisture.
Linear regression models of latent heat flux as a function of maximum
temperature and precipitation are found to be statistically more effective at
capturing the latent heat flux variable when compared to linear regression
models of latent heat flux as a function of soil moisture alone.
Maximized signal from
vegetation expected
in transitional phase
SoilWaterContent(%)SoilWaterContent(%)SoilWaterContent(%)
Initial
Hypothesis: high
latent heat
fluxes occurring
at high
maximum
temperatures
are associated
with days where
the soil is wet
WET SOILS
DRY SOILS
DRY SOILS?
DRY SOILS
WET SOILS
WET SOILS?
Areas of dry and
wet soils less
distinguishable in
Wind River plot
Residual Calculation
𝐿𝐻𝐹𝑅 = 𝐿𝑎𝑡𝑒𝑛𝑡 𝐻𝑒𝑎𝑡 𝐹𝑙𝑢𝑥 𝑂𝑏𝑠 − 𝐿𝑎𝑡𝑒𝑛𝑡 𝐻𝑒𝑎𝑡 𝐹𝑙𝑢𝑥 (𝑀𝑜𝑑𝑒𝑙)
EF ~ Latent Heat

More Related Content

What's hot

Hb2015 farrell-and-jo-sapflow-np
Hb2015 farrell-and-jo-sapflow-npHb2015 farrell-and-jo-sapflow-np
Hb2015 farrell-and-jo-sapflow-npmelnhe
 
Evapotranspiration: Pitfalls to Avoid and Why It’s Easier Than You Think
Evapotranspiration: Pitfalls to Avoid and Why It’s Easier Than You ThinkEvapotranspiration: Pitfalls to Avoid and Why It’s Easier Than You Think
Evapotranspiration: Pitfalls to Avoid and Why It’s Easier Than You ThinkMETER Group, Inc. USA
 
NDGISUC2017 - Estimate Water Surface Temperature from the Landsat 8 TIR Bands
NDGISUC2017 - Estimate Water Surface Temperature from the Landsat 8 TIR BandsNDGISUC2017 - Estimate Water Surface Temperature from the Landsat 8 TIR Bands
NDGISUC2017 - Estimate Water Surface Temperature from the Landsat 8 TIR BandsNorth Dakota GIS Hub
 
Remote Sensing of Urban Heat Islands
Remote Sensing of Urban Heat IslandsRemote Sensing of Urban Heat Islands
Remote Sensing of Urban Heat IslandsChristopher Martin
 
StreamFlow Variability of 21 Watersheds, Oregon
StreamFlow Variability of 21 Watersheds, OregonStreamFlow Variability of 21 Watersheds, Oregon
StreamFlow Variability of 21 Watersheds, OregonDonnych Diaz
 
Evaluating Satellite Precipitation Error Propagation in Runoff Simulations of...
Evaluating Satellite Precipitation Error Propagation in Runoff Simulations of...Evaluating Satellite Precipitation Error Propagation in Runoff Simulations of...
Evaluating Satellite Precipitation Error Propagation in Runoff Simulations of...Yiwen Mei
 
Dr. Jack Morgan - Grazinglands and Global Climate Change: What is the Science...
Dr. Jack Morgan - Grazinglands and Global Climate Change: What is the Science...Dr. Jack Morgan - Grazinglands and Global Climate Change: What is the Science...
Dr. Jack Morgan - Grazinglands and Global Climate Change: What is the Science...John Blue
 
11-GISS-DeJesus_Polanco_Quispe
11-GISS-DeJesus_Polanco_Quispe11-GISS-DeJesus_Polanco_Quispe
11-GISS-DeJesus_Polanco_QuispeNicolas DeJesus
 
Ajayi_M_Senior Thesis Poster
Ajayi_M_Senior Thesis PosterAjayi_M_Senior Thesis Poster
Ajayi_M_Senior Thesis PosterMoyo Ajayi
 
Late Noachian Icy Highlands climate model: Exploring the possibility of trans...
Late Noachian Icy Highlands climate model: Exploring the possibility of trans...Late Noachian Icy Highlands climate model: Exploring the possibility of trans...
Late Noachian Icy Highlands climate model: Exploring the possibility of trans...Sérgio Sacani
 
Climate science part 3 - climate models and predicted climate change
Climate science part 3 - climate models and predicted climate changeClimate science part 3 - climate models and predicted climate change
Climate science part 3 - climate models and predicted climate changeLPE Learning Center
 
CAPSTONE course_Aerosol Distribution
CAPSTONE course_Aerosol DistributionCAPSTONE course_Aerosol Distribution
CAPSTONE course_Aerosol DistributionTurner H. Glasgow
 
The Willowbrook Project
The Willowbrook ProjectThe Willowbrook Project
The Willowbrook ProjectAmira Hassan
 
Weather Data: Virtual, In-Field, or Regional Network—Does It Matter?
Weather Data: Virtual, In-Field, or Regional Network—Does It Matter?Weather Data: Virtual, In-Field, or Regional Network—Does It Matter?
Weather Data: Virtual, In-Field, or Regional Network—Does It Matter?METER Group, Inc. USA
 

What's hot (20)

Hb2015 farrell-and-jo-sapflow-np
Hb2015 farrell-and-jo-sapflow-npHb2015 farrell-and-jo-sapflow-np
Hb2015 farrell-and-jo-sapflow-np
 
s-wu
s-wus-wu
s-wu
 
Evapotranspiration: Pitfalls to Avoid and Why It’s Easier Than You Think
Evapotranspiration: Pitfalls to Avoid and Why It’s Easier Than You ThinkEvapotranspiration: Pitfalls to Avoid and Why It’s Easier Than You Think
Evapotranspiration: Pitfalls to Avoid and Why It’s Easier Than You Think
 
NDGISUC2017 - Estimate Water Surface Temperature from the Landsat 8 TIR Bands
NDGISUC2017 - Estimate Water Surface Temperature from the Landsat 8 TIR BandsNDGISUC2017 - Estimate Water Surface Temperature from the Landsat 8 TIR Bands
NDGISUC2017 - Estimate Water Surface Temperature from the Landsat 8 TIR Bands
 
Remote Sensing of Urban Heat Islands
Remote Sensing of Urban Heat IslandsRemote Sensing of Urban Heat Islands
Remote Sensing of Urban Heat Islands
 
15 evaporation transpiration sublimation
15 evaporation transpiration sublimation15 evaporation transpiration sublimation
15 evaporation transpiration sublimation
 
StreamFlow Variability of 21 Watersheds, Oregon
StreamFlow Variability of 21 Watersheds, OregonStreamFlow Variability of 21 Watersheds, Oregon
StreamFlow Variability of 21 Watersheds, Oregon
 
15 Evapotranspiration
15   Evapotranspiration15   Evapotranspiration
15 Evapotranspiration
 
Evaluating Satellite Precipitation Error Propagation in Runoff Simulations of...
Evaluating Satellite Precipitation Error Propagation in Runoff Simulations of...Evaluating Satellite Precipitation Error Propagation in Runoff Simulations of...
Evaluating Satellite Precipitation Error Propagation in Runoff Simulations of...
 
Dr. Jack Morgan - Grazinglands and Global Climate Change: What is the Science...
Dr. Jack Morgan - Grazinglands and Global Climate Change: What is the Science...Dr. Jack Morgan - Grazinglands and Global Climate Change: What is the Science...
Dr. Jack Morgan - Grazinglands and Global Climate Change: What is the Science...
 
11-GISS-DeJesus_Polanco_Quispe
11-GISS-DeJesus_Polanco_Quispe11-GISS-DeJesus_Polanco_Quispe
11-GISS-DeJesus_Polanco_Quispe
 
Ajayi_M_Senior Thesis Poster
Ajayi_M_Senior Thesis PosterAjayi_M_Senior Thesis Poster
Ajayi_M_Senior Thesis Poster
 
Climates of Vegetated Surfaces
Climates of Vegetated SurfacesClimates of Vegetated Surfaces
Climates of Vegetated Surfaces
 
Late Noachian Icy Highlands climate model: Exploring the possibility of trans...
Late Noachian Icy Highlands climate model: Exploring the possibility of trans...Late Noachian Icy Highlands climate model: Exploring the possibility of trans...
Late Noachian Icy Highlands climate model: Exploring the possibility of trans...
 
Climate science part 3 - climate models and predicted climate change
Climate science part 3 - climate models and predicted climate changeClimate science part 3 - climate models and predicted climate change
Climate science part 3 - climate models and predicted climate change
 
CAPSTONE course_Aerosol Distribution
CAPSTONE course_Aerosol DistributionCAPSTONE course_Aerosol Distribution
CAPSTONE course_Aerosol Distribution
 
The Willowbrook Project
The Willowbrook ProjectThe Willowbrook Project
The Willowbrook Project
 
Weather Data: Virtual, In-Field, or Regional Network—Does It Matter?
Weather Data: Virtual, In-Field, or Regional Network—Does It Matter?Weather Data: Virtual, In-Field, or Regional Network—Does It Matter?
Weather Data: Virtual, In-Field, or Regional Network—Does It Matter?
 
Symposium poster_2016_final
Symposium poster_2016_finalSymposium poster_2016_final
Symposium poster_2016_final
 
Climates of Non-uniform Terrain
Climates of Non-uniform TerrainClimates of Non-uniform Terrain
Climates of Non-uniform Terrain
 

Similar to Undergraduate Research Poster

Approaches for crop et estimation at field scale
Approaches for crop et estimation at field scaleApproaches for crop et estimation at field scale
Approaches for crop et estimation at field scalePravash Chandra Moharana
 
Using soil water sensors to evaluate plant available water in engineered land...
Using soil water sensors to evaluate plant available water in engineered land...Using soil water sensors to evaluate plant available water in engineered land...
Using soil water sensors to evaluate plant available water in engineered land...Kevin Donnelly
 
Hankerson_2012_Estimation of evapotranspiration from fields with and without ...
Hankerson_2012_Estimation of evapotranspiration from fields with and without ...Hankerson_2012_Estimation of evapotranspiration from fields with and without ...
Hankerson_2012_Estimation of evapotranspiration from fields with and without ...Brett Hankerson
 
FIGURE 4-1 Atmospheric temperature structure EXERCISE 2- CONTROLS OF T.pdf
FIGURE 4-1 Atmospheric temperature structure EXERCISE 2- CONTROLS OF T.pdfFIGURE 4-1 Atmospheric temperature structure EXERCISE 2- CONTROLS OF T.pdf
FIGURE 4-1 Atmospheric temperature structure EXERCISE 2- CONTROLS OF T.pdfStevenR9yGrayu
 
An Investigation of effect of Temperature Difference and Initial Moisture Con...
An Investigation of effect of Temperature Difference and Initial Moisture Con...An Investigation of effect of Temperature Difference and Initial Moisture Con...
An Investigation of effect of Temperature Difference and Initial Moisture Con...ijsrd.com
 
COMPARISON OF DIFFERENT METHODS OF ESTIMATING POTENTIAL EVAPOTRANSPIRATION
COMPARISON OF DIFFERENT METHODS OF ESTIMATING POTENTIAL EVAPOTRANSPIRATIONCOMPARISON OF DIFFERENT METHODS OF ESTIMATING POTENTIAL EVAPOTRANSPIRATION
COMPARISON OF DIFFERENT METHODS OF ESTIMATING POTENTIAL EVAPOTRANSPIRATIONAnurag Satpathi
 
Effects of Radiation on Soil Temperature
Effects of Radiation on Soil TemperatureEffects of Radiation on Soil Temperature
Effects of Radiation on Soil TemperatureAlena Senf, EIT
 
Butterfly Satellite Mission Overview
Butterfly Satellite Mission OverviewButterfly Satellite Mission Overview
Butterfly Satellite Mission OverviewChelle Gentemann
 
Geothermal seco
Geothermal secoGeothermal seco
Geothermal secoskthen72
 
Evaporation, transpiration and evapotranspiration
Evaporation, transpiration and evapotranspirationEvaporation, transpiration and evapotranspiration
Evaporation, transpiration and evapotranspirationStudent
 
Surface soil moisturescaling
Surface soil moisturescalingSurface soil moisturescaling
Surface soil moisturescalingposterVienna
 
SIMULATION OF VAPOR AND HEAT FLUXES OVER WET AND DRY REGIME IN PADDY FIELD EN...
SIMULATION OF VAPOR AND HEAT FLUXES OVER WET AND DRY REGIME IN PADDY FIELD EN...SIMULATION OF VAPOR AND HEAT FLUXES OVER WET AND DRY REGIME IN PADDY FIELD EN...
SIMULATION OF VAPOR AND HEAT FLUXES OVER WET AND DRY REGIME IN PADDY FIELD EN...IAEME Publication
 
Frandson Coweeta LTER Summer Symposium poster
Frandson Coweeta LTER Summer Symposium posterFrandson Coweeta LTER Summer Symposium poster
Frandson Coweeta LTER Summer Symposium posterGarrett Frandson
 

Similar to Undergraduate Research Poster (20)

Approaches for crop et estimation at field scale
Approaches for crop et estimation at field scaleApproaches for crop et estimation at field scale
Approaches for crop et estimation at field scale
 
Poster for BIOS
Poster for BIOSPoster for BIOS
Poster for BIOS
 
Using soil water sensors to evaluate plant available water in engineered land...
Using soil water sensors to evaluate plant available water in engineered land...Using soil water sensors to evaluate plant available water in engineered land...
Using soil water sensors to evaluate plant available water in engineered land...
 
Using soil water sensors to evaluate plant available water in engineered land...
Using soil water sensors to evaluate plant available water in engineered land...Using soil water sensors to evaluate plant available water in engineered land...
Using soil water sensors to evaluate plant available water in engineered land...
 
#1
#1#1
#1
 
Hankerson_2012_Estimation of evapotranspiration from fields with and without ...
Hankerson_2012_Estimation of evapotranspiration from fields with and without ...Hankerson_2012_Estimation of evapotranspiration from fields with and without ...
Hankerson_2012_Estimation of evapotranspiration from fields with and without ...
 
PERMAFROST RUNOFF
PERMAFROST RUNOFFPERMAFROST RUNOFF
PERMAFROST RUNOFF
 
FIGURE 4-1 Atmospheric temperature structure EXERCISE 2- CONTROLS OF T.pdf
FIGURE 4-1 Atmospheric temperature structure EXERCISE 2- CONTROLS OF T.pdfFIGURE 4-1 Atmospheric temperature structure EXERCISE 2- CONTROLS OF T.pdf
FIGURE 4-1 Atmospheric temperature structure EXERCISE 2- CONTROLS OF T.pdf
 
An Investigation of effect of Temperature Difference and Initial Moisture Con...
An Investigation of effect of Temperature Difference and Initial Moisture Con...An Investigation of effect of Temperature Difference and Initial Moisture Con...
An Investigation of effect of Temperature Difference and Initial Moisture Con...
 
COMPARISON OF DIFFERENT METHODS OF ESTIMATING POTENTIAL EVAPOTRANSPIRATION
COMPARISON OF DIFFERENT METHODS OF ESTIMATING POTENTIAL EVAPOTRANSPIRATIONCOMPARISON OF DIFFERENT METHODS OF ESTIMATING POTENTIAL EVAPOTRANSPIRATION
COMPARISON OF DIFFERENT METHODS OF ESTIMATING POTENTIAL EVAPOTRANSPIRATION
 
PAPER2
PAPER2PAPER2
PAPER2
 
Effects of Radiation on Soil Temperature
Effects of Radiation on Soil TemperatureEffects of Radiation on Soil Temperature
Effects of Radiation on Soil Temperature
 
Butterfly Satellite Mission Overview
Butterfly Satellite Mission OverviewButterfly Satellite Mission Overview
Butterfly Satellite Mission Overview
 
Geothermal seco
Geothermal secoGeothermal seco
Geothermal seco
 
Intercomparison
IntercomparisonIntercomparison
Intercomparison
 
Evaporation, transpiration and evapotranspiration
Evaporation, transpiration and evapotranspirationEvaporation, transpiration and evapotranspiration
Evaporation, transpiration and evapotranspiration
 
Surface soil moisturescaling
Surface soil moisturescalingSurface soil moisturescaling
Surface soil moisturescaling
 
REU Poster Kubiniec
REU Poster KubiniecREU Poster Kubiniec
REU Poster Kubiniec
 
SIMULATION OF VAPOR AND HEAT FLUXES OVER WET AND DRY REGIME IN PADDY FIELD EN...
SIMULATION OF VAPOR AND HEAT FLUXES OVER WET AND DRY REGIME IN PADDY FIELD EN...SIMULATION OF VAPOR AND HEAT FLUXES OVER WET AND DRY REGIME IN PADDY FIELD EN...
SIMULATION OF VAPOR AND HEAT FLUXES OVER WET AND DRY REGIME IN PADDY FIELD EN...
 
Frandson Coweeta LTER Summer Symposium poster
Frandson Coweeta LTER Summer Symposium posterFrandson Coweeta LTER Summer Symposium poster
Frandson Coweeta LTER Summer Symposium poster
 

Undergraduate Research Poster

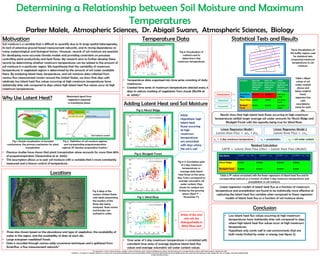
  • 1. Statistical Tests and Results Determining a Relationship between Soil Moisture and Maximum Temperatures Parker Malek, Atmospheric Sciences, Dr. Abigail Swann, Atmospheric Sciences, Biology Motivation Soil moisture is a variable that is difficult to quantify due to its large spatial heterogeneity, its lack of extensive ground-based measurement networks, and its strong dependence on many meteorological and biological factors. However, records of soil moisture are essential for developing more accurate climate models and providing constraints on processes controlling plant productivity and heat fluxes. My research aims to further develop these records by determining whether maximum temperatures can be related to the amount of soil moisture in a particular region. We hypothesize that the variability of maximum temperatures in vegetated regions is determined by the amount of soil water available there. By analyzing latent heat, temperature, and soil moisture data collected from various flux measurement towers around the United States, we show that days with relatively low latent heat flux values occurring at high maximum temperatures have statistically drier soils compared to days where high latent heat flux values occur at high maximum temperatures. 1.) S. Seneviratne, T. Corti, E. Davin, M. Hirschi, E. Jaeger, I. Lehner, B. Orlowsky, and A. Teuling. Investigating soil moisture–climate interactions in a changing climate: A review. Earth-Science Reviews, 99(3):125–161, 2010. 2.) Bonfils, C., A. Angert,C. C. Henning, S. Biraud, S. C. Doney, and I. Fung (2005), Extending the record of photosynthetic activity in the eastern United States into the presatellite period using surface diurnal temperature range, Geophys. Res. Lett., 32, L08405, doi:10.1029/ 2005GL022583. 3.) http://ameriflux.ornl.gov/ Why Use Latent Heat? • Previous studies have shown that plant transpiration alone accounts for more than 80% of evapotranspiration (Seneviratne et al. 2010).1 • This assumption allows us to pair soil moisture with a variable that is more consistently measured and a known control of temperature. Fig 1: Simple visualization of stomatal conductance, the primary mechanism for plant transpiration. Locations • Three sites chosen based on the abundance and type of vegetation, the availability of water in the region, and the availability of data at each site. • Large evergreen needleleaf forests • Data is recorded through various eddy covariance techniques and is gathered from Ameriflux, a flux measurement network.3 Temperature Data • Temperature data organized into time series consisting of daily maximums. • Created time series of maximum temperatures selected every 5 days to reduce masking of vegetation from clouds (Bonfils et al. 2005).2 Fig 3: Map of the western United States with labels pinpointing the location of the three sites being analyzed. State names and borders are outlined in white. Fig 4: Visualization of method used to determine 5 day maximum temperatures. Adding Latent Heat and Soil Moisture • Time series of 5 day maximum temperatures is correlated with coincident time series of average daytime latent heat flux values and average volumetric soil water content values. Fig 5-7: Correlation plots of 5 day maximum temperatures vs. average daily latent heat fluxes on the same day. Colors correspond to average volumetric soil water content. Days chosen for analysis are limited by the growing season (April 1st – November 1st). Fig 5: Niwot Ridge Fig 6: Blodgett Forest Fig 7: Wind River Fig 8: Visualization of the buffer regions used for statistical tests comparing maximum temperatures to soil moisture. Unexpected Expected Expected Conclusion • Low latent heat flux values occurring at high maximum temperatures have statistically drier soils compared to days where high latent heat flux values occur at high maximum temperatures. • Hypothesis only works well in wet environments that are both rarely limited by water or energy (see figure 2). Fig 2: Definition of soil moisture regimes and corresponding evapotranspiration regimes. EF denotes evaporative fraction.1 Linear Regression Model 1 𝐿𝑎𝑡𝑒𝑛𝑡 𝐻𝑒𝑎𝑡 𝐹𝑙𝑢𝑥 = 𝛼𝑥1 + 𝛽𝑥2 Table 1: Mean values of soil water content above and below original linear regression line with associated p value for each site. Results show that high latent heat fluxes occurring at high maximum temperatures exhibit larger average soil water amounts for Niwot Ridge and Blodgett Forest with the opposite being true for Wind River. Linear Regression Model 2 𝐿𝑎𝑡𝑒𝑛𝑡 𝐻𝑒𝑎𝑡 𝐹𝑙𝑢𝑥 = 𝛾𝑥3 𝑥1 = 5 day maximum temperature 𝑥3 = soil water content𝑥2 = precipitation Table 2: R2 values associated with the linear regressions of latent heat flux and its corresponding residuals as a function of either 5 day maximum temperatures and precipitation or soil moisture. Linear regression models of latent heat flux as a function of maximum temperature and precipitation are found to be statistically more effective at capturing the latent heat flux variable when compared to linear regression models of latent heat flux as a function of soil moisture alone. Maximized signal from vegetation expected in transitional phase SoilWaterContent(%)SoilWaterContent(%)SoilWaterContent(%) Initial Hypothesis: high latent heat fluxes occurring at high maximum temperatures are associated with days where the soil is wet WET SOILS DRY SOILS DRY SOILS? DRY SOILS WET SOILS WET SOILS? Areas of dry and wet soils less distinguishable in Wind River plot Residual Calculation 𝐿𝐻𝐹𝑅 = 𝐿𝑎𝑡𝑒𝑛𝑡 𝐻𝑒𝑎𝑡 𝐹𝑙𝑢𝑥 𝑂𝑏𝑠 − 𝐿𝑎𝑡𝑒𝑛𝑡 𝐻𝑒𝑎𝑡 𝐹𝑙𝑢𝑥 (𝑀𝑜𝑑𝑒𝑙) EF ~ Latent Heat