1. Whitman College
CFA Research Challenge
February 3, 2017
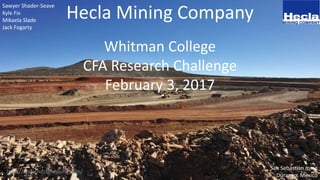
Hecla Mining Company
San Sebastian mine
Durango, Mexico
Sawyer Shader-Seave
Kyle Fix
Mikaela Slade
Jack Fogarty
http://www.hecla-mining.com/
5. Recommendation
Company
Overview
Industry Competition Financials Valuation Risks Summary
Silver Market
19%
25%
6%
50%
2015 Silver Demand by Segment
Jewelry
Coins and Bars
Silverware
Industrial
Fabrication
42%
10%
8%
13%
2%
25%
Industrial Fabrication
Electronics
Brazing
Photography
Solar
Etylene Oxide
Other
6. Recommendation
Company
Overview
Industry Competition Financials Valuation Risks Summary
Gold Market
-50
150
350
550
750
950
1150
1350
Jewelry Technology Investment Bar and
Coin
ETFs, etc. Central
Banks
Total
Demand
Gold Demand by Year and Segment
(tonnes)
Q3 '15
Q3 '16
5-yr avg
7. Recommendation
Company
Overview
Industry Competition Financials Valuation Risks Summary
Gold Market
50%
34%
8%
8%
Q3 2016 Gold Demand (tonnes)
Jewelry
Investment
Technology
Central Banks
56%
21%
8%
15%
Q3 2015 Gold Demand (tonnes)
Jewelry
Investment
Technology
Central Banks
10. Recommendation
Company
Overview
Industry Competition Financials Valuation Risks Summary
Porter’s Five Forces
Threat of New Entrants- VERY LOW (1/5)
Threat of Substitutes- HIGH (4/5)
Bargaining Power of Suppliers- HIGH (4/5)
Competition- HIGH (4/5)
Bargaining Power of Buyers- LOW (2/5)
11. Forward P/E P/Book P/Sales P/Cash Flow
HL 16.2 1.5 3.5 10.5
CDE 13 2.7 2.1 9.9
SLW 15.9 1.6 8.8 13.6
NEM 18.5 1.7 2.3 7.6
KGH-PL 21.5 0.9 1 5.9
ABX 15.7 2.3 2 6.5
Industry
Avg 17.7 1.9 1.4 10.9
Recommendation
Company
Overview
Industry Competition Financials Valuation Risks Summary
Financial Ratios
As of 1quarter ago
Top Competitors
CDE: Coeur Mining Inc.
SLW: Silver Wheaton Corp.
NEM: Newmont Mining Corp.
KGH-PL: KGHM Polska Miedz SA
ABX: Barrick Gold Corp.
12. EV/EBITDA NET DEBT/EBITDA
HL 14.73 4.98
CDE 6.56 3.01
SLW 16.19 3.47
NEM 5.59 1.2
KGH-PL 9.87 3.6
ABX 5.96 2.58
Industry Average 10.2 2.07
Recommendation
Company
Overview
Industry Competition Financials Valuation Risks Summary
EBITDA Ratios
EV/EBITDA above industry average
Above average leverage
13. Second highest return among competitors
Significantly outperformed the industry
Recommendation
Company
Overview
Industry Competition Financials Valuation Risks Summary
Hecla: Alpha & Beta
Low Beta
14. Volatile earnings
Recommendation
Company
Overview
Industry Competition Financials Valuation Risks Summary
Financials
(millions of $) 5 year
Average
10 Year
Average
EBITDA 137.4 101.5
Net Income 14.4 25.7
Cash Flow
From Operations
71 80.9
-150
-100
-50
0
50
100
150
200
250
300
350
2006-12 2007-12 2008-12 2009-12 2010-12 2011-12 2012-12 2013-12 2014-12 2015-12
EBITDA
Net income
Net cash provided by
operating activities
Free cash flow
Hecla Profit Metrics: 2006-2015
16. 16
Discounted reserves
Assets and Liabilities
Destruction by management
Recommendation
Company
Overview
Industry Competition Financials Valuation Risks Summary
Valuation
17. Proven and Probable reserves
Based on 2015 production rates
Discounted annually for their WACC
Reserves
Silver 1,141,519,563.26
Zinc 872,893,736.56
Lead 657,219,636.45
Gold 602,440,706.28
All Reserves 3,274,073,642.55
1,141.52
872.89
657.22
602.44
3,274.07
-
500.00
1,000.00
1,500.00
2,000.00
2,500.00
3,000.00
3,500.00
Millions
Current Value of Reserves $
Recommendation
Company
Overview
Industry Competition Financials Valuation Risks Summary
Reserves
thousands of
oz/tonnes
Proven and
Probable
Reserves
Silver 175,429
Gold 2,073
Lead 687,960
Zinc 738,930
18. 175.43 million oz in reserves
Based on 2015 production rates
Discounted 6% annually
Increasing production rates?
0
2,000,000
4,000,000
6,000,000
8,000,000
10,000,000
12,000,000
14,000,000
y1 y2 y3 y4 y5 y6 y7 y8 y9 y10 y11 y12 y13 y14 y15 y16
Silver Reserves
Annual production oz (based on 2015 production) Discounted value (based on 6% WACC)
Recommendation
Company
Overview
Industry Competition Financials Valuation Risks Summary
Silver Reserves & Production
19. Assets (millions of $)
Total cash 159
Receivables 71
Equity and other investments 4
Other long-term assets 5
Total 239
Liabilities (millions of $)
Short-tem debt 2
Long-term debt 500
Total 502
239
502
0
100
200
300
400
500
600
Auxiliary
Assets
Debt
We included Hecla’s most liquid
assets in their Auxiliary Assets
We also included Hecla’s $502
in short and long-term debt
Recommendation
Company
Overview
Industry Competition Financials Valuation Risks Summary
Assets & Liabilities
20. On average Hecla reinvests $164.7 million
per year
Hecla averages a 0.86% return or $1.37
million annually
Recommendation
Company
Overview
Industry Competition Financials Valuation Risks Summary
Destruction of value
Their annual cost of capital is $9.88 million
leading to a $8.46 million loss per year
The terminal value of this loss $141.84
million
$164.70
$1.37
-$8.46
-$20.00
$0.00
$20.00
$40.00
$60.00
$80.00
$100.00
$120.00
$140.00
$160.00
$180.00
Destruction of Value
(millions of $)
Average annual reinvestment
of cash
profit from avg annual
investmnet
Average annual return (after
capital costs)
21. DCF
Comparable Company
Recommendation
Company
Overview
Industry Competition Financials Valuation Risks Summary
Other Valuations
22. Lack of Hedging
Future regulations
CERCLA 108b
Management turnover
Recommendation
Company
Overview
Industry Competition Financials Valuation Risks Summary
Risks