Basics of LEDs by KwalityPhotonics_VijayKumarGupta
•Download as PPT, PDF•
1 like•485 views


Recommended
Recommended
More Related Content
Similar to Basics of LEDs by KwalityPhotonics_VijayKumarGupta
Similar to Basics of LEDs by KwalityPhotonics_VijayKumarGupta (20)
Recently uploaded
Recently uploaded (20)
Basics of LEDs by KwalityPhotonics_VijayKumarGupta
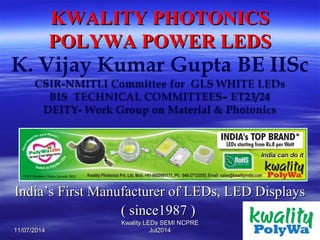
- 1. KWALITY PHOTONICSKWALITY PHOTONICS POLYWA POWER LEDSPOLYWA POWER LEDS India’s First Manufacturer of LEDs, LED DisplaysIndia’s First Manufacturer of LEDs, LED Displays ( since1987 )( since1987 ) 11/07/201411/07/2014 11 Kwality LEDs SEMI NCPREKwality LEDs SEMI NCPRE Jul2014Jul2014
- 2. Kwality Group of IndustriesKwality Group of Industries Kwality Electronic IndustriesKwality Electronic Industries Kwality Photonics Pvt. LtdKwality Photonics Pvt. Ltd.. Kwality Electricals Pvt. Ltd.Kwality Electricals Pvt. Ltd. Ocean Park Ltd.Ocean Park Ltd. 11/07/201411/07/2014 22 Kwality LEDs SEMI NCPREKwality LEDs SEMI NCPRE Jul2014Jul2014
- 3. The Kwality polyWa LEDsThe Kwality polyWa LEDs TOP LED BRAND 2012 & 2013TOP LED BRAND 2012 & 2013 Established in 1966Established in 1966 Employs over 150 workersEmploys over 150 workers Started off with manufacture ofStarted off with manufacture of Lamps, Filaments & WiresLamps, Filaments & Wires Manufacturing LED & LEDManufacturing LED & LED Segment Displays since1987Segment Displays since1987 after successful indigenous R&Dafter successful indigenous R&D 11/07/201411/07/2014 33 Kwality LEDs SEMI NCPREKwality LEDs SEMI NCPRE Jul2014Jul2014
- 4. Kwality Photonics P LtdKwality Photonics P Ltd India's largest producer of Light Emitting DiodesIndia's largest producer of Light Emitting Diodes (LEDs), LED Displays & Opto Electronic(LEDs), LED Displays & Opto Electronic Products.Products. Kwality is not only the pioneer, being the firstKwality is not only the pioneer, being the first Indian Company to have successfullyIndian Company to have successfully established LEDs production in India but alsoestablished LEDs production in India but also commands the highest market share in domesticcommands the highest market share in domestic sales.sales. 11/07/201411/07/2014 44 Kwality LEDs SEMI NCPREKwality LEDs SEMI NCPRE Jul2014Jul2014
- 5. AGENDAAGENDA LEDs –STRUCTURE &THERMAL DESIGNLEDs –STRUCTURE &THERMAL DESIGN DEMYSTIFY – LEDs COLOR & LIGHTDEMYSTIFY – LEDs COLOR & LIGHT LEDs -MANUFACTURING PROCESSESLEDs -MANUFACTURING PROCESSES RETROFIT LED LUMINAIRESRETROFIT LED LUMINAIRES INFLUENCE OF STANDARDS ON THEINFLUENCE OF STANDARDS ON THE LEDS ( ZHAGA, ENERGY STAR, LM84)LEDS ( ZHAGA, ENERGY STAR, LM84) LED DRIVERS TECHNOLOGYLED DRIVERS TECHNOLOGY 11/07/201411/07/2014 55 Kwality LEDs SEMI NCPREKwality LEDs SEMI NCPRE Jul2014Jul2014
- 6. 11/25/10 Kwality PolyWa LEDs 611/07/201411/07/2014 66 Kwality LEDs SEMI NCPREKwality LEDs SEMI NCPRE Jul2014Jul2014
- 7. 11/25/10 Kwality PolyWa LEDs 711/07/201411/07/2014 77 Kwality LEDs SEMI NCPREKwality LEDs SEMI NCPRE Jul2014Jul2014
- 8. 11/25/10 Kwality PolyWa LEDs 811/07/201411/07/2014 88 Kwality LEDs SEMI NCPREKwality LEDs SEMI NCPRE Jul2014Jul2014
- 9. 11/25/10 Kwality PolyWa LEDs 911/07/201411/07/2014 99 Kwality LEDs SEMI NCPREKwality LEDs SEMI NCPRE Jul2014Jul2014
- 10. 11/25/10 Kwality PolyWa LEDs 10 Thermal Designof LED LampThermal Designof LED Lamp 11/07/201411/07/2014 Kwality LEDs SEMI NCPREKwality LEDs SEMI NCPRE Jul2014Jul2014 1010
- 11. 11/25/10 Kwality PolyWa LEDs 1111/07/201411/07/2014 1111 Kwality LEDs SEMI NCPREKwality LEDs SEMI NCPRE Jul2014Jul2014
- 12. 11/25/10 Kwality PolyWa LEDs 1211/07/201411/07/2014 1212 Kwality LEDs SEMI NCPREKwality LEDs SEMI NCPRE Jul2014Jul2014
- 13. 11/25/10 Kwality PolyWa LEDs 13 Structure of LED LampStructure of LED Lamp 11/07/201411/07/2014 Kwality LEDs SEMI NCPREKwality LEDs SEMI NCPRE Jul2014Jul2014 1313
- 14. 11/25/10 Kwality PolyWa LEDs 14 Structure of LED LampStructure of LED Lamp 11/07/201411/07/2014 Kwality LEDs SEMI NCPREKwality LEDs SEMI NCPRE Jul2014Jul2014 1414
- 15. 11/25/10 Kwality PolyWa LEDs 15 Thermal Designof LED LampThermal Designof LED Lamp 11/07/201411/07/2014 Kwality LEDs SEMI NCPREKwality LEDs SEMI NCPRE Jul2014Jul2014 1515
- 16. 11/25/10 Kwality PolyWa LEDs 16 Thermal Designof LED LampThermal Designof LED Lamp 11/07/201411/07/2014 Kwality LEDs SEMI NCPREKwality LEDs SEMI NCPRE Jul2014Jul2014 1616
- 17. 11/25/10 Kwality PolyWa LEDs 17 Thermal Designof LED LampThermal Designof LED Lamp 11/07/201411/07/2014 Kwality LEDs SEMI NCPREKwality LEDs SEMI NCPRE Jul2014Jul2014 1717
- 18. 11/25/10 Kwality PolyWa LEDs 18 Thermal Designof LED LampThermal Designof LED Lamp 11/07/201411/07/2014 Kwality LEDs SEMI NCPREKwality LEDs SEMI NCPRE Jul2014Jul2014 1818
- 19. LED LIFE INFLUENCED BY STRUCTURE OF PACKAGE 11/25/10 19Kwality PolyWa LEDs11/07/201411/07/2014 1919 Kwality LEDs SEMI NCPREKwality LEDs SEMI NCPRE Jul2014Jul2014
- 20. 11/25/10 20Kwality PolyWa LEDs11/07/201411/07/2014 2020 Kwality LEDs SEMI NCPREKwality LEDs SEMI NCPRE Jul2014Jul2014
- 21. 11/25/10 21Kwality PolyWa LEDs11/07/201411/07/2014 2121 Kwality LEDs SEMI NCPREKwality LEDs SEMI NCPRE Jul2014Jul2014
- 22. 11/07/201411/07/2014 Kwality LEDs SEMI NCPREKwality LEDs SEMI NCPRE Jul2014Jul2014 2222
- 23. 11/07/201411/07/2014 Kwality LEDs SEMI NCPREKwality LEDs SEMI NCPRE Jul2014Jul2014 2323
- 24. 11/07/201411/07/2014 Kwality LEDs SEMI NCPREKwality LEDs SEMI NCPRE Jul2014Jul2014 2424
- 25. 11/07/201411/07/2014 Kwality LEDs SEMI NCPREKwality LEDs SEMI NCPRE Jul2014Jul2014 2525
- 26. 11/07/201411/07/2014 Kwality LEDs SEMI NCPREKwality LEDs SEMI NCPRE Jul2014Jul2014 2626 InGaN White LED structureInGaN White LED structure
- 27. 11/07/201411/07/2014 Kwality LEDs SEMI NCPREKwality LEDs SEMI NCPRE Jul2014Jul2014 2727 LED Spectrum & OpticsLED Spectrum & Optics
- 28. 11/07/201411/07/2014 Kwality LEDs SEMI NCPREKwality LEDs SEMI NCPRE Jul2014Jul2014 2828 Correlated Color TemperatureCorrelated Color Temperature
- 29. 11/07/201411/07/2014 Kwality LEDs SEMI NCPREKwality LEDs SEMI NCPRE Jul2014Jul2014 2929 Typical LED SpectraTypical LED Spectra
- 30. 11/07/201411/07/2014 Kwality LEDs SEMI NCPREKwality LEDs SEMI NCPRE Jul2014Jul2014 3030 Dominant WavelengthDominant Wavelength Peak WavelengthPeak Wavelength
- 31. 11/07/201411/07/2014 Kwality LEDs SEMI NCPREKwality LEDs SEMI NCPRE Jul2014Jul2014 3131 Radiometric and PhotometricRadiometric and Photometric UnitsUnits
- 32. 11/07/201411/07/2014 Kwality LEDs SEMI NCPREKwality LEDs SEMI NCPRE Jul2014Jul2014 3232 Intensity I and Solid AngleIntensity I and Solid Angle ΩΩ Radiometric Intensity: Iv [W/sr] Photometric Intensity: I [lm/sr] or [cd], Candela Solid Angle Units: Ω [sr], Steradian
- 33. 11/07/201411/07/2014 Kwality LEDs SEMI NCPREKwality LEDs SEMI NCPRE Jul2014Jul2014 3333 Conversion from Intensity to fluxConversion from Intensity to flux
- 34. DIEBONDING STAGE LEAD FRAME LED CHIPs Silver Epoxy WIRE BONDING STAGE Bonding Wire ENCAPSULATION STAGE Epoxy MATERIALS USED in PLCC LEDs Manufacture 11/07/201411/07/2014 3434 Kwality LEDs SEMI NCPREKwality LEDs SEMI NCPRE Jul2014Jul2014
- 35. Kwality PLCC LED -Manufacturing Process Die Bonding Section 1. Die-Bonding Section11/07/201411/07/2014 3535 Kwality LEDs SEMI NCPREKwality LEDs SEMI NCPRE Jul2014Jul2014
- 36. 1. Automatic Die Bonding Machine Kwality PLCC LED -Manufacturing Process Die Bonding Section 11/07/201411/07/2014 3636 Kwality LEDs SEMI NCPREKwality LEDs SEMI NCPRE Jul2014Jul2014
- 37. Wire Bonding Section Wire Bonding Section 11/07/201411/07/2014 3737 Kwality LEDs SEMI NCPREKwality LEDs SEMI NCPRE Jul2014Jul2014
- 38. 2. Auto Wire Bonding Machine Wire Bonding Section 11/07/201411/07/2014 3838 Kwality LEDs SEMI NCPREKwality LEDs SEMI NCPRE Jul2014Jul2014
- 39. 3. Auto Encapsulation Dispensing Machine Kwality PLCC LED -Manufacturing Process Encapsulation Section 11/07/201411/07/2014 3939 Kwality LEDs SEMI NCPREKwality LEDs SEMI NCPRE Jul2014Jul2014
- 40. PLCC LED Testing (fig.2) Kwality PLCC LED -Manufacturing Process Finished LEDs Testing Section 11/07/201411/07/2014 4040 Kwality LEDs SEMI NCPREKwality LEDs SEMI NCPRE Jul2014Jul2014
- 41. LED Tape and REEL Packing Machine LED Tape and REEL Packing Process 11/07/201411/07/2014 4141 Kwality LEDs SEMI NCPREKwality LEDs SEMI NCPRE Jul2014Jul2014
- 42. Retrofit LED ConstructionRetrofit LED Construction 11/07/201411/07/2014 4242 Kwality LEDs SEMI NCPREKwality LEDs SEMI NCPRE Jul2014Jul2014
- 43. MERITS RETROFIT LED LAMPSMERITS RETROFIT LED LAMPS There are several reasons why a consumerThere are several reasons why a consumer wants a replacement lamp.wants a replacement lamp. It saves costs of outer luminaire as well costIt saves costs of outer luminaire as well cost of labour and time to pull the old fixturesof labour and time to pull the old fixtures out of the ceiling and replace them without of the ceiling and replace them with new ones.new ones. Benefits of LED Lighting can be brought inBenefits of LED Lighting can be brought in even before end of standard maintenanceeven before end of standard maintenance cycle of the Fittings. Retrofitting suits anycycle of the Fittings. Retrofitting suits any fixture that has a large enough mechanicalfixture that has a large enough mechanical envelope.envelope.11/07/201411/07/2014 4343 Kwality LEDs SEMI NCPREKwality LEDs SEMI NCPRE Jul2014Jul2014
- 44. MERITS OF RETROFIT LEDMERITS OF RETROFIT LED LAMPSLAMPS Huge opportunityHuge opportunity - billions of existing- billions of existing "sockets" out there."sockets" out there. InertiaInertia - it will take time for decisions that- it will take time for decisions that call for migration to completely integratedcall for migration to completely integrated LED systems. giving longer opportunityLED systems. giving longer opportunity window for retrofit business.window for retrofit business. Design aspects:Design aspects: we'll need a new series ofwe'll need a new series of bases or platforms that are more suitablebases or platforms that are more suitable for issues involving thermal dissipation.for issues involving thermal dissipation. 11/07/201411/07/2014 4444 Kwality LEDs SEMI NCPREKwality LEDs SEMI NCPRE Jul2014Jul2014
- 45. LED Retrofit LampsLED Retrofit Lamps Maintainability aspectsMaintainability aspects: In a lot of applications: In a lot of applications (task lighting, track lighting, chandeliers,(task lighting, track lighting, chandeliers, pendants) replacing the entire fixture takespendants) replacing the entire fixture takes little more labor or expertise, but it wouldlittle more labor or expertise, but it would be easier to slip in a LED retrofit.be easier to slip in a LED retrofit. 11/07/201411/07/2014 4545 Kwality LEDs SEMI NCPREKwality LEDs SEMI NCPRE Jul2014Jul2014
- 46. LED Retrofit LampsLED Retrofit Lamps The retrofit LED has reduced performance dueThe retrofit LED has reduced performance due limitations imposed by Form factorlimitations imposed by Form factor due todue to requires tradeoffs.requires tradeoffs. Either it will cost more,Either it will cost more, or not perform as well, or perhaps both.or not perform as well, or perhaps both. The best integrated fixtures have an efficacyThe best integrated fixtures have an efficacy edge of 30-50% over replacement lamps.edge of 30-50% over replacement lamps. The implementations that you can do in aThe implementations that you can do in a fixture are really quite difficult with afixture are really quite difficult with a lamp.lamp. 11/07/201411/07/2014 4646 Kwality LEDs SEMI NCPREKwality LEDs SEMI NCPRE Jul2014Jul2014
- 47. Retrofit LED ConstructionRetrofit LED Construction 11/07/201411/07/2014 4747 Kwality LEDs SEMI NCPREKwality LEDs SEMI NCPRE Jul2014Jul2014
- 48. Retrofit LEDRetrofit LED Tubelight StructureTubelight Structure 11/07/201411/07/2014 4848 Kwality LEDs SEMI NCPREKwality LEDs SEMI NCPRE Jul2014Jul2014
- 49. SSL Standards – ZHAGASSL Standards – ZHAGA 11/07/201411/07/2014 4949 Kwality LEDs SEMI NCPREKwality LEDs SEMI NCPRE Jul2014Jul2014
- 50. SSL Standards – ZHAGASSL Standards – ZHAGA 11/07/201411/07/2014 5050 Kwality LEDs SEMI NCPREKwality LEDs SEMI NCPRE Jul2014Jul2014
- 51. SSL Standards – ZHAGASSL Standards – ZHAGA 11/07/201411/07/2014 5151 Kwality LEDs SEMI NCPREKwality LEDs SEMI NCPRE Jul2014Jul2014
- 52. SSL Standards – ZHAGASSL Standards – ZHAGA 11/07/201411/07/2014 5252 Kwality LEDs SEMI NCPREKwality LEDs SEMI NCPRE Jul2014Jul2014
- 53. SSL Standards – ZHAGASSL Standards – ZHAGA 11/07/201411/07/2014 5353 Kwality LEDs SEMI NCPREKwality LEDs SEMI NCPRE Jul2014Jul2014
- 54. SSL Standards – ZHAGASSL Standards – ZHAGA 11/07/201411/07/2014 5454 Kwality LEDs SEMI NCPREKwality LEDs SEMI NCPRE Jul2014Jul2014
- 55. SSL Standards – ZHAGASSL Standards – ZHAGA 11/07/201411/07/2014 5555 Kwality LEDs SEMI NCPREKwality LEDs SEMI NCPRE Jul2014Jul2014
- 56. LEDs DRIVER DESIGNLEDs DRIVER DESIGN It is important never toIt is important never to connect LEDs directlyconnect LEDs directly to a voltage source.to a voltage source. Must use a currentMust use a current limiter Like a resistor inlimiter Like a resistor in series ( see theseries ( see the formula here)formula here) Three different ways ofThree different ways of operating LEDs,operating LEDs, depending of area ofdepending of area of applicationapplication 11/07/201411/07/2014 5656 Kwality LEDs SEMI NCPREKwality LEDs SEMI NCPRE Jul2014Jul2014
- 57. LEDs DRIVER DESIGNLEDs DRIVER DESIGN 11/07/201411/07/2014 5757 Kwality LEDs SEMI NCPREKwality LEDs SEMI NCPRE Jul2014Jul2014
- 58. LED LUMINAIRE EFFICENCYLED LUMINAIRE EFFICENCY 11/07/201411/07/2014 5858 Kwality LEDs SEMI NCPREKwality LEDs SEMI NCPRE Jul2014Jul2014
- 59. LED DRVR –MAINS ISOLATIONLED DRVR –MAINS ISOLATION 11/07/201411/07/2014 5959 Kwality LEDs SEMI NCPREKwality LEDs SEMI NCPRE Jul2014Jul2014
- 60. LED DRIVER CONFIGURATIONLED DRIVER CONFIGURATION Basic Flyback: Single-stageBasic Flyback: Single-stage – AdvantageAdvantage SimpleSimple No bulk e-capNo bulk e-cap – DisadvantageDisadvantage Line frequency ripple currentLine frequency ripple current Boost + Flyback: Two-stageBoost + Flyback: Two-stage – AdvantageAdvantage No flickersNo flickers High PFHigh PF – DisadvantageDisadvantage CostCost 11/07/201411/07/2014 6060 Kwality LEDs SEMI NCPREKwality LEDs SEMI NCPRE Jul2014Jul2014
- 61. LEDs DIMMABLE DRIVERLEDs DIMMABLE DRIVER DIMMABLE LEDS are liked by ArchitectsDIMMABLE LEDS are liked by Architects The first challenge is to replace the socket of A-The first challenge is to replace the socket of A- lamps with LED lamp, while maintaininglamps with LED lamp, while maintaining compatibility with existing dimmers.compatibility with existing dimmers. Existing wall dimmers are designed to driveExisting wall dimmers are designed to drive purely resistance A-lamp loads. When it drivespurely resistance A-lamp loads. When it drives a capacitive load or current source, the dimmera capacitive load or current source, the dimmer may not work properly.may not work properly. 11/07/201411/07/2014 6161 Kwality LEDs SEMI NCPREKwality LEDs SEMI NCPRE Jul2014Jul2014
- 62. Kwality LEDs SEMI NCPREKwality LEDs SEMI NCPRE LEDs DIMMABLE DRIVERLEDs DIMMABLE DRIVER LED lamp should operate with different dimmerLED lamp should operate with different dimmer types:types: – Leading-edge dimmers, Trailing-edge dimmers, Smart DimmersLeading-edge dimmers, Trailing-edge dimmers, Smart Dimmers – In case the LED lamp can not work properly with certain dimmers,In case the LED lamp can not work properly with certain dimmers, the LED lamps should provide certain safety protections to preventthe LED lamps should provide certain safety protections to prevent fire, high leakage current etcfire, high leakage current etc.. Dimming PerformanceDimming Performance – Wide dimming range 1% to 100%Wide dimming range 1% to 100% – No visible FlickerNo visible Flicker AC-cycle inrush currentAC-cycle inrush current – High Power Factor at maximum dimming levelHigh Power Factor at maximum dimming level – Residential > 0.7Residential > 0.7 – Commercial > 0.9Commercial > 0.9 11/07/201411/07/2014 6262
- 63. Kwality LEDs SEMI NCPREKwality LEDs SEMI NCPRE LEDs DIMMABLE DRIVERLEDs DIMMABLE DRIVER WALL Dimmer types:WALL Dimmer types: – Leading-edgeLeading-edge – Trailing-edgeTrailing-edge – Smart dimmers, adaptive adjust the turn-on angle toSmart dimmers, adaptive adjust the turn-on angle to minimum the line distortion; could be leading-edge,minimum the line distortion; could be leading-edge, could be trailing-edgecould be trailing-edge – More..More.. Dimmer impedance and power level also variesDimmer impedance and power level also varies – RR – R-LR-L – R-CR-C – 50W, 200W etc50W, 200W etc 11/07/201411/07/2014 6363
- 64. Kwality LEDs SEMI NCPREKwality LEDs SEMI NCPRE LEDs DIMMABLE DRIVERLEDs DIMMABLE DRIVER WALL Dimmer with TriacWALL Dimmer with Triac – The gate current must remain present until the loadThe gate current must remain present until the load current has reached the latch current (IL) and thencurrent has reached the latch current (IL) and then the triac will remain on until the load current fallsthe triac will remain on until the load current falls below the hold current (IH).below the hold current (IH). – This requirement creates the issue for switch-modeThis requirement creates the issue for switch-mode power supply where the impedance is not purelypower supply where the impedance is not purely resistive (reactive load = current not in phase withresistive (reactive load = current not in phase with voltage).voltage). 11/07/201411/07/2014 6464
- 65. Kwality LEDs SEMI NCPREKwality LEDs SEMI NCPRE WALL DIMMER TYPESWALL DIMMER TYPES 11/07/201411/07/2014 6565
- 66. Kwality LEDs SEMI NCPREKwality LEDs SEMI NCPRE SSL DRIVER STANDARDSSSL DRIVER STANDARDS ENERGY STAR® Program Requirements for IntegralENERGY STAR® Program Requirements for Integral LED LampsLED Lamps •• FCC requirementsFCC requirements – 47 CFR part 15 & • Class A and Class B47 CFR part 15 & • Class A and Class B •• Harmonic Emission limits and related power qualityHarmonic Emission limits and related power quality – ANSI C82.77-2002 & • IEC 61000-3-2ANSI C82.77-2002 & • IEC 61000-3-2 •• SafetySafety – UL8750 & • IEC 60950 Part 1UL8750 & • IEC 60950 Part 1 •• Line Transient protections ( Lighting Surge)Line Transient protections ( Lighting Surge) IEEE C62.41-1991; Class A, 100kHz ringwave, 2.5kV combineIEEE C62.41-1991; Class A, 100kHz ringwave, 2.5kV combine •• Audible NoiseAudible Noise – –– Class AClass A 11/07/201411/07/2014 6666
- 67. LEDs DRIVERLEDs DRIVER Dimmer Flyback: Single-stageDimmer Flyback: Single-stage – Unique Method to Configure theUnique Method to Configure the Dimmer TypeDimmer Type – Provide the Pure resistiveProvide the Pure resistive impedance to Wall Dimmerimpedance to Wall Dimmer – Line current shape to improveLine current shape to improve power factorpower factor – Reduce AC-cycle Inrush currentReduce AC-cycle Inrush current 11/07/201411/07/2014 6767 Kwality LEDs SEMI NCPREKwality LEDs SEMI NCPRE Jul2014Jul2014
- 68. THERMAL DRIFT & PROTECTIONTHERMAL DRIFT & PROTECTION 11/07/201411/07/2014 6868Kwality LEDs SEMI NCPRE Jul2014Kwality LEDs SEMI NCPRE Jul2014
- 69. EMI - CONDUCTEDEMI - CONDUCTED 11/07/201411/07/2014 6969Kwality LEDs SEMI NCPRE Jul2014Kwality LEDs SEMI NCPRE Jul2014
- 70. LED DRIVERS SHAPESLED DRIVERS SHAPES 11/07/201411/07/2014 7070Kwality LEDs SEMI NCPRE Jul2014Kwality LEDs SEMI NCPRE Jul2014 TUBE LIGHT>TUBE LIGHT> iWatt Designs
- 71. 11/25/10 Kwality PolyWa LEDs 71 IT’S A GREEN TECHNOLOGY 11/07/201411/07/2014 7171 Kwality LEDs SEMI NCPREKwality LEDs SEMI NCPRE Jul2014Jul2014
- 72. ELEMENTS of LED LuminairesELEMENTS of LED Luminaires 11/07/201411/07/2014 7272 Kwality LEDs SEMI NCPREKwality LEDs SEMI NCPRE Jul2014Jul2014
- 73. ELEMENTS of LED LuminairesELEMENTS of LED Luminaires Heatsinks & heatpipesHeatsinks & heatpipes 11/07/201411/07/2014 7373 Kwality LEDs SEMI NCPREKwality LEDs SEMI NCPRE Jul2014Jul2014
- 74. ELEMENTS of LEDELEMENTS of LED Luminaires HeatsinksLuminaires Heatsinks Typically made of aluminum or copperTypically made of aluminum or copper Heat sinks conduct heat from a heatHeat sinks conduct heat from a heat source and then convey the heat to thesource and then convey the heat to the ambient.ambient. The required size of the heat sink dependsThe required size of the heat sink depends on application specific maximum,on application specific maximum, ambient and case temperature limitations.ambient and case temperature limitations. The material composition of the heat sink.The material composition of the heat sink. Surface characteristics of the heat sink,.Surface characteristics of the heat sink,. Physical constraints for the application.Physical constraints for the application. 11/07/201411/07/2014 7474 Kwality LEDs SEMI NCPREKwality LEDs SEMI NCPRE Jul2014Jul2014
- 75. ELEMENTS of LED LuminairesELEMENTS of LED Luminaires Heatsinks & heatpipesHeatsinks & heatpipes 11/07/201411/07/2014 7575 Kwality LEDs SEMI NCPREKwality LEDs SEMI NCPRE Jul2014Jul2014
- 76. Retrofit T8 LED TubelightRetrofit T8 LED Tubelight 11/07/201411/07/2014 7676 Kwality LEDs SEMI NCPREKwality LEDs SEMI NCPRE Jul2014Jul2014
- 77. Retrofit T8 Tube lightRetrofit T8 Tube light 11/07/201411/07/2014 7777 Kwality LEDs SEMI NCPREKwality LEDs SEMI NCPRE Jul2014Jul2014 In retrofit T8 you have a poorer thermal dissipation noIn retrofit T8 you have a poorer thermal dissipation no matter how much aluminum you place to absorbmatter how much aluminum you place to absorb the heat, especially if you are talking about enclosedthe heat, especially if you are talking about enclosed devices.devices. The “FTL housings” was designed for tubes that didThe “FTL housings” was designed for tubes that did not needed to be ventilated as SSL-LED's.not needed to be ventilated as SSL-LED's. One mitigation has been toOne mitigation has been to use hundreds of lowuse hundreds of low current LEDscurrent LEDs in place of high power LEDs.in place of high power LEDs. The availability of larger surface area around eachThe availability of larger surface area around each such LEDs greatly influences the temperaturessuch LEDs greatly influences the temperatures levels from accumulating.levels from accumulating.
- 78. IESNA /DOE LM79-08 ( Luminaires) LM80-08 (Sources) IESNA TM-16-05, RP-16-05, TM-21†, LM-XX1†, LM-XX2† ,IES G-2† ANSI/NEMA C78.377- 2008 ,NEMA.SSL-1† NEMA SSL-3 Europe and World- IEC ,CIE IEC-60598 , (62031 M_SS) , 62560 (LL SS†) , 62612 (LL_P†), 61341 , 61231 , Pr. 62504(def) , 60061 , 60838-2-2 , 61347-1 , 61347-2-13 , 62384 (CG) , 62386-207 , 60825-1 , 61000-3-2: , 61000-3-3: , 61547: , EN 55015: EN 62471: 2008 ( 62471:2006 modified) S 009:2002 TR 62471-2 11/25/10 Kwality PolyWa LEDs 7811/07/201411/07/2014 7878 Kwality LEDs SEMI NCPREKwality LEDs SEMI NCPRE Jul2014Jul2014
- 79. LEDs in AGRI/AQUA CULTURELEDs in AGRI/AQUA CULTURE Plant growth Lights emit just the spectrum ofPlant growth Lights emit just the spectrum of light plants use, with no wasted heat or nonlight plants use, with no wasted heat or non usable light.usable light. The lights allow a 24 hour growth cycle whichThe lights allow a 24 hour growth cycle which maximizes the benefits of aquaponics.maximizes the benefits of aquaponics. goal is to grow high quality crops throughoutgoal is to grow high quality crops throughout the year and avoid damage caused bythe year and avoid damage caused by natural conditions and the excessive use ofnatural conditions and the excessive use of pesticidespesticides 11/07/201411/07/2014 7979 Kwality LEDs SEMI NCPREKwality LEDs SEMI NCPRE Jul2014Jul2014
- 80. LEDs in AGRI/AQUA CULTURELEDs in AGRI/AQUA CULTURE PURPLE –RED+BLUE LIGHTPURPLE –RED+BLUE LIGHT.. 11/07/201411/07/2014 8080 Kwality LEDs SEMI NCPREKwality LEDs SEMI NCPRE Jul2014Jul2014
- 81. LEDs in AGRI/AQUA CULTURELEDs in AGRI/AQUA CULTURE LED lighting is adjustable and requires lessLED lighting is adjustable and requires less electricity;electricity; Different wavelengths of LED lighting could beDifferent wavelengths of LED lighting could be matched with various types of plants. Differentmatched with various types of plants. Different plants may receive sufficient lighting (thoughplants may receive sufficient lighting (though still weaker than sunlight).still weaker than sunlight). Appropriate amount of lighting could beAppropriate amount of lighting could be supplemented to the sunshine duration.supplemented to the sunshine duration. Sunlight is unavailable during night time, thus theSunlight is unavailable during night time, thus the supplement of LED lighting may assist insupplement of LED lighting may assist in shortening the growing period of plants.shortening the growing period of plants. 11/07/201411/07/2014 8181 Kwality LEDs SEMI NCPREKwality LEDs SEMI NCPRE Jul2014Jul2014
- 82. LEDs in AGRI/AQUA CULTURELEDs in AGRI/AQUA CULTURE ‘‘PLANT FACTORIES’ -two types:PLANT FACTORIES’ -two types: BASIC GREENHOUSE – Low initial cost .BASIC GREENHOUSE – Low initial cost . In an environment with good climate and soil,, aIn an environment with good climate and soil,, a basic greenhouse would be enough to enhancebasic greenhouse would be enough to enhance the capacity of plant factories.the capacity of plant factories. FULL ENVIRONMENTAL CONTROL coversFULL ENVIRONMENTAL CONTROL covers light, temperature, humidity, nutrients, water,light, temperature, humidity, nutrients, water, carbon dioxide, and other environmental factorscarbon dioxide, and other environmental factors - suitable for growing high value crops or high-- suitable for growing high value crops or high- priced ornamental plants- EXPENSIVEpriced ornamental plants- EXPENSIVE 11/07/201411/07/2014 Kwality LEDs SEMI NCPREKwality LEDs SEMI NCPRE Jul2014Jul2014 8282
- 83. LEDs in AGRI/AQUA CULTURELEDs in AGRI/AQUA CULTURE White light LED vs. red/blue light LEDWhite light LED vs. red/blue light LED There are two types of light sourcesThere are two types of light sources – A. Phosphor base white LED lightA. Phosphor base white LED light – B. Mix of Red, Blue and UV LEDB. Mix of Red, Blue and UV LED PHOTOSYNTHESIS -The plants only needPHOTOSYNTHESIS -The plants only need 650-655nm Red & 450-470nm Blue light in650-655nm Red & 450-470nm Blue light in order to perform photosynthesisorder to perform photosynthesis Therefore, the mixed LED light source is moreTherefore, the mixed LED light source is more suitable for growing plants than the white lightsuitable for growing plants than the white light source.source. 11/07/201411/07/2014 8383 Kwality LEDs SEMI NCPREKwality LEDs SEMI NCPRE Jul2014Jul2014
- 84. LEDs in AGRI/AQUA CULTURELEDs in AGRI/AQUA CULTURE Manufacturers fromManufacturers from Europe, the US,Europe, the US, China, and TaiwanChina, and Taiwan aggressively investaggressively invest in the plant lightingin the plant lighting marketmarket 11/07/201411/07/2014 8484 Kwality LEDs SEMI NCPREKwality LEDs SEMI NCPRE Jul2014Jul2014
- 85. KWALITY PHOTONICSKWALITY PHOTONICS POLYWA POWER LEDSPOLYWA POWER LEDS India’s First Manufacturer of LEDs, LED DisplaysIndia’s First Manufacturer of LEDs, LED Displays ( since1987 )( since1987 ) 11/07/201411/07/2014 8585 Kwality LEDs SEMI NCPREKwality LEDs SEMI NCPRE Jul2014Jul2014
Editor's Notes
- Jean Paul Freyssinier, research scientist at the Lighting Research Center (LRC) at Rensselaer Polytechnic Institute, targeted both measures of color rendering and color temperature in his presentation entitled “Class A lighting.” FIG. 3.Addressing color rendering index (CRI), correlated color temperature (CCT) and other metrics, Freyssinier said, “None of the metrics that we use are perfectly predictive of peoples’ perception or assessment of light sources.” He explained that the metrics are meant to describe the physical characteristics of a light source – i.e. the stimulus to a person, but not the perception of the person. Focusing specifically on color rendering, Freyssinier said that the lighting industry now accepts that “no single metric can characterize color rendering.” He said that there are too many dimensions to color rendering – including color fidelity, saturation, and discrimination of hues – to capture in a single metric (). Whether Freyssinier is right about an industry-wide opinion on color rendering or not, he used the SIL platform to advocate the LRC’s gamut area index (GAI) metric that is meant to be used in combination with CRI. Freyssinier said that people prefer a light source that enhances color without distortion or making the object look unnatural. And he said that light sources with high CRI and GAI will consistently outperform light sources that rate high in only one of these two metrics. Chromaticity variances The bulk of Freyssinier's presentation, however, was focused on CCT and perhaps a misguided perception of the accepted definition of a white light source. Freyssinier said, “By definition CCT is a line in the color space, not a single point.” Two light sources can have the same CCT and still be quite different in terms of chromaticity in the CIE 1931 color space. The industry widely accepts that the black-body locus that’s plotted in the color space represents a white source at varying CCT values. But the LRC performed a study to seek the answer to Freyssinier’s question, “Is there a difference in terms of perception or preference for end users?” FIG. 4.The study utilized a viewing box with multiple light sources. Computer control allowed the researchers to produce light at specific CCT, chromaticity and brightness levels. Testers were shown light at six CCTs ranging from 2700-6500K. At each CCT, the testers were asked to judge light at seven different chromaticity values along the CCT line with the values ranging well above and below the black-body locus.The testers were asked to respond immediately after seeing each light source and after an adaption period of 45 seconds. The testers judged the hue of the light source responding to whether they perceived the source to be green/yellow in nature or purple/violet. The testers were also asked to rate the hue relative to their perception of pure white. The details of the research are lengthy in nature, but Fig. 3 shows a surprising result. Only at around 4100K did the perception of the testers align with the black-body locus. At cooler CCTs the testers preferred chromaticity slightly above the locus. More importantly, at warmer CCTs the testers preferred chromaticity significantly below the locus. Chromaticity white points At 2700K, Freyssinier said that the difference in terms of perception between the black-body locus and the preferred white point is equal to a 13-15-step MacAdam ellipse (also referred to as a SDCM or standard deviation of color matching ellipse). Freyssinier said that the difference in terms of perception between the black-body locus and the preferred white point at 2700K is greater than the perceived difference between the three white points at 3500K, 3000K, and 2700K despite the fact that those white points are more spread out on the color-space graph. Closing the loop around color rendering, CCT, and chromaticity, Freyssinier addressed the title of his presentation. He defines a Class A light source as one that has CRI above 80, GAI between 80 and 100, and chromaticity located along the white line in the color space identified by the LRC’s study. Ron Steen, VP business development at Xicato, also addressed color quality and focused on the lack of standards that specify color deviation and the problem of changes in color over time of LED sources. Steen said that SSL deployment is happening, but not as quickly as some industry proponents believe it should. He said that the LED industry focus has been on efficacy and that great progress has been made in that area. But he asked, “With 150 lm/W, why isn’t [mass adoption of SSL] happening?” Steen answered saying “Maybe one of the reasons it hasn’t happened is because it’s ugly.” Color variance Steen used a screen to project light with different characteristics to demonstrate the potential problems that the LED industry still faces in terms of color consistency. First he compared two 3000K sources side by side that were within the 7-step SDCM bounds of the ANSI binning scheme for LEDs. The lights had only a 19K difference in CCT. The difference was noticeable but perhaps not unacceptable. He then showed two sources that fell within a 4-step SDCM ellipse. But in this case he used sources that were 39K apart albeit much closer in chromaticity. The difference was significant and Steen concluded that it would be problematic in most lighting applications. He said that the industry needs LEDs that are within a 1-step SDCM ellipse in terms of chromaticity and a 2-step SDCM ellipse in terms of CCT. Steen also demonstrated issues with CRI using a saturated red color patch and light sources with different spectral power distributions. Color rendering is one area in which he laments the lack of a usable standard. Differing with Freyssinier, Steen spoke positively about color quality scale (CQS) as an accurate metric. Steen said “I hope the industry actually adopts it so that we can try to get down to one metric.” Still, Steen’s larger concern is the need for standards that define color shift over time (and obviously LEDs that would meet such standards). He said, “It might not be lumen depreciation that defines lifetime of LEDs. It may indeed be color that defines the lifetime of a source.” The LM-80 standard used to specify LED lifetime does not really address color, said Steen. It does require an LED maker to disclose color shift over 6000 hours, but doesn’t set limits on acceptable shift. Steen said that Energy Star requires luminaires to maintain color within a range of 0.007 relative to the CIE 1976 color space. But that delta, according to Steen, is in the range of a 7-step SDCM ellipse. CELMA has even less rigorous guidelines in Europe. Accepted quality levels Steen understands the difficulty faced by the standards bodies. He said “Statisticians do not know how to statistically extrapolate color movement over time.” Steen said the industry has mistakenly accepted that color consistency is assured by LEDs that fall within a 3-step SDCM ellipse out of the box, and in the worst case, those LEDs should shift a maximum of 5 additional steps over time. In general the industry is managing to live with such performance, in part according to Steen because all of the LEDs in an installation typically shift in the same direction over time. FIG. 5.But Steen presented the scenario depicted in Fig. 4 that shows a huge potential problem. The point in the upper left corner of the red box represents an LED at the 3-step line out of the box. Over time, that LED shifts in color up and to the left out to the range of an 8-step SDCM ellipse. Say one lamp or LED module in a group of sources fails and has to be replaced. The replacement meets the 3-step limit for a new component but is actually at the low, right corner of the ellipse in Fig. 4. The result is an 11-step difference in installed sources, and that could be unsightly.As a solution, Steen proposed a color-maintenance curve that is modeled after the commonly used lumen-maintenance curve and specs such as hours to L70. He proposed holding LED color maintenance to the 1-step chromaticity and 2-step CCT limits that he discussed earlier.
- Jean Paul Freyssinier, research scientist at the Lighting Research Center (LRC) at Rensselaer Polytechnic Institute, targeted both measures of color rendering and color temperature in his presentation entitled “Class A lighting.” FIG. 3.Addressing color rendering index (CRI), correlated color temperature (CCT) and other metrics, Freyssinier said, “None of the metrics that we use are perfectly predictive of peoples’ perception or assessment of light sources.” He explained that the metrics are meant to describe the physical characteristics of a light source – i.e. the stimulus to a person, but not the perception of the person. Focusing specifically on color rendering, Freyssinier said that the lighting industry now accepts that “no single metric can characterize color rendering.” He said that there are too many dimensions to color rendering – including color fidelity, saturation, and discrimination of hues – to capture in a single metric (). Whether Freyssinier is right about an industry-wide opinion on color rendering or not, he used the SIL platform to advocate the LRC’s gamut area index (GAI) metric that is meant to be used in combination with CRI. Freyssinier said that people prefer a light source that enhances color without distortion or making the object look unnatural. And he said that light sources with high CRI and GAI will consistently outperform light sources that rate high in only one of these two metrics. Chromaticity variances The bulk of Freyssinier's presentation, however, was focused on CCT and perhaps a misguided perception of the accepted definition of a white light source. Freyssinier said, “By definition CCT is a line in the color space, not a single point.” Two light sources can have the same CCT and still be quite different in terms of chromaticity in the CIE 1931 color space. The industry widely accepts that the black-body locus that’s plotted in the color space represents a white source at varying CCT values. But the LRC performed a study to seek the answer to Freyssinier’s question, “Is there a difference in terms of perception or preference for end users?” FIG. 4.The study utilized a viewing box with multiple light sources. Computer control allowed the researchers to produce light at specific CCT, chromaticity and brightness levels. Testers were shown light at six CCTs ranging from 2700-6500K. At each CCT, the testers were asked to judge light at seven different chromaticity values along the CCT line with the values ranging well above and below the black-body locus.The testers were asked to respond immediately after seeing each light source and after an adaption period of 45 seconds. The testers judged the hue of the light source responding to whether they perceived the source to be green/yellow in nature or purple/violet. The testers were also asked to rate the hue relative to their perception of pure white. The details of the research are lengthy in nature, but Fig. 3 shows a surprising result. Only at around 4100K did the perception of the testers align with the black-body locus. At cooler CCTs the testers preferred chromaticity slightly above the locus. More importantly, at warmer CCTs the testers preferred chromaticity significantly below the locus. Chromaticity white points At 2700K, Freyssinier said that the difference in terms of perception between the black-body locus and the preferred white point is equal to a 13-15-step MacAdam ellipse (also referred to as a SDCM or standard deviation of color matching ellipse). Freyssinier said that the difference in terms of perception between the black-body locus and the preferred white point at 2700K is greater than the perceived difference between the three white points at 3500K, 3000K, and 2700K despite the fact that those white points are more spread out on the color-space graph. Closing the loop around color rendering, CCT, and chromaticity, Freyssinier addressed the title of his presentation. He defines a Class A light source as one that has CRI above 80, GAI between 80 and 100, and chromaticity located along the white line in the color space identified by the LRC’s study. Ron Steen, VP business development at Xicato, also addressed color quality and focused on the lack of standards that specify color deviation and the problem of changes in color over time of LED sources. Steen said that SSL deployment is happening, but not as quickly as some industry proponents believe it should. He said that the LED industry focus has been on efficacy and that great progress has been made in that area. But he asked, “With 150 lm/W, why isn’t [mass adoption of SSL] happening?” Steen answered saying “Maybe one of the reasons it hasn’t happened is because it’s ugly.” Color variance Steen used a screen to project light with different characteristics to demonstrate the potential problems that the LED industry still faces in terms of color consistency. First he compared two 3000K sources side by side that were within the 7-step SDCM bounds of the ANSI binning scheme for LEDs. The lights had only a 19K difference in CCT. The difference was noticeable but perhaps not unacceptable. He then showed two sources that fell within a 4-step SDCM ellipse. But in this case he used sources that were 39K apart albeit much closer in chromaticity. The difference was significant and Steen concluded that it would be problematic in most lighting applications. He said that the industry needs LEDs that are within a 1-step SDCM ellipse in terms of chromaticity and a 2-step SDCM ellipse in terms of CCT. Steen also demonstrated issues with CRI using a saturated red color patch and light sources with different spectral power distributions. Color rendering is one area in which he laments the lack of a usable standard. Differing with Freyssinier, Steen spoke positively about color quality scale (CQS) as an accurate metric. Steen said “I hope the industry actually adopts it so that we can try to get down to one metric.” Still, Steen’s larger concern is the need for standards that define color shift over time (and obviously LEDs that would meet such standards). He said, “It might not be lumen depreciation that defines lifetime of LEDs. It may indeed be color that defines the lifetime of a source.” The LM-80 standard used to specify LED lifetime does not really address color, said Steen. It does require an LED maker to disclose color shift over 6000 hours, but doesn’t set limits on acceptable shift. Steen said that Energy Star requires luminaires to maintain color within a range of 0.007 relative to the CIE 1976 color space. But that delta, according to Steen, is in the range of a 7-step SDCM ellipse. CELMA has even less rigorous guidelines in Europe. Accepted quality levels Steen understands the difficulty faced by the standards bodies. He said “Statisticians do not know how to statistically extrapolate color movement over time.” Steen said the industry has mistakenly accepted that color consistency is assured by LEDs that fall within a 3-step SDCM ellipse out of the box, and in the worst case, those LEDs should shift a maximum of 5 additional steps over time. In general the industry is managing to live with such performance, in part according to Steen because all of the LEDs in an installation typically shift in the same direction over time. FIG. 5.But Steen presented the scenario depicted in Fig. 4 that shows a huge potential problem. The point in the upper left corner of the red box represents an LED at the 3-step line out of the box. Over time, that LED shifts in color up and to the left out to the range of an 8-step SDCM ellipse. Say one lamp or LED module in a group of sources fails and has to be replaced. The replacement meets the 3-step limit for a new component but is actually at the low, right corner of the ellipse in Fig. 4. The result is an 11-step difference in installed sources, and that could be unsightly.As a solution, Steen proposed a color-maintenance curve that is modeled after the commonly used lumen-maintenance curve and specs such as hours to L70. He proposed holding LED color maintenance to the 1-step chromaticity and 2-step CCT limits that he discussed earlier.
- Jean Paul Freyssinier, research scientist at the Lighting Research Center (LRC) at Rensselaer Polytechnic Institute, targeted both measures of color rendering and color temperature in his presentation entitled “Class A lighting.” FIG. 3.Addressing color rendering index (CRI), correlated color temperature (CCT) and other metrics, Freyssinier said, “None of the metrics that we use are perfectly predictive of peoples’ perception or assessment of light sources.” He explained that the metrics are meant to describe the physical characteristics of a light source – i.e. the stimulus to a person, but not the perception of the person. Focusing specifically on color rendering, Freyssinier said that the lighting industry now accepts that “no single metric can characterize color rendering.” He said that there are too many dimensions to color rendering – including color fidelity, saturation, and discrimination of hues – to capture in a single metric (). Whether Freyssinier is right about an industry-wide opinion on color rendering or not, he used the SIL platform to advocate the LRC’s gamut area index (GAI) metric that is meant to be used in combination with CRI. Freyssinier said that people prefer a light source that enhances color without distortion or making the object look unnatural. And he said that light sources with high CRI and GAI will consistently outperform light sources that rate high in only one of these two metrics. Chromaticity variances The bulk of Freyssinier's presentation, however, was focused on CCT and perhaps a misguided perception of the accepted definition of a white light source. Freyssinier said, “By definition CCT is a line in the color space, not a single point.” Two light sources can have the same CCT and still be quite different in terms of chromaticity in the CIE 1931 color space. The industry widely accepts that the black-body locus that’s plotted in the color space represents a white source at varying CCT values. But the LRC performed a study to seek the answer to Freyssinier’s question, “Is there a difference in terms of perception or preference for end users?” FIG. 4.The study utilized a viewing box with multiple light sources. Computer control allowed the researchers to produce light at specific CCT, chromaticity and brightness levels. Testers were shown light at six CCTs ranging from 2700-6500K. At each CCT, the testers were asked to judge light at seven different chromaticity values along the CCT line with the values ranging well above and below the black-body locus.The testers were asked to respond immediately after seeing each light source and after an adaption period of 45 seconds. The testers judged the hue of the light source responding to whether they perceived the source to be green/yellow in nature or purple/violet. The testers were also asked to rate the hue relative to their perception of pure white. The details of the research are lengthy in nature, but Fig. 3 shows a surprising result. Only at around 4100K did the perception of the testers align with the black-body locus. At cooler CCTs the testers preferred chromaticity slightly above the locus. More importantly, at warmer CCTs the testers preferred chromaticity significantly below the locus. Chromaticity white points At 2700K, Freyssinier said that the difference in terms of perception between the black-body locus and the preferred white point is equal to a 13-15-step MacAdam ellipse (also referred to as a SDCM or standard deviation of color matching ellipse). Freyssinier said that the difference in terms of perception between the black-body locus and the preferred white point at 2700K is greater than the perceived difference between the three white points at 3500K, 3000K, and 2700K despite the fact that those white points are more spread out on the color-space graph. Closing the loop around color rendering, CCT, and chromaticity, Freyssinier addressed the title of his presentation. He defines a Class A light source as one that has CRI above 80, GAI between 80 and 100, and chromaticity located along the white line in the color space identified by the LRC’s study. Ron Steen, VP business development at Xicato, also addressed color quality and focused on the lack of standards that specify color deviation and the problem of changes in color over time of LED sources. Steen said that SSL deployment is happening, but not as quickly as some industry proponents believe it should. He said that the LED industry focus has been on efficacy and that great progress has been made in that area. But he asked, “With 150 lm/W, why isn’t [mass adoption of SSL] happening?” Steen answered saying “Maybe one of the reasons it hasn’t happened is because it’s ugly.” Color variance Steen used a screen to project light with different characteristics to demonstrate the potential problems that the LED industry still faces in terms of color consistency. First he compared two 3000K sources side by side that were within the 7-step SDCM bounds of the ANSI binning scheme for LEDs. The lights had only a 19K difference in CCT. The difference was noticeable but perhaps not unacceptable. He then showed two sources that fell within a 4-step SDCM ellipse. But in this case he used sources that were 39K apart albeit much closer in chromaticity. The difference was significant and Steen concluded that it would be problematic in most lighting applications. He said that the industry needs LEDs that are within a 1-step SDCM ellipse in terms of chromaticity and a 2-step SDCM ellipse in terms of CCT. Steen also demonstrated issues with CRI using a saturated red color patch and light sources with different spectral power distributions. Color rendering is one area in which he laments the lack of a usable standard. Differing with Freyssinier, Steen spoke positively about color quality scale (CQS) as an accurate metric. Steen said “I hope the industry actually adopts it so that we can try to get down to one metric.” Still, Steen’s larger concern is the need for standards that define color shift over time (and obviously LEDs that would meet such standards). He said, “It might not be lumen depreciation that defines lifetime of LEDs. It may indeed be color that defines the lifetime of a source.” The LM-80 standard used to specify LED lifetime does not really address color, said Steen. It does require an LED maker to disclose color shift over 6000 hours, but doesn’t set limits on acceptable shift. Steen said that Energy Star requires luminaires to maintain color within a range of 0.007 relative to the CIE 1976 color space. But that delta, according to Steen, is in the range of a 7-step SDCM ellipse. CELMA has even less rigorous guidelines in Europe. Accepted quality levels Steen understands the difficulty faced by the standards bodies. He said “Statisticians do not know how to statistically extrapolate color movement over time.” Steen said the industry has mistakenly accepted that color consistency is assured by LEDs that fall within a 3-step SDCM ellipse out of the box, and in the worst case, those LEDs should shift a maximum of 5 additional steps over time. In general the industry is managing to live with such performance, in part according to Steen because all of the LEDs in an installation typically shift in the same direction over time. FIG. 5.But Steen presented the scenario depicted in Fig. 4 that shows a huge potential problem. The point in the upper left corner of the red box represents an LED at the 3-step line out of the box. Over time, that LED shifts in color up and to the left out to the range of an 8-step SDCM ellipse. Say one lamp or LED module in a group of sources fails and has to be replaced. The replacement meets the 3-step limit for a new component but is actually at the low, right corner of the ellipse in Fig. 4. The result is an 11-step difference in installed sources, and that could be unsightly.As a solution, Steen proposed a color-maintenance curve that is modeled after the commonly used lumen-maintenance curve and specs such as hours to L70. He proposed holding LED color maintenance to the 1-step chromaticity and 2-step CCT limits that he discussed earlier.
- Jean Paul Freyssinier, research scientist at the Lighting Research Center (LRC) at Rensselaer Polytechnic Institute, targeted both measures of color rendering and color temperature in his presentation entitled “Class A lighting.” FIG. 3.Addressing color rendering index (CRI), correlated color temperature (CCT) and other metrics, Freyssinier said, “None of the metrics that we use are perfectly predictive of peoples’ perception or assessment of light sources.” He explained that the metrics are meant to describe the physical characteristics of a light source – i.e. the stimulus to a person, but not the perception of the person. Focusing specifically on color rendering, Freyssinier said that the lighting industry now accepts that “no single metric can characterize color rendering.” He said that there are too many dimensions to color rendering – including color fidelity, saturation, and discrimination of hues – to capture in a single metric (). Whether Freyssinier is right about an industry-wide opinion on color rendering or not, he used the SIL platform to advocate the LRC’s gamut area index (GAI) metric that is meant to be used in combination with CRI. Freyssinier said that people prefer a light source that enhances color without distortion or making the object look unnatural. And he said that light sources with high CRI and GAI will consistently outperform light sources that rate high in only one of these two metrics. Chromaticity variances The bulk of Freyssinier's presentation, however, was focused on CCT and perhaps a misguided perception of the accepted definition of a white light source. Freyssinier said, “By definition CCT is a line in the color space, not a single point.” Two light sources can have the same CCT and still be quite different in terms of chromaticity in the CIE 1931 color space. The industry widely accepts that the black-body locus that’s plotted in the color space represents a white source at varying CCT values. But the LRC performed a study to seek the answer to Freyssinier’s question, “Is there a difference in terms of perception or preference for end users?” FIG. 4.The study utilized a viewing box with multiple light sources. Computer control allowed the researchers to produce light at specific CCT, chromaticity and brightness levels. Testers were shown light at six CCTs ranging from 2700-6500K. At each CCT, the testers were asked to judge light at seven different chromaticity values along the CCT line with the values ranging well above and below the black-body locus.The testers were asked to respond immediately after seeing each light source and after an adaption period of 45 seconds. The testers judged the hue of the light source responding to whether they perceived the source to be green/yellow in nature or purple/violet. The testers were also asked to rate the hue relative to their perception of pure white. The details of the research are lengthy in nature, but Fig. 3 shows a surprising result. Only at around 4100K did the perception of the testers align with the black-body locus. At cooler CCTs the testers preferred chromaticity slightly above the locus. More importantly, at warmer CCTs the testers preferred chromaticity significantly below the locus. Chromaticity white points At 2700K, Freyssinier said that the difference in terms of perception between the black-body locus and the preferred white point is equal to a 13-15-step MacAdam ellipse (also referred to as a SDCM or standard deviation of color matching ellipse). Freyssinier said that the difference in terms of perception between the black-body locus and the preferred white point at 2700K is greater than the perceived difference between the three white points at 3500K, 3000K, and 2700K despite the fact that those white points are more spread out on the color-space graph. Closing the loop around color rendering, CCT, and chromaticity, Freyssinier addressed the title of his presentation. He defines a Class A light source as one that has CRI above 80, GAI between 80 and 100, and chromaticity located along the white line in the color space identified by the LRC’s study. Ron Steen, VP business development at Xicato, also addressed color quality and focused on the lack of standards that specify color deviation and the problem of changes in color over time of LED sources. Steen said that SSL deployment is happening, but not as quickly as some industry proponents believe it should. He said that the LED industry focus has been on efficacy and that great progress has been made in that area. But he asked, “With 150 lm/W, why isn’t [mass adoption of SSL] happening?” Steen answered saying “Maybe one of the reasons it hasn’t happened is because it’s ugly.” Color variance Steen used a screen to project light with different characteristics to demonstrate the potential problems that the LED industry still faces in terms of color consistency. First he compared two 3000K sources side by side that were within the 7-step SDCM bounds of the ANSI binning scheme for LEDs. The lights had only a 19K difference in CCT. The difference was noticeable but perhaps not unacceptable. He then showed two sources that fell within a 4-step SDCM ellipse. But in this case he used sources that were 39K apart albeit much closer in chromaticity. The difference was significant and Steen concluded that it would be problematic in most lighting applications. He said that the industry needs LEDs that are within a 1-step SDCM ellipse in terms of chromaticity and a 2-step SDCM ellipse in terms of CCT. Steen also demonstrated issues with CRI using a saturated red color patch and light sources with different spectral power distributions. Color rendering is one area in which he laments the lack of a usable standard. Differing with Freyssinier, Steen spoke positively about color quality scale (CQS) as an accurate metric. Steen said “I hope the industry actually adopts it so that we can try to get down to one metric.” Still, Steen’s larger concern is the need for standards that define color shift over time (and obviously LEDs that would meet such standards). He said, “It might not be lumen depreciation that defines lifetime of LEDs. It may indeed be color that defines the lifetime of a source.” The LM-80 standard used to specify LED lifetime does not really address color, said Steen. It does require an LED maker to disclose color shift over 6000 hours, but doesn’t set limits on acceptable shift. Steen said that Energy Star requires luminaires to maintain color within a range of 0.007 relative to the CIE 1976 color space. But that delta, according to Steen, is in the range of a 7-step SDCM ellipse. CELMA has even less rigorous guidelines in Europe. Accepted quality levels Steen understands the difficulty faced by the standards bodies. He said “Statisticians do not know how to statistically extrapolate color movement over time.” Steen said the industry has mistakenly accepted that color consistency is assured by LEDs that fall within a 3-step SDCM ellipse out of the box, and in the worst case, those LEDs should shift a maximum of 5 additional steps over time. In general the industry is managing to live with such performance, in part according to Steen because all of the LEDs in an installation typically shift in the same direction over time. FIG. 5.But Steen presented the scenario depicted in Fig. 4 that shows a huge potential problem. The point in the upper left corner of the red box represents an LED at the 3-step line out of the box. Over time, that LED shifts in color up and to the left out to the range of an 8-step SDCM ellipse. Say one lamp or LED module in a group of sources fails and has to be replaced. The replacement meets the 3-step limit for a new component but is actually at the low, right corner of the ellipse in Fig. 4. The result is an 11-step difference in installed sources, and that could be unsightly.As a solution, Steen proposed a color-maintenance curve that is modeled after the commonly used lumen-maintenance curve and specs such as hours to L70. He proposed holding LED color maintenance to the 1-step chromaticity and 2-step CCT limits that he discussed earlier.
- Jean Paul Freyssinier, research scientist at the Lighting Research Center (LRC) at Rensselaer Polytechnic Institute, targeted both measures of color rendering and color temperature in his presentation entitled “Class A lighting.” FIG. 3.Addressing color rendering index (CRI), correlated color temperature (CCT) and other metrics, Freyssinier said, “None of the metrics that we use are perfectly predictive of peoples’ perception or assessment of light sources.” He explained that the metrics are meant to describe the physical characteristics of a light source – i.e. the stimulus to a person, but not the perception of the person. Focusing specifically on color rendering, Freyssinier said that the lighting industry now accepts that “no single metric can characterize color rendering.” He said that there are too many dimensions to color rendering – including color fidelity, saturation, and discrimination of hues – to capture in a single metric (). Whether Freyssinier is right about an industry-wide opinion on color rendering or not, he used the SIL platform to advocate the LRC’s gamut area index (GAI) metric that is meant to be used in combination with CRI. Freyssinier said that people prefer a light source that enhances color without distortion or making the object look unnatural. And he said that light sources with high CRI and GAI will consistently outperform light sources that rate high in only one of these two metrics. Chromaticity variances The bulk of Freyssinier's presentation, however, was focused on CCT and perhaps a misguided perception of the accepted definition of a white light source. Freyssinier said, “By definition CCT is a line in the color space, not a single point.” Two light sources can have the same CCT and still be quite different in terms of chromaticity in the CIE 1931 color space. The industry widely accepts that the black-body locus that’s plotted in the color space represents a white source at varying CCT values. But the LRC performed a study to seek the answer to Freyssinier’s question, “Is there a difference in terms of perception or preference for end users?” FIG. 4.The study utilized a viewing box with multiple light sources. Computer control allowed the researchers to produce light at specific CCT, chromaticity and brightness levels. Testers were shown light at six CCTs ranging from 2700-6500K. At each CCT, the testers were asked to judge light at seven different chromaticity values along the CCT line with the values ranging well above and below the black-body locus.The testers were asked to respond immediately after seeing each light source and after an adaption period of 45 seconds. The testers judged the hue of the light source responding to whether they perceived the source to be green/yellow in nature or purple/violet. The testers were also asked to rate the hue relative to their perception of pure white. The details of the research are lengthy in nature, but Fig. 3 shows a surprising result. Only at around 4100K did the perception of the testers align with the black-body locus. At cooler CCTs the testers preferred chromaticity slightly above the locus. More importantly, at warmer CCTs the testers preferred chromaticity significantly below the locus. Chromaticity white points At 2700K, Freyssinier said that the difference in terms of perception between the black-body locus and the preferred white point is equal to a 13-15-step MacAdam ellipse (also referred to as a SDCM or standard deviation of color matching ellipse). Freyssinier said that the difference in terms of perception between the black-body locus and the preferred white point at 2700K is greater than the perceived difference between the three white points at 3500K, 3000K, and 2700K despite the fact that those white points are more spread out on the color-space graph. Closing the loop around color rendering, CCT, and chromaticity, Freyssinier addressed the title of his presentation. He defines a Class A light source as one that has CRI above 80, GAI between 80 and 100, and chromaticity located along the white line in the color space identified by the LRC’s study. Ron Steen, VP business development at Xicato, also addressed color quality and focused on the lack of standards that specify color deviation and the problem of changes in color over time of LED sources. Steen said that SSL deployment is happening, but not as quickly as some industry proponents believe it should. He said that the LED industry focus has been on efficacy and that great progress has been made in that area. But he asked, “With 150 lm/W, why isn’t [mass adoption of SSL] happening?” Steen answered saying “Maybe one of the reasons it hasn’t happened is because it’s ugly.” Color variance Steen used a screen to project light with different characteristics to demonstrate the potential problems that the LED industry still faces in terms of color consistency. First he compared two 3000K sources side by side that were within the 7-step SDCM bounds of the ANSI binning scheme for LEDs. The lights had only a 19K difference in CCT. The difference was noticeable but perhaps not unacceptable. He then showed two sources that fell within a 4-step SDCM ellipse. But in this case he used sources that were 39K apart albeit much closer in chromaticity. The difference was significant and Steen concluded that it would be problematic in most lighting applications. He said that the industry needs LEDs that are within a 1-step SDCM ellipse in terms of chromaticity and a 2-step SDCM ellipse in terms of CCT. Steen also demonstrated issues with CRI using a saturated red color patch and light sources with different spectral power distributions. Color rendering is one area in which he laments the lack of a usable standard. Differing with Freyssinier, Steen spoke positively about color quality scale (CQS) as an accurate metric. Steen said “I hope the industry actually adopts it so that we can try to get down to one metric.” Still, Steen’s larger concern is the need for standards that define color shift over time (and obviously LEDs that would meet such standards). He said, “It might not be lumen depreciation that defines lifetime of LEDs. It may indeed be color that defines the lifetime of a source.” The LM-80 standard used to specify LED lifetime does not really address color, said Steen. It does require an LED maker to disclose color shift over 6000 hours, but doesn’t set limits on acceptable shift. Steen said that Energy Star requires luminaires to maintain color within a range of 0.007 relative to the CIE 1976 color space. But that delta, according to Steen, is in the range of a 7-step SDCM ellipse. CELMA has even less rigorous guidelines in Europe. Accepted quality levels Steen understands the difficulty faced by the standards bodies. He said “Statisticians do not know how to statistically extrapolate color movement over time.” Steen said the industry has mistakenly accepted that color consistency is assured by LEDs that fall within a 3-step SDCM ellipse out of the box, and in the worst case, those LEDs should shift a maximum of 5 additional steps over time. In general the industry is managing to live with such performance, in part according to Steen because all of the LEDs in an installation typically shift in the same direction over time. FIG. 5.But Steen presented the scenario depicted in Fig. 4 that shows a huge potential problem. The point in the upper left corner of the red box represents an LED at the 3-step line out of the box. Over time, that LED shifts in color up and to the left out to the range of an 8-step SDCM ellipse. Say one lamp or LED module in a group of sources fails and has to be replaced. The replacement meets the 3-step limit for a new component but is actually at the low, right corner of the ellipse in Fig. 4. The result is an 11-step difference in installed sources, and that could be unsightly.As a solution, Steen proposed a color-maintenance curve that is modeled after the commonly used lumen-maintenance curve and specs such as hours to L70. He proposed holding LED color maintenance to the 1-step chromaticity and 2-step CCT limits that he discussed earlier.
- Jean Paul Freyssinier, research scientist at the Lighting Research Center (LRC) at Rensselaer Polytechnic Institute, targeted both measures of color rendering and color temperature in his presentation entitled “Class A lighting.” FIG. 3.Addressing color rendering index (CRI), correlated color temperature (CCT) and other metrics, Freyssinier said, “None of the metrics that we use are perfectly predictive of peoples’ perception or assessment of light sources.” He explained that the metrics are meant to describe the physical characteristics of a light source – i.e. the stimulus to a person, but not the perception of the person. Focusing specifically on color rendering, Freyssinier said that the lighting industry now accepts that “no single metric can characterize color rendering.” He said that there are too many dimensions to color rendering – including color fidelity, saturation, and discrimination of hues – to capture in a single metric (). Whether Freyssinier is right about an industry-wide opinion on color rendering or not, he used the SIL platform to advocate the LRC’s gamut area index (GAI) metric that is meant to be used in combination with CRI. Freyssinier said that people prefer a light source that enhances color without distortion or making the object look unnatural. And he said that light sources with high CRI and GAI will consistently outperform light sources that rate high in only one of these two metrics. Chromaticity variances The bulk of Freyssinier's presentation, however, was focused on CCT and perhaps a misguided perception of the accepted definition of a white light source. Freyssinier said, “By definition CCT is a line in the color space, not a single point.” Two light sources can have the same CCT and still be quite different in terms of chromaticity in the CIE 1931 color space. The industry widely accepts that the black-body locus that’s plotted in the color space represents a white source at varying CCT values. But the LRC performed a study to seek the answer to Freyssinier’s question, “Is there a difference in terms of perception or preference for end users?” FIG. 4.The study utilized a viewing box with multiple light sources. Computer control allowed the researchers to produce light at specific CCT, chromaticity and brightness levels. Testers were shown light at six CCTs ranging from 2700-6500K. At each CCT, the testers were asked to judge light at seven different chromaticity values along the CCT line with the values ranging well above and below the black-body locus.The testers were asked to respond immediately after seeing each light source and after an adaption period of 45 seconds. The testers judged the hue of the light source responding to whether they perceived the source to be green/yellow in nature or purple/violet. The testers were also asked to rate the hue relative to their perception of pure white. The details of the research are lengthy in nature, but Fig. 3 shows a surprising result. Only at around 4100K did the perception of the testers align with the black-body locus. At cooler CCTs the testers preferred chromaticity slightly above the locus. More importantly, at warmer CCTs the testers preferred chromaticity significantly below the locus. Chromaticity white points At 2700K, Freyssinier said that the difference in terms of perception between the black-body locus and the preferred white point is equal to a 13-15-step MacAdam ellipse (also referred to as a SDCM or standard deviation of color matching ellipse). Freyssinier said that the difference in terms of perception between the black-body locus and the preferred white point at 2700K is greater than the perceived difference between the three white points at 3500K, 3000K, and 2700K despite the fact that those white points are more spread out on the color-space graph. Closing the loop around color rendering, CCT, and chromaticity, Freyssinier addressed the title of his presentation. He defines a Class A light source as one that has CRI above 80, GAI between 80 and 100, and chromaticity located along the white line in the color space identified by the LRC’s study. Ron Steen, VP business development at Xicato, also addressed color quality and focused on the lack of standards that specify color deviation and the problem of changes in color over time of LED sources. Steen said that SSL deployment is happening, but not as quickly as some industry proponents believe it should. He said that the LED industry focus has been on efficacy and that great progress has been made in that area. But he asked, “With 150 lm/W, why isn’t [mass adoption of SSL] happening?” Steen answered saying “Maybe one of the reasons it hasn’t happened is because it’s ugly.” Color variance Steen used a screen to project light with different characteristics to demonstrate the potential problems that the LED industry still faces in terms of color consistency. First he compared two 3000K sources side by side that were within the 7-step SDCM bounds of the ANSI binning scheme for LEDs. The lights had only a 19K difference in CCT. The difference was noticeable but perhaps not unacceptable. He then showed two sources that fell within a 4-step SDCM ellipse. But in this case he used sources that were 39K apart albeit much closer in chromaticity. The difference was significant and Steen concluded that it would be problematic in most lighting applications. He said that the industry needs LEDs that are within a 1-step SDCM ellipse in terms of chromaticity and a 2-step SDCM ellipse in terms of CCT. Steen also demonstrated issues with CRI using a saturated red color patch and light sources with different spectral power distributions. Color rendering is one area in which he laments the lack of a usable standard. Differing with Freyssinier, Steen spoke positively about color quality scale (CQS) as an accurate metric. Steen said “I hope the industry actually adopts it so that we can try to get down to one metric.” Still, Steen’s larger concern is the need for standards that define color shift over time (and obviously LEDs that would meet such standards). He said, “It might not be lumen depreciation that defines lifetime of LEDs. It may indeed be color that defines the lifetime of a source.” The LM-80 standard used to specify LED lifetime does not really address color, said Steen. It does require an LED maker to disclose color shift over 6000 hours, but doesn’t set limits on acceptable shift. Steen said that Energy Star requires luminaires to maintain color within a range of 0.007 relative to the CIE 1976 color space. But that delta, according to Steen, is in the range of a 7-step SDCM ellipse. CELMA has even less rigorous guidelines in Europe. Accepted quality levels Steen understands the difficulty faced by the standards bodies. He said “Statisticians do not know how to statistically extrapolate color movement over time.” Steen said the industry has mistakenly accepted that color consistency is assured by LEDs that fall within a 3-step SDCM ellipse out of the box, and in the worst case, those LEDs should shift a maximum of 5 additional steps over time. In general the industry is managing to live with such performance, in part according to Steen because all of the LEDs in an installation typically shift in the same direction over time. FIG. 5.But Steen presented the scenario depicted in Fig. 4 that shows a huge potential problem. The point in the upper left corner of the red box represents an LED at the 3-step line out of the box. Over time, that LED shifts in color up and to the left out to the range of an 8-step SDCM ellipse. Say one lamp or LED module in a group of sources fails and has to be replaced. The replacement meets the 3-step limit for a new component but is actually at the low, right corner of the ellipse in Fig. 4. The result is an 11-step difference in installed sources, and that could be unsightly.As a solution, Steen proposed a color-maintenance curve that is modeled after the commonly used lumen-maintenance curve and specs such as hours to L70. He proposed holding LED color maintenance to the 1-step chromaticity and 2-step CCT limits that he discussed earlier.
- Jean Paul Freyssinier, research scientist at the Lighting Research Center (LRC) at Rensselaer Polytechnic Institute, targeted both measures of color rendering and color temperature in his presentation entitled “Class A lighting.” FIG. 3.Addressing color rendering index (CRI), correlated color temperature (CCT) and other metrics, Freyssinier said, “None of the metrics that we use are perfectly predictive of peoples’ perception or assessment of light sources.” He explained that the metrics are meant to describe the physical characteristics of a light source – i.e. the stimulus to a person, but not the perception of the person. Focusing specifically on color rendering, Freyssinier said that the lighting industry now accepts that “no single metric can characterize color rendering.” He said that there are too many dimensions to color rendering – including color fidelity, saturation, and discrimination of hues – to capture in a single metric (). Whether Freyssinier is right about an industry-wide opinion on color rendering or not, he used the SIL platform to advocate the LRC’s gamut area index (GAI) metric that is meant to be used in combination with CRI. Freyssinier said that people prefer a light source that enhances color without distortion or making the object look unnatural. And he said that light sources with high CRI and GAI will consistently outperform light sources that rate high in only one of these two metrics. Chromaticity variances The bulk of Freyssinier's presentation, however, was focused on CCT and perhaps a misguided perception of the accepted definition of a white light source. Freyssinier said, “By definition CCT is a line in the color space, not a single point.” Two light sources can have the same CCT and still be quite different in terms of chromaticity in the CIE 1931 color space. The industry widely accepts that the black-body locus that’s plotted in the color space represents a white source at varying CCT values. But the LRC performed a study to seek the answer to Freyssinier’s question, “Is there a difference in terms of perception or preference for end users?” FIG. 4.The study utilized a viewing box with multiple light sources. Computer control allowed the researchers to produce light at specific CCT, chromaticity and brightness levels. Testers were shown light at six CCTs ranging from 2700-6500K. At each CCT, the testers were asked to judge light at seven different chromaticity values along the CCT line with the values ranging well above and below the black-body locus.The testers were asked to respond immediately after seeing each light source and after an adaption period of 45 seconds. The testers judged the hue of the light source responding to whether they perceived the source to be green/yellow in nature or purple/violet. The testers were also asked to rate the hue relative to their perception of pure white. The details of the research are lengthy in nature, but Fig. 3 shows a surprising result. Only at around 4100K did the perception of the testers align with the black-body locus. At cooler CCTs the testers preferred chromaticity slightly above the locus. More importantly, at warmer CCTs the testers preferred chromaticity significantly below the locus. Chromaticity white points At 2700K, Freyssinier said that the difference in terms of perception between the black-body locus and the preferred white point is equal to a 13-15-step MacAdam ellipse (also referred to as a SDCM or standard deviation of color matching ellipse). Freyssinier said that the difference in terms of perception between the black-body locus and the preferred white point at 2700K is greater than the perceived difference between the three white points at 3500K, 3000K, and 2700K despite the fact that those white points are more spread out on the color-space graph. Closing the loop around color rendering, CCT, and chromaticity, Freyssinier addressed the title of his presentation. He defines a Class A light source as one that has CRI above 80, GAI between 80 and 100, and chromaticity located along the white line in the color space identified by the LRC’s study. Ron Steen, VP business development at Xicato, also addressed color quality and focused on the lack of standards that specify color deviation and the problem of changes in color over time of LED sources. Steen said that SSL deployment is happening, but not as quickly as some industry proponents believe it should. He said that the LED industry focus has been on efficacy and that great progress has been made in that area. But he asked, “With 150 lm/W, why isn’t [mass adoption of SSL] happening?” Steen answered saying “Maybe one of the reasons it hasn’t happened is because it’s ugly.” Color variance Steen used a screen to project light with different characteristics to demonstrate the potential problems that the LED industry still faces in terms of color consistency. First he compared two 3000K sources side by side that were within the 7-step SDCM bounds of the ANSI binning scheme for LEDs. The lights had only a 19K difference in CCT. The difference was noticeable but perhaps not unacceptable. He then showed two sources that fell within a 4-step SDCM ellipse. But in this case he used sources that were 39K apart albeit much closer in chromaticity. The difference was significant and Steen concluded that it would be problematic in most lighting applications. He said that the industry needs LEDs that are within a 1-step SDCM ellipse in terms of chromaticity and a 2-step SDCM ellipse in terms of CCT. Steen also demonstrated issues with CRI using a saturated red color patch and light sources with different spectral power distributions. Color rendering is one area in which he laments the lack of a usable standard. Differing with Freyssinier, Steen spoke positively about color quality scale (CQS) as an accurate metric. Steen said “I hope the industry actually adopts it so that we can try to get down to one metric.” Still, Steen’s larger concern is the need for standards that define color shift over time (and obviously LEDs that would meet such standards). He said, “It might not be lumen depreciation that defines lifetime of LEDs. It may indeed be color that defines the lifetime of a source.” The LM-80 standard used to specify LED lifetime does not really address color, said Steen. It does require an LED maker to disclose color shift over 6000 hours, but doesn’t set limits on acceptable shift. Steen said that Energy Star requires luminaires to maintain color within a range of 0.007 relative to the CIE 1976 color space. But that delta, according to Steen, is in the range of a 7-step SDCM ellipse. CELMA has even less rigorous guidelines in Europe. Accepted quality levels Steen understands the difficulty faced by the standards bodies. He said “Statisticians do not know how to statistically extrapolate color movement over time.” Steen said the industry has mistakenly accepted that color consistency is assured by LEDs that fall within a 3-step SDCM ellipse out of the box, and in the worst case, those LEDs should shift a maximum of 5 additional steps over time. In general the industry is managing to live with such performance, in part according to Steen because all of the LEDs in an installation typically shift in the same direction over time. FIG. 5.But Steen presented the scenario depicted in Fig. 4 that shows a huge potential problem. The point in the upper left corner of the red box represents an LED at the 3-step line out of the box. Over time, that LED shifts in color up and to the left out to the range of an 8-step SDCM ellipse. Say one lamp or LED module in a group of sources fails and has to be replaced. The replacement meets the 3-step limit for a new component but is actually at the low, right corner of the ellipse in Fig. 4. The result is an 11-step difference in installed sources, and that could be unsightly.As a solution, Steen proposed a color-maintenance curve that is modeled after the commonly used lumen-maintenance curve and specs such as hours to L70. He proposed holding LED color maintenance to the 1-step chromaticity and 2-step CCT limits that he discussed earlier.