SlideShare a Scribd company logo
1 of 67
Download to read offline
Status Review Report:
Orange Clownfish (Amphiprion percula)
©Margaret Paton Walsh
2015
National Marine Fisheries Service
National Oceanic and Atmospheric Administration
U.S. Department of Commerce
2	


Acknowledgements	
  
Numerous individual biologists, scientists, and managers provided information that aided in
preparation of this report and deserve special thanks. We particularly wish to thank Maarten De
Brauwer, Jeff Kinch, Andrew Rhyne, and Colette Wabnitz for information, data, and
professional opinions. We would also like to thank those who submitted information through the
public comment process.
We would especially like to thank the peer reviewers Peter Buston, Maarten De Brauwer, and
Colette Wabnitz for their time and professional review of this report.
This document should be cited as:
Maison, K.A. and K.S. Graham. 2015. Status review report: Orange clownfish (Amphiprion
percula). Report to National Marine Fisheries Service, Office of Protected Resources. July,
2015. 67 p.
3	


Executive	
  Summary	
  
This report was produced in response to a petition received from the Center for Biological
Diversity on September 14, 2012, to list eight species of pomacentrid reef fish as endangered or
threatened under the Endangered Species Act (ESA) and to designate critical habitat for these
species concurrent with the listing. The National Marine Fisheries Service (NMFS) evaluated
the petition to determine whether the petitioner provided substantial information as required by
the ESA to determine that listing these species may be warranted. On September 3, 2014, the
NMFS Pacific Islands Regional Office (PIRO) announced in the Federal Register that the
petition presented substantial information that listing may be warranted for the orange clownfish
(Amphiprion percula), and NMFS requested information on this species from the public (79 FR
52276). Subsequently, NMFS initiated a status review of this species, which we document in
this report. This report summarizes the best available scientific and commercial information on
the orange clownfish, and presents an evaluation of the species’ status and extinction risk.
On September 3, 2014, NMFS PIRO also announced a negative 90-day finding for the six Indo-
Pacific damselfishes: Hawaiian dascyllus (Dascyllus albisella), blue-eyed damselfish
(Plectroglyphidodon johnstonianus), black-axil chromis (Chromis atripectoralis), blue-green
damselfish (Chromis viridis), reticulated damselfish (Dascyllus reticulatus), and blackbar devil
or Dick’s damselfish (Plectroglyphidodon dickii). The NMFS Southeast Regional Office led the
response to the petition to list the yellowtail damselfish (Microspathodon chrysurus) and
announced a negative 90-day finding (80 FR 8619) for that species on February 18, 2015.	
  	
  
In assessing four demographic risks for A. percula -- abundance, growth rate/productivity, spatial
structure, and diversity -- we determined that the likelihood of these risks individually
contributing to the extinction risk for the species is low or unknown. We also assessed current
and predicted threats to the species and determined that the likelihood of these individual threats
contributing to the extinction risk of the species throughout its range varies between very low
and low-to-medium. We acknowledge that uncertainties exist regarding how these demographic
risks and current and predicted threats may affect the species at both the individual and
population levels. 	


Of the 12 identified current and predicted threats, our greatest concern relates to the species’
susceptibility and exposure to sedimentation and nutrients, as well as the inadequacy of
regulatory mechanisms to address this threat, especially since juveniles and adults occur in
shallow water and are non-migratory once they have settled into a host anemone. Therefore, we
conservatively assigned a low-to-medium likelihood that both this threat and the inadequate
regulatory mechanisms to address this threat may significantly contribute to the extinction risk
for A. percula.
The range of the species across heterogeneous habitats, the conservatively estimated abundance
of 13-18 million individuals, the spatial and temporal variation in threats, coupled with resiliency
and potential for trans-generational adaptive capabilities to future impacts all contribute to a low
overall vulnerability of the species to the collective threats we have identified. We have
determined that the overall extinction risk to A. percula is low, both now and in the foreseeable
future.
4	


Table	
  of	
  Contents	
  	
  
Acknowledgements	
  .....................................................................................................................................	
  2	
  
Executive	
  Summary	
  .....................................................................................................................................	
  3	
  
1.0.	
  	
   INTRODUCTION	
  ...................................................................................................................	
  6	
  
1.1.	
   Scope	
  and	
  Intent	
  of	
  this	
  Document	
  .....................................................................................	
  6	
  
1.2.	
   Questions	
  and	
  Information	
  Considered	
  in	
  ESA	
  Evaluations	
  ................................................	
  6	
  
2.0.	
  	
   LIFE	
  HISTORY	
  AND	
  ECOLOGY	
  ...............................................................................................	
  7	
  
2.1.	
  	
   Classification	
  and	
  Distinctive	
  Characteristics	
  ......................................................................	
  7	
  
2.2.	
   Habitat	
  .................................................................................................................................	
  9	
  
2.3.	
  	
   Diet,	
  Feeding,	
  and	
  Growth	
  ................................................................................................	
  11	
  
2.4.	
  	
   Reproduction	
  and	
  Development	
  .......................................................................................	
  12	
  
2.5.	
   Settlement	
  and	
  Recruitment	
  .............................................................................................	
  13	
  
2.6.	
  	
   Longevity	
  and	
  Resilience	
  ...................................................................................................	
  14	
  
2.7.	
  	
   Geographic	
  Range	
  .............................................................................................................	
  15	
  
2.8.	
   Distribution	
  and	
  Connectivity	
  ............................................................................................	
  16	
  
2.9.	
  	
   Estimated	
  Abundance	
  .......................................................................................................	
  20	
  
3.0.	
  	
   ASSESSMENT	
  OF	
  EXTINCTION	
  RISK	
  ..............................................................................	
  20	
  
3.1.	
  	
   Approach	
  to	
  Evaluating	
  Extinction	
  Risk	
  .............................................................................	
  20	
  
3.1.1.	
   Foreseeable	
  Future	
  ............................................................................................................	
  22	
  
3.2.	
  	
   Demographic	
  Risks	
  ............................................................................................................	
  22	
  
3.2.1.	
   Abundance	
  .........................................................................................................................	
  23	
  
3.2.2.	
   Population	
  Growth	
  Rate	
  /	
  Productivity	
  ..............................................................................	
  23	
  
3.2.3.	
   Spatial	
  Structure	
  /	
  Connectivity	
  .........................................................................................	
  24	
  
3.2.4.	
   Diversity	
  .............................................................................................................................	
  25	
  
3.3.	
   Analysis	
  of	
  the	
  ESA	
  Section	
  4(A)(1)	
  Factors	
  .......................................................................	
  26	
  
3.3.1.	
   Factor	
  A:	
  Present	
  or	
  Threatened	
  Destruction,	
  Modification	
  or	
  Curtailment	
  of	
  Habitat	
  or	
  
Range	
  .................................................................................................................................	
  27	
  
3.3.2.	
   Factor	
  B:	
  Overutilization	
  for	
  Commercial,	
  Recreational,	
  Scientific,	
  or	
  Educational	
  Purposes
	
  ...........................................................................................................................................	
  32	
  
3.3.3.	
   Factor	
  C:	
  Disease	
  or	
  Predation	
  ...........................................................................................	
  37	
  
3.3.4.	
  	
   Factor	
  D:	
  Inadequacy	
  of	
  Existing	
  Regulatory	
  Mechanisms	
  ................................................	
  37	
  
3.3.5.	
   Factor	
  E:	
  Other	
  Natural	
  or	
  Manmade	
  Factors	
  ....................................................................	
  44	
  
5	


3.3.6.	
  	
   Summary	
  of	
  Threats	
  ...........................................................................................................	
  47	
  
4.0.	
  	
   CONSERVATION	
  EFFORTS	
  ..................................................................................................	
  48	
  
5.0.	
  	
   SYNTHESIS	
  AND	
  CONCLUSION	
  ...........................................................................................	
  50	
  
6.0.	
   REFERENCES	
  ......................................................................................................................	
  51	


6	


1.0.	
  	
   INTRODUCTION	
  
1.1.	
   Scope	
  and	
  Intent	
  of	
  this	
  Document	
  
This report documents the status review conducted in response to a petition1
to list the orange
clownfish (Amphiprion percula) under the Endangered Species Act (ESA). Under the ESA, if a
petition is found to present substantial scientific or commercial information that the petitioned
action may be warranted, a status review shall be promptly commenced (16 U.S.C.
1533(b)(3)(A)). The National Marine Fisheries Service (NMFS or NOAA Fisheries) determined
that the petition presented substantial information that a status review was warranted for the
orange clownfish (79 FR 52276; September 3, 2014), and promptly initiated a status review. The
ESA stipulates that listing determinations should be made based on the best scientific and
commercial information available, after taking into consideration any efforts by any State or
foreign nation, or any political subdivision of a State or foreign nation, to protect the species (16
U.S.C. §1533(b)).
NMFS assigned two Endangered Species Biologists in the Protected Resources Division of the
NMFS Pacific Islands Regional Office (PIRO) to compile the best available data on this species,
and complete a thorough review of the biology, population status, and future outlook for this
species. An extensive literature search was undertaken and researchers were contacted regarding
gray literature and additional information. As announced in the 90-day finding, NMFS also
solicited the public for relevant data and information from September 3, 2014, through
November 3, 2014. Relevant information submitted by the public, contributed by experts, and
extracted from the literature search is incorporated into this status review.
This status review includes an analysis of the biology, demography, and ecology of the species,
threats to the species, and makes conclusions regarding the extinction risk of the species. For the
risk assessment, we used a qualitative reference level of relative extinction risk modified from
the reference levels commonly used in status reviews (e.g., rockfish in the Puget Sound, Banggai
cardinal fish, etc.). Recommendations as to whether the species should be listed as threatened or
endangered were not made. Rather, conclusions are drawn about the overall risk of extinction
faced by the species based on an evaluation of the species’ current status, demographic risks, as
well as present and future threats to the species and how the species is responding, or is likely to
respond in the future, to those threats.
1.2.	
   Questions	
  and	
  Information	
  Considered	
  in	
  ESA	
  Evaluations	
  
In determining whether a listing under the ESA is warranted, two key questions must be
addressed:
1) Is the entity in question a “species” as defined by the ESA?
2) If so, is the “species” threatened or endangered?
Section 3 of the ESA defines a “species” to include “any subspecies of fish or wildlife or plants,
and any distinct population segment (DPS) of any species of vertebrate fish or wildlife which


1
	
  Center for Biological Diversity to U.S. Secretary of Commerce, Acting through the National Oceanic and
Atmospheric Administration and the National Marine Fisheries Service, September 14, 2012, “Petition to list 8
species of Pomacentrid reef fish under the U.S. Endangered Species Act.”	
  
7	


interbreeds when mature.” Section 3 further defines the term “endangered species” as “any
species which is in danger of extinction throughout all or a significant portion of its range.” The
term “threatened species” is defined as “any species which is likely to become an endangered
species within the foreseeable future throughout all or a significant portion of its range.”
NMFS considers a variety of information in evaluating the level of risk faced by a species in
deciding whether the species meets the statutory definition of either threatened or endangered.
Important considerations include 1) absolute numbers of individuals and their spatial and
temporal distribution, 2) current abundance in relation to historical abundance and carrying
capacity of the habitat, 3) trends in abundance, 4) natural and human influenced factors that
cause variability in survival and abundance, 5) possible threats to genetic integrity, and 6) recent
events (e.g., a change in management) that have predictable short-term consequences for
abundance of the species. Additional risk factors, such as disease prevalence or life history
traits, may also be considered in evaluating risk to populations (NMFS 2013).
Under section 4(a)(1) of the ESA, NMFS must determine whether one or more of the following
factors is/are causing a species to be threatened or endangered:
(A) The present or threatened destruction, modification or curtailment of its habitat or
range;
(B) Overutilization for commercial, recreational, scientific, or educational purposes;
(C) Disease or predation;
(D) The inadequacy of existing regulatory mechanisms; or
(E) Other natural or human factors affecting its continued existence.
The determination of whether a species is threatened or endangered must be based on the best
available scientific and commercial information regarding its current status, after taking into
consideration measures in place to conserve the species. The purpose of this document is to
review and summarize the best available information/data to describe the status of the orange
clownfish. A determination as to whether or not the species meets the statutory definition of
threatened or endangered, and therefore may be warranted for listing, is not included in this
document but will be included in the 12-month finding for the species.
2.0.	
  	
   LIFE	
  HISTORY	
  AND	
  ECOLOGY	
  
2.1.	
  	
   Classification	
  and	
  Distinctive	
  Characteristics	
  
The orange clownfish, Amphiprion percula, is a valid taxonomic species within the family
Pomacentridae. The species was first described by Lacepède in 1802, as Lutjanus percula and
later re-described as Amphiprion percula (Florida Museum of Natural History 2005). There are
360 species in the Pomacentridae family that are classified into 29 genera. Two of those genera
contain all 28 recognized species of clownfish: one species in the genus Premnas, and the
remaining species in the genus Amphiprion. The number of recognized clownfish species has
evolved over time due to inconsistent recognition of natural hybrids and geographic color
variants of previously described species as separate species in the literature (Allen 1991; Fautin
and Allen 1997; Buston and Garcia 2007; Ollerton et al. 2007; Allen et al. 2008; Thornhill 2012;
8	


Litsios et al. 2014; and Tao et al. 2014). Their mutualistic relationship with sea anemones is
correlated with the adaptive radiation and accelerated speciation of clownfish species (Litsios et
al. 2012). In addition, hybridization events are linked with diversification in clownfish, and
several recently diverged clownfish lineages likely originated through hybridization. This
suggests that diversification, catalyzed by hybridization events, may still be happening (Litsios
and Salamin 2014).
The taxonomic classification for A. percula is as follows:
Kingdom: Animalia
Phylum: Chordata
Class: Actinopterygii
Order: Perciformes
Family: Pomacentridae
Genus: Amphiprion
Species: percula
The species is known by common English names that include orange clownfish, clown
anemonefish, percula clownfish, percula anemonefish, orange anemonefish, true percula
clownfish, blackfinned clownfish, eastern clownfish, eastern clown anemonefish, and orange-
clown anemonefish (Animal-World 2015). Common names in other languages include bantay
bot-bot (Cebuano); orangegul klovnfisk (Danish); pata (Davawenyo); maumanu ni masao (Gela);
clownfisch (German); samok-samok (Kagayanen); paja-paja (Makassarese); clown fish biak,
gelang roay (Malay); amfiprion (Polish); baro-baro (Visayan); and bantay-kibot (Waray-waray)
(Florida Museum of Natural History 2005). A more comprehensive list of common names can
be found at the Fishbase web site (www.Fishbase.org).
Amphiprion percula is bright orange with three thick white vertical bars (see Figure 1). The
anterior bar occurs just behind the eye, the middle bar bisects the fish and has a forward-
projecting bulge, and the posterior bar occurs near the caudal fin. The white bars have a black
border that varies in width. Orange clownfish have 30-38 pored scales with no interruptions
along the lateral line, and their fins have black tips (Fautin and Allen 1997; Florida Museum of
Natural History 2005). Although this describes the type specimen, some polymorphism does
occur with diverse geographic regional and local color forms, mostly in the form of variation in
the width of the black margin along the white bars (Militz 2015; Timm et al. 2008).
Figure 1: Photograph of A. percula. © www.aquaticcreationsgroup.com
9	


While there is no difference in color pattern between sexes, dimorphic variation is present in size
as females are larger than males (Fautin and Allen 1997; Florida Museum of Natural History
2005). It is important to note that size alone cannot be used to identify the sex of an individual
because individuals in different groups will vary in maximum and minimum size. Maximum
reported length for this species is approximately 80 millimeters (mm) (Fautin and Allen 1997),
but individuals up to 110 mm in length have been reported (Florida Museum of Natural History
2005). Standard length is reported as 46 mm for females and 36 mm for males (Florida Museum
of Natural History 2005). The total length of a fish has been correlated with the diameter of its
host anemone (Fautin 1992), with larger anemones hosting larger clownfish.
Amphiprion percula very closely resembles A. ocellaris, also known as the false percula
clownfish, and the two are considered sibling species. There are several morphological
differences that may allow an observer, upon closer examination, to distinguish between the two
species. Amphiprion percula has 9-10 dorsal spines while A. ocellaris has 10-11 (Timm et al.
2008), and the anterior part of A. percula’s dorsal fin is shorter than that of A. ocellaris. In
addition, A. percula has a thick black margin around its white bars whereas A. ocellaris often has
a thin or even non-existent black margin, though this is not always the case. Amphiprion percula
has been described as more brilliant in color, and its iris is orange, giving the appearance of very
small eyes while the iris of A. ocellaris is grayish-orange, thus giving the appearance of slightly
larger eyes (Florida Museum of Natural History 2005). Ecologically, both species prefer some
of the same host anemone species (Heteractis magnifica; Stichodactyla gigantean; S. mertensii)
(Fautin and Allen 1997; Timm et al. 2008).
Of noted difference is that these two species have an allopatric distribution, meaning their ranges
do not overlap. Amphiprion percula is found in northern Queensland and Melanesia; A. ocellaris
is found in the Andaman and Nicobar Islands (Andaman Sea), Indo-Malayan Archipelago,
Philippines, northwestern Australia, and the coast of Southeast Asia northwards to the Ryukyu
Islands of Japan (Fautin and Allen 1997; Timm et al. 2008). Genetically, the two species appear
to have diverged between 1.9 and 5 million years ago (Litsios et al. 2012; Nelson et al. 2000;
Timm et al. 2008). In the aquarium trade, A. ocellaris is the most popular anemonefish with A.
percula the second most popular (Animal-World 2015). The two species are often mistaken for
one another and misidentified in the aquarium trade. They are also often reported as a species
complex (i.e., reported as A. ocellaris/percula) in trade documentation and scientific research
due to the difficulty in distinguishing between the two species. Even though their ranges do not
overlap, source countries often catch and/or culture one or both species, exporting both wild-
captured and captive bred individuals.
2.2.	
   Habitat	
  
Amphiprion percula is described as a habitat specialist due to its symbiotic association primarily
with three species of anemone: Heteractis crispa, H. magnifica, and Stichodactyla gigantea
(Fautin and Allen 1997; Elliott and Mariscal 1997a; Ollerton et al. 2007). The species has also
been reported as associating with S. mertensii (Elliott and Mariscal 2001) and S. haddoni (Planes
et al. 2009). As described in more detail below in the Geographic Range section, anemone
habitat for A. percula is spread throughout northern Queensland (Australia), the northern coast of
West Papua, northern Papua New Guinea (including New Britain), the Solomon Islands, and
Vanuatu (Rosenberg and Cruz 1988; Fautin and Allen 1997; De Brauwer 2014) (See Figure 2).
10	


Anemones and their symbiotic anemonefish inhabit coral reefs and nearby habitats such as
lagoons and seagrass beds. Although Fautin and Allen (1992, 1997) estimate that as many
anemone hosts and symbiotic fish live on sand flats or other substrate surrounding reefs as live
on the reef itself, the symbiotic pairs are thought of as reef dwellers because most diving and
observations occur on reefs. Both symbionts reside in shallow coastal waters primarily in depths
of 1-12 meters (m) (though the anemones can be found in depths up to 50 m) and water
temperatures ranging from 25-28 ºC (77-82 ºF) (Fautin and Allen 1997; Randall et al. 1997).
Two anemone species, including one A. percula host (H. crispa), and two species of symbiotic
anemonefish have been reported from mesophotic depths (>50m) in Australia (Bridge et al.
2012).
Although anemonefishes have been the subject of considerable scientific research, less is known
about the population dynamics or biology of the giant anemones that serve as their hosts.
(Anemones and giant anemones are used interchangeably here and in the literature; several
individual anemones may cluster together, forming what appears as a giant individual (Fautin
and Allen 1997).) There are over 1,000 anemone species but only 10 of them are known to be
associated with anemonefish. As described by Fautin and Allen (1992, 1997), giant anemones
have a lower end known as the pedal, which attaches firmly to a solid object like a coral branch
or rock. The opposite, unattached end is the mouth, or oral disc. Hollow tentacles emerge from
the oral disc and come in varying shapes, lengths, sizes, and colors. Microscopic, single-celled
algae known as zooxanthellae live within the tentacles and oral disc and provide energy to the
anemone through photosynthesis. Microscopic nematocysts, or stinging cells, are found on the
tentacles and internal structures and are used for defense and to capture prey (Fautin and Allen
1997). Acting like microscopic harpoons or needles, nematocysts mechanically sting prey.
Nematocyst toxins cause pain, loss of muscular coordination, paralysis, and tissue damage (Mebs
1994, 2009). Prey items include plankton, small fish, sea urchins, and crustaceans such as
shrimp and crabs. The mucous coating of giant anemones also contains cytolytic poisons, which
are lethal at dilute concentrations to most fish (Mebs 1994, 2009).
Relatively little is known about reproduction in giant anemones. Male and female H. crispa
anemones synchronously broadcast spawn sperm and eggs into the water column a few nights
each year (Scott and Harrison 2007a). After spawning, fertilized eggs become ciliated planula
larvae and become motile within 36 hours (Scott and Harrison 2007b). The larvae disperse for
4-12 days (Scott and Harrison 2007b, 2008) before settling in appropriate habitat. High
mortality is likely associated with this larval stage, as is common with broadcast spawning
species, although dispersal distances and mortality rates have not been examined for any giant
anemone species (Thornhill 2012). In addition to reproducing sexually, H. magnifica is also able
to reproduce asexually, whereby a polyp divides and becomes two polyps within the space of a
few days. Each of the two smaller individuals continues to grow before dividing again (Fautin
and Allen 1997). It is unknown which form of reproduction (i.e., sexual vs. asexual) is more
common.
Giant anemones are likely slow growing and very long lived, living decades to several centuries
(Fautin 1991; Fautin and Allen 1997). To be a viable host for anemonefish, an anemone must be
of a sufficient size to provide shelter and protection from predators. The long-term growth rate
and survival of anemones is correlated with the size and number of anemonefish they host, which
provide protection for the anemone from predators (Porat and Chadwick-Furman 2004) among
11	


the other benefits listed below. As for locomotion, anemones are typically settled at their
location, though if conditions are unfavorable, they are able to use their pedal disc to move a few
millimeters a day, or may detach entirely and roll or be carried a longer distance via water
currents (Fautin and Allen 1997).
The symbiosis between A. percula and its host anemones serves as an effective anti-predation
measure for both symbionts. Clownfish, including A. percula, are a unique group of fish that can
live unharmed among the stinging tentacles of anemones. A thick mucus layer cloaks the fish
from detection and response by anemone tentacles (Rosenberg and Cruz 1988; Elliott and
Mariscal 1997a, 1997b). Species that lack this physiological adaptation are immobilized by
stinging tentacles and consumed by the anemone. Thanks to this symbiotic association and
protection from their host anemones, adult A. percula have very few predators. Predators of both
anemones and anemonefish are deterred by the anemone’s stinging tentacles and by the presence
of territorial clownfish. In return, anemonefish swim through and create fresh water circulation
for the stationary anemone, allowing it to access more oxygenated water, speed up its
metabolism, and grow faster (Szczebak et al. 2013). Anemonefish also fertilize host anemones
with their ammonia-rich waste (Roopin and Chadwick 2009; Cleveland et al. 2011)), leading to
increases in anemone growth and asexual reproduction (Holbrook and Schmitt 2005).
At most geographic locations where anemonefish populations have been studied, all or most
anemones are occupied by anemonefish (Mariscal 1970; Allen 1972; Fautin 1985, 1992; Ochi
1986; Hattori 1995; Elliott and Mariscal 2001). Unoccupied anemones are typically either very
small or in shallow water (Elliott and Mariscal 2001) (~<1 m), presumably due to the potential
for lower salinity, increased temperatures, and exposure at low tides. Typically, only one species
of anemonefish occupies a single anemone at any given time due to niche differentiation; but this
is not always the case. Elliott and Mariscal (2001) studied anemone use by anemonefish in the
region of Madang, Papua New Guinea, which has the highest reported species diversity of both
anemonefish (9 species) and their host anemones (10 species). Of 72 anemones occupied by A.
percula, 4 also hosted other anemonefish species (Elliott and Mariscal 2001). As a
demonstration of further niche differentiation, both A. percula and A. perideraion occupied H.
magnifica anemones, but A. percula occupied the H. magnifica individuals in nearshore zones,
while A. perideraion occupied H. magnifica in offshore zones.
Amphiprion percula is a highly territorial species, likely due to intense competition for limited
resources, with niche differentiation caused by the distribution, abundance, and recruitment
patterns of competing species (Fautin and Allen 1997; Elliott and Mariscal 1997a, 2001; Randall
et al. 1997). Once anemonefish settle into a host, they are unlikely to migrate between anemones
(Mariscal 1970; Elliott et al. 1995).
2.3.	
  	
   Diet,	
  Feeding,	
  and	
  Growth	
  
Anemonefish are omnivorous and feed on a variety of prey items consisting of planktonic algae
and zooplankton, such as copepods and larval tunicates (Fautin and Allen 1997). Amphiprion
percula also feeds on prey remnants left over from its host anemone’s feeding activity and dead
tentacles from its host (Fautin and Allen 1997; Florida Museum of Natural History 2005).
An anemone will typically host a female and male breeding pair and up to four other
subordinate, non-breeding and non-related percula clownfish (Buston 2003a; Buston and Garcia
12	


2007; Buston et al. 2007). Individuals rarely stray beyond the periphery of their anemone’s
tentacles to feed (Buston 2003c). A size-based hierarchy develops within each group; the female
is the largest (rank 1), the male second largest (rank 2), and the non-breeding males get
progressively smaller as you descend the hierarchy (ranks 3-6) (Allen 1991). Subordinates tend
to be 80% of the size of their immediate dominant in the hierarchy (Buston 2003b; Buston and
Cant 2006). Subordinates likely regulate their growth to avoid coming into conflict with their
immediate dominant, and thereby avoid eviction from the social group (Buston 2003b; Buston
and Wong 2014). When a fish is removed from the hierarchical social group structure (due to
mortality or collection), all smaller members grow rapidly, filling in the size gap, to the point
that they are once again 80% the size of their immediate dominant (Fautin and Allen 1997;
Buston 2003b).
2.4.	
  	
   Reproduction	
  and	
  Development	
  
Spawning for A. percula can occur year round due to perpetually warm waters within the
species’ range (Fautin and Allen 1997). Spawning is also strongly correlated with the lunar
cycle, with most nesting occurring when the moon is full or nearly so (Fautin and Allen 1997).
Like all anemonefishes, all A. percula are born as males (Fautin and Allen 1997). Females
develop through protandrous hermaphroditism, or sex change from male to female. This occurs
when the female and largest member of the group dies (or is otherwise removed) and the next
largest male changes sex to become the dominant breeding female. The second largest male
subsequently becomes the dominant male (Rosenberg and Cruz 1988; Fautin and Allen 1997).
Only the dominant pair contributes to the reproductive output of a group within an anemone.
Non-breeders within the social group do not have an effect on the reproductive success of mating
pairs (Buston 2004; Buston and Elith 2011). Within a social group, the rate of development from
juvenile to adult and male to female is highly dependent on the mortality rates of individuals
within the group (Fautin and Allen 1997; Buston 2004b). In other words, the larger the group
size (up to six individuals), the longer an individual fish could remain as a sub-adult male (i.e.,
subordinate to the breeding female and male pair).
Courtship	
  
Adult male and female A. percula form strong monogamous pair-bonds. Initiation of ritualized
courtship is highly correlated with the lunar cycle (Fautin and Allen 1997) and typically
commences three to five days prior to spawning. Social interaction increases noticeably during
courtship and includes chasing and dorsal fin erection (Fautin and Allen 1997). During this time,
the female’s belly begins to swell with eggs (Animal-World 2015). Courtship also includes
preparation of the nest site, which is important for survival of the eggs. This is done by the
mating male through nipping at the host anemone’s tentacles in order to create a flat patch of
rock located under the anemone (Rosenberg and Cruz 1988; Myers 1999), and using his mouth
to clear any algae or debris (Fautin and Allen 1997; Buston and Elith 2011).
Spawning	
  
Once the female is ready to spawn, a conical whitish tube known as an ovipositor becomes
visible and eggs slowly descend from her belly onto the nest site. Once eggs are laid, the male
follows closely behind and fertilizes them externally. Spawning can last anywhere from 30
minutes to 2 hours (Fautin and Allen 1997; Dhaneesh et al. 2009). Clutch sizes vary widely
between 100 to over 1000 eggs (Fautin and Allen 1997; Dhaneesh et al. 2009), with the average
13	


being 324 eggs ± 153 (mean ± one standard deviation) recorded in Madang Lagoon, Papua New
Guinea (Buston and Elith 2011), depending on fish size and previous experience. Larger and
more experienced mating pairs will produce more eggs per clutch (Fautin and Allen 1997;
Buston and Elith 2011; Animal-World 2015), and can produce up to three clutches per lunar
cycle (Gordon and Hecht 2002; Buston and Elith 2011). Buston (2004) reports 12 years as the
typical expected tenure of breeding females in the field. While this is relatively long for a fish
species of this small size, it is not unheard of among reef fish species (e.g., 13 years for A. clarkii
(Moyer 1986); 18 years for A. frenatus and 18+ years for A. perideraion (Fautin and Allen
1997)). Reports of clownfish in captivity conclude that clownfish cease spawning several years
before the end of their life expectancy (Animal-World 2015), but it is unknown if this is also the
case in the wild.
Development	
  
After egg deposition has finished, a 6-8 day incubation period begins, with developmental rate
varying with temperature and oxygen content of the water (Dhaneesh et al. 2009). Eggs are
adhered to the nest surface via short filaments (Fautin and Allen 1997; Dhaneesh et al. 2009) and
are attended to by the male. The male aerates the nest with his mouth and fans the eggs with his
pectoral fins (Fautin and Allen 1997; Dhaneesh et al. 2011). The male also removes dead eggs
and debris from the nest, ensuring ample oxygenation. Though the overhanging tentacles of the
anemone provide some protection (Allen 1991; Arvedlund et al. 2000), the male fiercely guards
the eggs against potential predators (Rosenberg and Cruz 1988). The most common egg
predators during the day are Pseudochromis fuscus wrasses (family Labridae) and other
damselfishes (family Pomacentridae); nighttime predators are typically not fish, but invertebrates
such as brittle stars (families Ophiotrichidae, Ophiochimidae, and Ophiodermatidae) (Arvedlund
et al. 2000 citing D.R. Bellwood, pers. comm.). During this period of male parental care, the
female is occupied with feeding activity (Fautin and Allen 1997).
As eggs continue to incubate over the course of a week, embryos become visible through a
transparent membrane. Silvery pupils contained within large eyes and red-orange yolk sacs are
two noticeable features during development (Buston and Elith 2011). Average hatch success
recorded in Madang Lagoon, Papua New Guinea, is estimated at 87% (Buston and Elith 2011).
Upon hatching, which typically occurs in the evening, larvae are 3-4 mm in length (Fautin and
Allen 1997; Gordon and Hecht 2002; Dhaneesh et al. 2009). They initially sink to the benthic
environment before swimming to the upper surface of the water column using a process called
phototaxis where moonlight helps to orient them (Fautin and Allen 1997). Larvae then enter a
pelagic phase and are likely engaged in active swimming and orientation, and also transported by
ocean currents (Fautin and Allen 1997; Leis et al. 2011).
2.5.	
   Settlement	
  and	
  Recruitment	
  
The larval stage of A. percula ends when the larval anemonefish settles into a host anemone
approximately 8-12 days after hatching (Fautin and Allen 1997; Almany et al. 2007; Buston et
al. 2007). Compared to many other coral reef species, this is considered a short pelagic larval
duration, though is typical of genera restricted to the Indo-Pacific (Wellington and Victor 1989;
Almany et al. 2007). The likelihood of successful recruitment depends on anemone saturation
and habitat type (Buston 2003c; Dixson et al. 2008; Elliott and Mariscal 2001). Buston (2003c)
showed that removal of non-breeders resulted in recruitment of new individuals within a few
months. Under natural conditions, populations are close to carrying capacity and resident A.
14	


percula prevent recruitment of new individuals; when residents are removed, new individuals
recruit. Like most reef fish species, the egg, pelagic larval, and settlement life stages for A.
percula experience the highest rates of natural mortality (there may be only one successful
recruit for every 10,000 eggs produced – Peter Buston pers. obs.). Once they gain the protection
of an anemone, mortality is greatly reduced.
Anemonefishes search for and settle into a suitable host anemone using a variety of cues.
Dixson et al. (2008, 2014) and Munday et al. (2009a) found that A. percula are attracted to
olfactory cues such as leaf litter and tropical trees, a means of locating island reef habitats, when
searching for a settlement site. Amphiprion percula are also attracted to unrelated conspecific
adults (Munday et al. 2009a). Embryos and newly hatched juveniles may learn cues from the
host anemone where they hatched and respond to imprinted cues when searching for suitable
settlement locations (Fautin and Allen 1997; Arvedlund et al. 2000; Paris et al. 2013; Dixson et
al. 2014; Miyagawa-Kohshima 2014). Innate recognition is also used and refers to the ability of
anemonefish to locate a suitable host without prior experience (Fautin and Allen 1997;
Miyagawa-Kohshima 2014). Studies indicate that imprinting on anemone olfactory cues
complements innate recognition, leading to rigid species-specific host recognition (Miyagawa-
Kohshima 2014).
Fish acclimation to a host anemone lasts anywhere from a few minutes to a few hours (Fautin
and Allen 1997; Arvedlund et al. 2000) and is accomplished by briefly touching the tips of the
tentacles with pectoral fins. At first there is an adhesive effect and the fish typically flees the
anemone but then continually returns, making progressively more contact until tenticular
clinging no longer occurs due to a protective mucus coating that develops on the anemonefish
(Davenport and Norris 1958; Elliott and Mariscal 1997a). Once acclimated, the mucus
protection may disappear upon extended separation between host and fish. Continued contact
with tentacles appears to reactivate the mucus coat (Arvedlund et al. 2000). Coloration of
anemonefish usually also begins during this anemone acclimation process (Elliott and Mariscal
2001). Upon settlement, the entire metamorphosis from larva to juvenile takes about a day
(Fautin and Allen 1997).
2.6.	
  	
   Longevity	
  and	
  Resilience	
  
Fautin and Allen (1992, 1997) reported that some anemonefish are recorded to have lived at least
6-10 years in nature, with 18 years the record in captivity. More recently, Buston and Garcia
(2007) studied a wild population of A. percula in Papua New Guinea and their results suggest
that females can live up to 30 years in the wild (lower 95% CI = 22.0 years, upper 95% CI = 89.9
years), although this life expectancy estimate has not been empirically proven through otolith
examination. This estimate is notably two times greater than the longevity estimated for any
other coral reef damselfish and six times greater than the longevity expected for a fish that size
(Buston and Garcia 2007). Their results are consistent with the idea that organisms subject to
low levels of extrinsic mortality, like anemonefish, experience delayed senescence and increased
longevity (Buston and Garcia 2007). For individuals that move up in social rank to eventually
attain the female position, remaining life span or time spent as a female does not vary with group
size. The amount of time spent queuing to attain the female position, however, does vary with
group size, which leads to the variable overall life expectancy of a female based on group size
(Buston and Garcia 2007).
15	


As noted above, post-recruitment mortality associated with predation is quite low, ranging from
2% (Elliott and Mariscal 2001) to ~7% for ranks 1-3 and ~30% for ranks 4-6 (Buston 2003a),
especially compared to other coral reef fish. This is likely attributable to the amount of
protection provided by host anemones (Buston 2003a). Social rank appears to be the only factor
associated with mortality of the species post-settlement rather than factors such as number of
individuals, density, standard length, anemone diameter, depth, or reef size (Buston 2003a,
2003b). Competition for rank amongst individuals within an anemone can lead to eviction of
subordinates. Buston (2003a) speculated that individuals probably compete for rank because it
confers access to reproduction, and not because it confers access to food or shelter.
Using a methodology designed to determine resilience to fishing impacts, Fishbase.org rates A.
percula as highly resilient, with an estimated minimum population doubling time of less than 15
months (Florida Museum of Natural History 2005; Fishbase.org 2015). Another analysis, using
the Cheung et al. (2005) “fuzzy logic” method for estimating fish vulnerability to fishing
pressure, assigned A. percula a low vulnerability score, with a level of 23 out of 100
(Fishbase.org 2015). Fujita et al. (2014) analyzed data deficient marine aquarium trade species,
although they did not include A. percula. Using a recently developed semi-quantitative
methodology known as the productivity susceptibility analysis (Patrick et al. 2010), A. ocellaris
and A. clarkii were assessed and both were rated as highly vulnerable due to their low
productivity and high susceptibility to capture for the aquarium fishery. While this is
informative, it is difficult to determine if these results are indicative of the status of A. percula as
well due to several important differences including the species’ range and levels of exploitation
in countries where they occur. While all of these analyses are specific to the threat of fishing
pressure (which is not the only threat facing A. percula), they assess the life history
characteristics of the species (or similar species) and determine how those characteristics may
affect its response to population reduction, which is informative in the case of sources of
mortality besides fishing pressure. As such, we consider the species-specific results to be
reliable indicators of the species’ resilience overall.
2.7.	
  	
   Geographic	
  Range	
  
Clownfish first appeared and diversified in the Indo-Australian Archipelago (Litsios et al. 2014).
The orange clownfish is native to the Indo-Pacific region (Rosenberg and Cruz 1988), from 6º S
- 26º S, 141º E - 155º E. Range countries include northern Queensland (Australia), the northern
coast of West Papua, northern Papua New Guinea (including New Britain), the Solomon Islands,
and Vanuatu (Rosenberg and Cruz 1988; Fautin and Allen 1997; De Brauwer 2014) (see Figure
2). There are reports of A. percula occurring beyond these areas, including in the Andaman and
Nicobar Islands off southeast India (Madhu and Madhu 2006); Tomini Bay in Sulawesi,
Indonesia (Kuiter and Tonozuka 2004, cited by Timm et al. 2008); Cocos (Keeling) Islands and
Christmas Island in the eastern Indian Ocean; Fiji; Micronesia; and as far north as the Ryukyu
Islands in the East China Sea (Thornhill 2012). However, these reports are most likely cases of
misidentification of A. ocellaris (Maarten De Brauwer, pers. comm. 2015), or indicative of a
potential third, cryptic species in the species complex that has yet to be described.
Phylogenetic analysis from Timm et al. (2008) shows that specimens from Tomini Bay
(Sulawesi, Indonesia) belong to the A. percula clade, but were genetically distinct from A.
percula sampled within the known range of the species at the sub-clade level. These results
16	


suggest the possibility of a third, cryptic species present within the A. ocellaris/percula species
complex, which is not concordant to the current taxonomy. More genetic analyses are required
to determine whether the range of A. percula is more extensive than what has been described
previously or if a third cryptic species does exist. The existence of a third species would not
affect our analyses here as we have not considered the geographic area where this third species
might exist to be part of the range of A. percula. If further genetic research indicates there is no
third species and the range of A. percula extends beyond what we have analyzed here, we could
consider our conclusions to be conservative underestimates of range size and abundance. For the
purposes of this analysis, we did not speculate as to which scenario is more likely; rather, we
used the best available scientific and commercial information to determine the species’ current
range.
Figure 2: Range map for A. percula based on Fishbase.org, Timm et al. 2008, and De Brauwer 2014, also showing
coral reef areas from Burke et al. 2011.
Overall, the area of coral reef habitat within the range of A. percula, based on satellite imagery
and classification, is estimated between 36,000 km2
and 50,000 km2
(Burke et al. 2011; De
Brauwer 2014 citing Fautin and Allen 1992 and Spalding et al. 2001). We are unable to provide
an estimate of the non-coral reef habitat within the species’ range including sandy patches
between patch reefs, parts of lagoons, and seagrass beds. As such, the likely area where A.
percula occurs is actually much greater and thus the estimated area is likely an underestimate.
2.8.	
   Distribution	
  and	
  Connectivity	
  
Distribution	
  within	
  Reef	
  Habitats	
  
The distribution of suitable host anemone species essentially dictates the distribution of A.
percula within its habitat (Elliott and Mariscal 2001). Although competition with other
anemonefish species may lead to finer-scale niche differentiation as previously described.
17	


Heteractis crispa, H. magnifica, and S. gigantea range throughout and beyond A. percula’s
geographic extent. Stichodactyla haddoni occurs in Australia and Papua New Guinea, but has
not yet officially been recorded in Vanuatu or the Solomon Islands, and S. mertensii officially
has been recorded only from Australia within A. percula’s range (Fautin and Allen 1997; Fautin
2013). However, two recent observations extended the known distribution of S. haddoni, both
northward and southward, indicating they have the ability to expand in range and facilitate the
expanded occurrence of commensal species (Hobbs et al. 2014; Scott et al. 2014). Anecdotally,
there are photo images and video footage of S. haddoni and S. mertensii in the Solomon Islands,
Vanuatu, and Papua New Guinea (e.g., Shutterstock (Vanuatu, Solomon Islands), National
Geographic (Solomon Islands), and Getty Images (Papua New Guinea)). Species experts,
however, have not officially confirmed these reports.
Although geographically widespread, anemone species differ in their preferred habitat (e.g., reef
zonation, substrate, depth (Fautin 1981)). Hattori (2006) found that H. crispa individuals were
larger along reef edges and smaller in shallow inner reef flats. The larger anemones on reef
edges experienced higher growth, probably because deeper (up to 4 m) reef edges provide more
prey and lower levels of physiological stress. The author speculates that habitat and depth ideal
for high anemone growth will vary by study site and occur at depths where there is a balance
between available sunlight to allow for photosynthesis and low physiological stress, both of
which are dependent on site-specific environmental conditions. Elliott and Mariscal (2001)
found that coexistence of multiple clownfish species in close proximity is possible because of
differences in their host anemone preference and differences in their habitat utilization. For
example, in Madang, Papua New Guinea, both A. percula and A. perideraion primarily occupied
H. magnifica hosts, but A. percula dominated H. magnifica in the nearshore zone while A.
perideraion dominated in the offshore zone.
It is difficult to generalize the likely distribution, abundance, and trends of anemone hosts
throughout the range of A. percula; these parameters are likely highly variable across the
species’ range. In an assessment done throughout the Great Barrier Reef, anemones, including
those that host A. percula, were quantified as “common” (Roelofs and Silcock 2008). On the
other hand, Jones et al. (2008) and De Brauwer et al. (in prep) note that anemones occur in
relatively low densities throughout their range. Based on the available information, it is difficult
to generalize the likely distribution of anemones, and therefore A. percula in coral reef
environments throughout its range; it is likely to be variable and dependent on local
environmental conditions. At least one study indicates that A. percula may prefer nearshore or
shallower habitats (Elliott and Mariscal 2001).
Dispersal	
  and	
  Connectivity	
  
Because orange clownfish are unable to migrate from one coral reef to another during their adult
life stage, dispersal between reefs is limited to the species’ approximately 8-12 day pelagic larval
stage. There is support that simply having a pelagic larval phase can lead to some degree of
long-range dispersal for species (Saenz-Agudelo et al. 2012; Treml et al. 2012). Pelagic larval
duration is likely to be a strong predictor of dispersal distances (Shanks et al. 2003), although no
direct evidence exists where both dispersal distance and pelagic larval duration have been
measured. On the other hand, in a review of research on connectivity on coral reefs, Jones et al.
(2009) conclude that variation in self-recruitment estimates within fish and coral species is more
likely influenced by geographic isolation and spacing of reefs than pelagic larval duration, a
18	


conclusion supported by Pinsky et al. (2012). Williams and Hastings (2013) highlight the
significance of temporally variable fluid dynamic processes leading to stochastic dispersal events
for marine organisms.
Despite evidence correlating pelagic larval duration with dispersal distance, it has typically been
a poor predictor of genetic similarity (Bay et al. 2006; Bowen et al. 2006; Weersing and Toonen
2009) and genetic population structure (Bay et al. 2006; Bowen et al. 2006; Luiz et al. 2012).
Because small pelagic larvae are extremely difficult to track in the open ocean, population
genetics is a useful technique to evaluate gene flow and connectivity between populations of
coral reef associated organisms. Measuring self-recruitment rates in particular helps us to
understand small scale connectivity in meta-populations of reef fish like A. percula. Using larval
tagging, Almany et al. (2007) estimated that 60% of larvae they tagged around Kimbe Island,
Papua New Guinea were spawned at Kimbe Island (self-recruiters) and the remaining 40% of
tagged larvae were from reefs outside the study area, the closest of which is 10 km away. Using
genetic parentage analysis, Planes et al. (2009) documented 42% self-recruitment for A. percula
at Kimbe Island and found that the Kimbe Island population produced larvae that successfully
dispersed to other populations 15-35 km away, revealing significant demographic connectivity.
Based on these data (Planes et al. 2009), Buston et al. (2012) found the probability of successful
dispersal between populations decreasing fivefold over 1 km of distance from a natal site. In yet
another study, a total of 110 juvenile orange clownfish collected on Kimbe Island were screened,
again using genetic parentage analysis; 46 were assigned to parents on Kimbe Island (“self-
recruiters”) and the remaining 64 were classified as “immigrants” that arrived from another reef
at least 10 km away (Berumen et al. 2010). Overall, while A. percula dispersal between reef
groups in Kimbe Bay appears variable over time (Berumen et al. 2012), the above studies’
findings consistently indicate that self-recruitment around Kimbe Island ranges from 42-60%,
and there exists significant connectivity at the scale of 10s of km for A. percula. Anemonefish
larvae possess significant locomotory and sensory abilities that may help them avoid dispersal
away from the sensory halo of Kimbe Island (Fisher et al. 2000; Dixson et al. 2008); however,
other factors, presumably including local current patterns, must also influence larval dispersal, to
some degree (Berumen et al. 2012). While A. percula populations in Kimbe Bay have been well
studied, it is unclear how representative these results may be of other areas within the species’
range. In addition to the density of A. percula likely being highest in Kimbe Bay and nearby
areas, aspects of the geographical setting that influence dispersal will also vary among sites
across the species’ range, leading to variable levels of self-recruitment.
Research on congeners of A. percula has revealed similar variability in levels of self-recruitment
at different locations. For example, along 28 km of coastline near Port Moresby, Papua New
Guinea, study results showed highly variable levels of self-recruitment of A. polymnus among
sites, but overall low observed self-recruitment rates, a high proportion of connectivity among
sites, and a relatively high proportion of long-distance dispersal. This led to the conclusion that
connectivity, not self-recruitment, dominates larval replenishment in this focal clownfish meta-
population (Saenz-Agudelo et al. 2011). The authors noted that differences in self-recruitment
rates among sites within the meta-population were likely linked to different localized
geographies that affect access and proximity to alongshore current flows (Saenz-Agudelo et al.
2011). In contrast, Jones et al. (2005) found high levels of self-recruitment for A. polymnus at
sites within Kimbe Bay, which supports the notion that the level of self-recruitment in a meta-
population likely depends on the level of geographic isolation. Another congener, A. melanopus,
19	


was included in a list of species studied on the Great Barrier Reef and found to have generally
high genetic diversity that did not differ significantly among species and locations (Bay et al.
2006). Additionally, genetic parentage analysis of A. bicintus in the Red Sea found minimal to
no self-recruitment in two consecutive years, indicating a virtually open population over several
kilometers (Nanninga 2013). Moreover, van der Meer et al. (2012) report 68-84% self-
recruitment at three island marine protected areas in Australia for the endemic A. mccullochi,
while self-recruitment for A. ocellaris and A. perideraion ranged from 44-65% among sites and
sampling periods in the Spermonde Archipelago, Indonesia (Madduppa et al. 2014). The
variability in self-recruitment rates among these species and populations is likely to be driven by
the variable nature of the geographical settings of the different study locations. In well-
connected populations, self-recruits are diffused by immigrants; the opposite is true for
geographically isolated populations that tend to show higher rates of self-recruitment.
On a larger geographic scale, Treml et al. (2012), hypothesize that broad-scale connectivity is
strongly influenced by reproductive output and length of pelagic larval duration based on a
biophysical model of larval dispersal. However, there are limitations to this approach when
considering species that actively swim during their pelagic larval phase, like some anemonefish,
rather than passively disperse. This is evidenced by the fact that, for several clownfish species,
there have been conflicting results regarding whether regional ocean currents are a good
predictor of phylogeographic structure and, therefore, whether such passive dispersal modeling
based on ocean currents is informative. For example, Nelson et al. (2000) mapped the
phylogeography of A. ocellaris across its range and found that surface ocean currents in the
region, which should influence larval dispersal, were poorly correlated with phylogeographic
structure. Instead, A. ocellaris phylogeography is more reminiscent of Pleistocene sea level
changes and flooding of the Sunda shelf. Omani clownfish populations on the other hand,
separated by over 400 km, were found to be connected in both directions using genetic
assignment tests; this long-distance dispersal matched predictions from a dispersal model based
on oceanographic currents, demonstrating that simple physically forced models can give valuable
predictions for realized patterns of connectivity in some cases (Simpson et al. 2014).
In the absence of a broad-scale phylogeographic study for A. percula, we are left with small-
scale meta-population connectivity studies as the best available information. Results from
studies in Kimbe Bay, Papua New Guinea, indicate that A. percula have the ability to disperse at
least up to 35 km away from natal areas (Planes et al. 2009). In addition, there is evidence that
rates of self-recruitment are likely to be linked with not only pelagic larval duration, but also
geographical isolation (Jones et al. 2009; Pinsky et al. 2012). Because of the size and
distribution of A. percula’s range, there are likely areas of higher and lower connectivity
throughout, linked with the variability in geographic isolation across locations, creating
significant spatial structure. This is, however, speculative because no large-scale connectivity
study has been conducted for this species.
Based on the best available information, we consider that the species is likely to have highly
variable small scale connectivity among and between meta-populations, but unknown large scale
genetic structure across its entire range.
20	


2.9.	
  	
   Estimated	
  Abundance	
  
Based on the best available information, densities of meta-populations of A. percula are highly
variable throughout the species’ range. Densities are highest in the northern region of Papua
New Guinea, which has the greatest reported species diversity and densities of both
anemonefishes and anemones (Elliott and Mariscal 2001). In Madang, Papua New Guinea,
Elliott and Mariscal (2001) estimated the total density of A. percula at approximately 0.79 fish
per 100 m2
, or approximately 7,900 individuals per km2
of reef area. In Kimbe Bay, Papua New
Guinea, Planes et al. (2009) counted 975 individuals (506 adults and 469 juveniles) in 270
anemones in a 1 km2
area of reef. Density of A. percula is lower at survey locations in the
Solomon Islands and Australia than Papua New Guinea sites (Maarten De Brauwer, pers. comm.
2015). De Brauwer (2014) determined an average density for the species within its range from
658 surveys across 205 sites throughout the species’ range. He calculated the global estimated
mean density at 0.09 fish per 250 m2
, or 360 fish per km2
.
With no existing estimate of global abundance for A. percula, we estimated, based on the best
available information a total of 13-18 million individuals for the species throughout its range.
Acknowledging that density estimates for A. percula are highly variable throughout the species’
range, we used De Brauwer’s (2014) estimated average density of 360 fish per km2
to derive
global abundance. In order to extrapolate this average density to estimate abundance, we used
two different estimates of coral reef area within the species’ range. De Brauwer (2014)
estimated 36,000 km2
of coral reef area within the species’ range based on Fautin and Allen
(1992, 1997) and Spalding et al. (2001). We also used newer coral reef mapping data from
Burke et al. (2011; ArcGIS shapefiles of coral reef area provided by K. Reytar) resulting in an
estimate of approximately 50,000 km2
of coral reef area within A. percula’s range. We used both
values to determine a range of estimated abundance (13-18 million) to reflect uncertainty. It is
important to note that this may be an underestimate because it is based on coral reef area, which
likely does not account for most of the non-reef area where the species occurs throughout its
range. We found no information on historic abundance or recent population trends for A.
percula throughout all or part of its range.
3.0.	
  	
   ASSESSMENT	
  OF	
  EXTINCTION	
  RISK	
  
3.1.	
  	
   Approach	
  to	
  Evaluating	
  Extinction	
  Risk	
  
In evaluating extinction risk to the species, we identified the four demographic risk factors
suggested by Wainwright and Kope (1999) and McElhany et al. (2000), as well as the threat
factors identified in section 4 of the ESA. The four demographic viability risk criteria,
considered at the species level include: abundance, growth rate/productivity, spatial
structure/connectivity, and diversity. These viability criteria reflect concepts that are well
founded in conservation biology and that individually and collectively provide strong indicators
of extinction risk. The approach of considering demographic risk factors to help frame the
consideration of extinction risk has been used in many status reviews including Pacific
salmonids, Pacific hake, walleye pollock, Pacific cod, Puget Sound rockfishes, Pacific herring,
scalloped hammerhead sharks and black abalone (see http://www.nmfs.noaa.gov/pr/species/ for
links to these reviews). In addition to these factors, we considered the five threat factors listed in
section 4(a)(1) of the ESA. Based on all of this information, we describe the likely level of
21	


extinction risk faced by the orange clownfish both now and in the foreseeable future (defined
below).
Because information on the orange clownfish is sparse and often non-quantitative, we used
qualitative risk categories to characterize the likelihoods of the four demographic viability
criteria significantly contributing to extinction risk: very low, low, medium, high or unknown. In
addition, because some threats to the orange clownfish are either poorly understood or
unquantifiable, we characterized the relative likelihood (as very low, low, medium, high, or
unknown) that threats (confirmed, potential or assumed) are significantly contributing to
extinction risk for A. percula. We do not make recommendations as to whether the species
should be listed as threatened or endangered. Rather, conclusions are drawn about the overall
risk of extinction faced by the species under present conditions and in the foreseeable future
based on an evaluation of the species’ demographic risks and threats.
Although the orange clownfish is not officially listed under the IUCN Red List of Threatened
Species, De Brauwer (2014) assessed extinction risk for all anemonefish species using the IUCN
Red List criteria. De Brauwer used multiple methods to calculate values for each criterion (18
methods in total to calculate different values for the 4 criteria) and A. percula was most
commonly assigned to the “Least Concern” category. The Least Concern category is used to
highlight species that have a relatively low extinction risk compared with those taxa that are
assessed as Near Threatened, Threatened, Endangered or Critically Endangered. For De
Brauwer (2014), the only scenario where A. percula was conservatively assigned to a higher
IUCN risk category (“Endangered”) resulted from one of the methods he used to calculate the
area of occupancy. Using this most conservative method to determine area of occupancy to
assess risk of extinction for all anemonefish, 20 species could potentially be classified as
Endangered and 8 species as Critically Endangered (De Brauwer 2014). Although IUCN Red
List criteria differ from how we assess species under the ESA, it is a useful exercise to inform
our analysis of A. percula’s risk of extinction. Risk classifications by other organizations, or
made under other Federal or state statutes, may be informative, but the classification alone may
not provide the rationale for evaluating species status under the ESA. Rather, we evaluate the
sources of information on which the classification is based and determine how this information
informs our assessment of extinction risk and whether a species meets the definition of
threatened or endangered under the ESA.
According to the ESA, the determination of whether a species is threatened or endangered should
be made on the basis of the best scientific information available regarding its current status, after
taking into account efforts being made to protect the species. During the extinction risk
assessment, likely or possible effects of conservation measures are taken into account to the
extent they are reflected in metrics of population or species viability. Conservation measures
that have not yet been implemented or shown to be effective are taken into account in a separate
process by NMFS prior to proposing any listing determinations. In the last part of this section,
we summarize the conservation efforts that are currently in place that may be benefiting the
orange clownfish so that NMFS can consider them before making a listing determination.
	
  
22	


3.1.1.	
   	
  Foreseeable	
  Future	
  
The term “foreseeable future” is not defined in the ESA. The NMFS guidance for conducting
status reviews under the ESA instructs us to interpret this phrase as the timeframe over which
predictions about the future conservation status of the species can be reasonably relied upon
(NMFS 2013). Those predictions can be in the form of extrapolation of population or threat
trends, analysis of how threats will affect the status of the species, or assessment of future events
that will have a significant new impact on the species. We consider the life history of the
species, habitat characteristics, availability of data, kinds of threats, ability to predict threats, and
the reliability of models used to forecast threats over that “foreseeable future” in determining the
time period that constitutes the foreseeable future. This approach does not limit the time frame
under consideration to the length of time into the future for which a species’ status can be
quantitatively modeled or predicted within predetermined limits of statistical confidence,
although uncertainties of any modeling efforts should be documented. Because a species may be
susceptible to a variety of threats for which different data are available or which operate across
different time scales, the foreseeable future is not necessarily reducible to a particular number of
years.	
  	
  Thus, we may describe the foreseeable future in general or qualitative terms.
In our consideration of the foreseeable future for this status review, we evaluated how far into
the future we could reliably predict the operation of the major threats to this species, as well as
the species’ response to those threats. We are reasonably confident in our ability to predict out
several decades in assessing all threats listed below and their interaction with the life history of
the orange clownfish. We considered generation length to reflect turnover of breeding
individuals and account for non-breeding older individuals. Estimates for generation length,
which is greater than first age of breeding but lower than the oldest breeding individual (IUCN
2015), of the orange clownfish range between 6 and 15 years. Therefore, we conservatively
define the foreseeable future as 30 years from the present, which is based on 2-3 generation
lengths as well as the estimated lifespan of the orange clownfish. We note that, while we may
have information with which to predict the trajectory of a particular threat into the future for a
defined amount of time (e.g., climate projections out to the year 2100), we may lack information
on the species’ response to that threat over the same time period, and therefore do not extend the
foreseeable future as far as we can predict the trajectory of such a threat.
3.2.	
  	
   Demographic	
  Risks	
  
Summarized below are various demographic risks to the viability of A. percula. As mentioned
previously, we conducted a qualitative assessment of the overall status of the species using four
demographic viability risk criteria: abundance, population growth rate/productivity, spatial
structure/connectivity, and diversity. The relative likelihood that each particular demographic
factor contributes, or will contribute in the foreseeable future as defined above, in a significant
way to extinction risk of the species is summarized at the end of this section (Table 1) according
to the following scale:
(1) Very low – it is very unlikely that the particular factor contributes or will contribute
significantly to risk of extinction;
(2) Low – it is unlikely that the particular factor contributes or will contribute
significantly to risk of extinction;
23	


(3) Medium – it is likely the particular factor contributes or will contribute significantly
to risk of extinction; and,
(4) High – it is highly likely that the particular factor contributes or will contribute
significantly to risk of extinction.
(5) Unknown – it is unknown how the particular factor contributes or will contribute to
risk of extinction.
(Note: The term “significantly” is used here as it is generally defined – i.e., in a
sufficiently great or important way as to be worthy of attention.)
If there was some uncertainty between two of the qualitative categories for any particular
demographic factor, and/or uncertainty in the available information for that factor, we
conservatively assigned it to the higher level of likelihood out of the two.
3.2.1.	
   Abundance	
  
In general, very low levels of a species’ abundance and density may cause difficulty in mate
choice; sex-ratios; fertilization and recruitment success; reproductive or courting behaviors;
foraging success; and predator avoidance behaviors.	
  	
  There are no global historical or current
abundance estimates for A. percula in the literature. However, we estimate global, wild
population abundance for A. percula to be approximately 13-18 million individuals based on De
Brauwer (2014) and estimates of total habitat area. We believe this estimate to be a conservative
estimate for reasons discussed in section 2.9 above. 	
  
Based on our estimate of global abundance and information gleaned from the literature on the
reproductive strategy of the species, we determined that the species’ abundance is not so low that
it is at risk of extinction due to environmental variation, anthropogenic perturbations or
demographic stochasticity. Amphiprion percula’s reproductive strategy is not dependent on
finding a mate or affected by sex ratios, so depensatory processes are not of great concern. An
abundance of 13-18 million individuals is sufficiently high to provide genetic diversity, which is
supported by results from several studies of connectivity for the species (Almany et al. 2007;
Planes et al. 2009; Berumen et al. 2012; Buston et al. 2012). We found no evidence that the
species is not fulfilling its ecological role due to low abundance in any part of its range. While
we acknowledge that there is uncertainty associated with our estimate of population abundance,
it was determined based on the best available information (De Brauwer 2014) and is deemed
conservative as it does not encompass areas such as seagrass beds known to harbor significant
numbers of anemones with anemonefish, especially in Papua New Guinea (Colette Wabnitz,
pers. comm. 2015). Overall, the best available information indicates that the estimated current
global, wild abundance of A. percula is unlikely to be contributing to the extinction risk of the
species.
3.2.2.	
   Population	
  Growth	
  Rate	
  /	
  Productivity	
  
Amphiprion percula are estimated to have a minimum population doubling time of less than 15
months (Florida Museum of Natural History 2005; Fishbase.org 2015), and low vulnerability to
fishing based on biological and life history parameters (Cheung et al. 2005; Fishbase.org 2015).
Natural mortality for juveniles and adults is low, ranging from 2% (Elliott and Mariscal 2001) to
~7% for ranks 1-3 and ~30% for ranks 4-6 (Buston 2003a). The species is also highly
productive and can spawn monthly, with an individual laying from 100 to over 1000 eggs during
each spawning session, depending on fish size and previous experience (Fautin and Allen 1997).
24	


There are currently no data that provide an estimate of how long orange clownfish spawn during
their life span.
We do not know the recent or historical trend of the global population of orange clownfish and
therefore cannot estimate an overall population growth rate or decline. However, their high
fecundity in combination with low juvenile and adult mortality and estimated minimum
population doubling time of 15 months all indicate that populations are likely to be resilient to
periodic disturbances. It is important to note that the suitable number of host anemones, not
availability of new anemonefish recruits, is what limits anemonefish populations (Fautin and
Allen 1997). This notion is supported by the observation in Madang Lagoon, Papua New Guinea
in 1997 that when non-breeders were removed they were rapidly replaced (Buston 2003c),
indicating that the population was basically at carrying capacity. We recognize that, based on
this limitation, the population growth rate and status of A. percula is very closely linked to the
population status of its host anemone species. However, because data on anemones are virtually
non-existent, it is difficult to generalize the likely distribution, abundance, and trends of A.
percula’s anemone hosts, as described above in section 2.8. We use the best available
information to assess threats to host anemones below in section 3.3.1. Based on the conclusion
below in section 3.3.1 in combination with the best available information presented here, we
determined that population growth rate/productivity of A. percula is unlikely contributing to
extinction risk for the species.
	
  
3.2.3.	
   Spatial	
  Structure	
  /	
  Connectivity	
  
We can consider spatial structure for A. percula on different scales and have variable amounts of
evidence to inform each level of assessment. As described above, multiple DNA parentage
analyses have been conducted in and around Kimbe Bay, Papua New Guinea, that offer some
insight into meta-population connectivity for this species in those locations. Self-recruitment
rates range from 40% to over 60% (Almany et al. 2007; Planes et al. 2009; Buston et al. 2012).
In one study, up to 10% of A. percula larvae were long distance migrants that successfully
recruited to reefs up to 35 km away (Planes et al. 2009). This was originally the longest direct
measure of larval dispersal distance for any marine fish species reported using the genetic
parentage methodology until Simpson et al. (2014) reported Omani clownfish (A. omanensis)
migrating over 400 km from their natal origins. It also demonstrates significant demographic
connectivity within Kimbe Bay. These results are also consistent with more general biophysical
modeling for the tropical western Pacific region, which suggests high levels of connectivity in
regions where reefs are only 20-30 km apart, including for species with a wide range of pelagic
larval durations (Treml et al. 2008). Connectivity information for congeners that inhabit the
same areas and habitat types support the variability reported in self-recruitment and high
connectivity of meta-populations (Bay et al. 2006; Saenz-Agudelo et al. 2011; van der Meer et
al. 2012; Nanninga 2013; Madduppa et al. 2014; and Saenz-Agudelo et al. 2015). As reported
earlier, connectivity and self-recruitment rates for meta-populations are likely based on local
geographic settings (Jones et al. 2009) and environmental conditions, which explains the
variability between study sites in different locations.
On a broader geographic scale, Timm et al. (2008) report that the close relatedness of genetic
samples of A. percula from sites in New Britain (Papua New Guinea) and the Solomon Islands
could indicate connectivity in a southeast direction, at least historically. However, it remains
unclear how closely related individuals from various parts of the species’ range are on a broad
25	


scale currently; there may be some dispersal barriers within the range of A. percula of variable
strength (Treml et al. 2015). We have insufficient genetic information to identify whether
critical source populations exist; this epistemic uncertainty can only be reduced through further
research.
Amphiprion percula’s spatial structure appears to consist of a series of meta-populations
throughout the species’ range that have variable rates of both internal and external connectivity
likely linked to varying degrees of geographic isolation. The best available information indicates
that at a local scale, A. percula meta-populations experience variable levels of self-recruitment
related to geographic isolation but can disperse up to 35 km away from their origins. Globally,
however, there is no information available on the overall spatial and genetic structure for the
species. Therefore, we conclude that the level to which spatial structure and connectivity is
likely to be a factor contributing to extinction risk for A. percula is unknown.
3.2.4.	
   Diversity	
  
The loss of diversity can reduce a species’ reproductive fitness, fecundity, and survival, thereby
contributing to declines in abundance and population growth rate and increasing extinction risk
(e.g., Gilpin and Soulé 1986). There is some uncertainty, however, as to whether the loss of
diversity by itself confers risk of extinction (see Brook et al. 2002). Although the loss of
diversity certainly increases extinction risk through its compounding effects on other
demographic factors, it is argued by some that the loss of diversity by itself plays a relatively
minor role in extinctions. The loss of diversity can help bring species to a high risk status, but
other demographic or environmental factors usually play the direct role in causing extinctions
(Lande 1988; Caro and Laurenson 1994; Caughley 1994; Dobson 1999).
For A. percula, we found no evidence that genetic diversity is a factor limiting the success of the
species and contributing to extinction risk. Meta-populations of this species exhibit variable
levels of connectivity that appear sufficient to maintain genetic diversity. Heterogeneity of
habitats across the species’ range also likely leads to behavioral or physiological adaptations to
local environmental conditions, thereby increasing diversity. Examples may be preference for
one anemone species over another, preference for anemones that are nearshore versus offshore,
or other local behavioral and/or physiological adaptations. In addition, a mixture of genetic and
environmental factors usually causes phenotypic diversity; clownfish species often exhibit
geographical color morphs or other phenotypic diversity (Moyer 1976). Militz (2015) reports a
broad diversity in color forms for A. percula in Kavieng, New Ireland, Papua New Guinea
including variation in the width of the black border along its white bars (also observed by Timm
et al. 2008) or “mis-barred” individuals that have some variation in vertical white bars from the
norm for the species. Based on genetic and phenotypic diversity exhibited by the species, we
conclude that genetic diversity is unlikely to be contributing to extinction risk for A. percula.
26	


Table 1. Summary of demographic risk factors for A. percula and relative strength of the evidence indicating these
factors are posing an extinction risk for the species. Characterizations of the relative likelihood (very low, low,
medium, high, or unknown) that a particular factor is contributing in a significant way to the extinction risk of the
species are explained further in the text above.
Demographic Risk Likelihood
Abundance Low*
Growth rate / productivity Low*
Spatial structure and connectivity Unknown
Diversity Low*
*Low means it is unlikely that the particular threat contributes or will contribute significantly to extinction risk for
the species.
Based on the best available information/data, we assigned a low likelihood to three of the four
demographic risk factors because we determined they are unlikely to contribute significantly to
extinction risk for A. percula both now and in the foreseeable future. On a local scale, spatial
structure and connectivity do not appear to be a cause for concern for this species but, because
global genetic structure is unknown, we cannot assign a likelihood that this factor is contributing
to extinction risk for A. percula.
	
  
3.3.	
   Analysis	
  of	
  the	
  ESA	
  Section	
  4(A)(1)	
  Factors	
  
According to section 4 of the ESA, the Secretary determines whether a species is threatened or
endangered as a result of any of the following five factors: (A) Present or threatened destruction,
modification, or curtailment of habitat or range; (B) overutilization; (C) disease or predation; (D)
inadequacy of existing regulatory mechanisms; or (E) other natural or manmade factors.
Collectively, these five factors are referred to here as “threats.” The following sections provide
information on the threats from each of these five factors as they relate to the status of the orange
clownfish. The likelihood that each particular threat is contributing to extinction risk for the
orange clownfish is summarized at the end of this section (Table 2) according to a qualitative
scale:
(1) Very low – it is very unlikely that the particular threat contributes or will contribute
significantly to risk of extinction;
(2) Low – it is unlikely that the particular threat contributes or will contribute
significantly to risk of extinction;
(3) Medium – it is likely the particular threat contributes or will contribute significantly
to risk of extinction; and,
(4) High – it is highly likely that the particular threat contributes or will contribute
significantly to risk of extinction.
(5) Unknown – it is unknown how the particular factor contributes or will contribute to
risk of extinction.
(Note: The term “significantly” is used here as it is generally defined, the same way it is
used under section 3.2 – i.e., in a sufficiently great or important way as to be worthy of
attention.)
If there was some uncertainty between two of the qualitative categories for any particular threat
and/or uncertainty in the future projections or impacts of the threat, we conservatively assigned it
to the higher level of concern.
27	


3.3.1.	
   Factor	
  A:	
  Present	
  or	
  Threatened	
  Destruction,	
  Modification	
  or	
  Curtailment	
  of	
  Habitat	
  
or	
  Range	
  
Anemone	
  Bleaching	
  	
  
Amphiprion percula is described as a habitat specialist due to its symbiotic association primarily
with three species of anemone: Heteractis crispa, H. magnifica, and Stichodactyla gigantea
(Ollerton et al. 2007), although the species has also been reported associating with S. mertensii
(Elliott and Mariscal 2001) and S. haddoni (Planes et al. 2009). As habitat specialists, the
symbiotic relationship between A. percula and its host anemone makes this species indirectly
susceptible to threats that are likely to impact its host anemone. Anemones and their symbiotic
anemonefish inhabit coral reefs and nearby habitats such as lagoons, seagrass beds, and sand
flats (Fautin and Allen 1997). NMFS recently reviewed and summarized the best available
scientific information on the effects of climate change on corals and coral reefs in the final rule
listing 20 coral species as threatened (79 FR 53851).
In summary, increased ocean temperatures are already affecting coral reef communities
worldwide and will continue to do so. While all model results provide evidence that coral reef
communities will be negatively affected in the future, the magnitude of those effects varies
widely over both spatial and temporal scales. Coral reefs and other nearshore areas are highly
heterogeneous habitats that experience yearly, seasonal, daily, and even more frequent
fluctuations in environmental conditions. While some models suggest disastrous effects of
climate change on coral reefs by the year 2100, such projections are based on spatially coarse
analyses associated with high uncertainty, especially at local spatial scales. In addition, the
majority of relevant studies use models based on temperature anomalies and thresholds only;
however, McClanahan et al. (2015) found that temperature threshold indices had weak or no
significant relationship with observed coral cover and susceptibility before, during, and after a
major bleaching event. A more comprehensive multiple parameter approach showed significant
fit with those field observations, indicating heterogeneous environmental causes and responses to
climate disturbances and warming over space and time. Determining the effects of global threats
on an individual coral species over the foreseeable future was described in the coral final listing
rule as complicated by the combination of (1) uncertainty associated with projected ocean
warming and acidification threats; (2) regional and local variability in global threats; (3) large
distributions and high habitat heterogeneity of the species; and (4) limited species-specific
information on responses to global threats. These complicating factors also apply to determining
the effects of future climate change on anemone species that host A. percula. The limited
available information for anemones is described below.	
  
Just like corals, anemones have symbiotic relationships with microscopic algae known as
zooxanthellae. Because of this symbiosis, they are susceptible to thermally-induced bleaching,
during which those symbionts are expelled due to thermal stress (Hill and Scott 2012). Anemone
vulnerability to bleaching events is dependent on susceptibility, exposure, and adaptive capacity
or response, each of which are influenced by a host of biological and environmental factors,
differ across species and locations, and can change over time (Hobbs et al. 2013).
Bleaching events may affect host anemone species by causing reductions in abundance of
anemone populations and/or a reduction in size of bleached anemones (Hattori 2002; Saenz-
Agudelo et al. 2011; Hill and Scott 2012). The degree of impact of such bleaching events varies
28	


widely. Following a mass bleaching event off Sesoko Island, Japan, the number of observed H.
crispa hosts decreased by over 80% (Hattori 2002). In comparison, near Port Moresby, Papua
New Guinea, a bleaching event resulted in the loss of 3 out of 55 S. haddoni and H. crispa
anemones and a reduction in size of the bleached anemones by approximately 34% (Saenz-
Agudelo et al. 2011). While reductions in size were evident in shallower waters at the Papua
New Guinea site, anemones found at depths >7 m were not affected by the bleaching and
researchers noted that all remaining impacted anemones recovered full pigmentation two years
after the bleaching event (Saenz-Agudelo et al. 2011). Variable impacts to anemonefish
assemblages in response to anemone bleaching events have also been reported. These range
from the local extinction of one species of Amphiprion due to displacement by another
Amphiprion species at one site (Hattori 2002), to only short-term changes in female egg
production and recruitment at a different site (Saenz-Agudelo et al. 2011).
The evidence described above, while limited, indicates that thermally-induced bleaching can
have negative impacts on orange clownfish host anemones, which may lead to localized impacts
of unknown magnitude on the fish itself. Evidence thus far indicates high variability in the
response of both anemones and anemonefish to localized bleaching events. As noted above,
susceptibility to thermal stress varies between different species of the same taxon and is often
variable within individual species; as a result of habitat heterogeneity across a species’ range,
individuals of the same species may develop in very different environmental conditions. Hobbs
et al. (2013) compiled datasets that were collected between 2005 and 2012 across 276 sites at 19
locations in the Pacific Ocean, Indian Ocean, and Red Sea to examine taxonomic, spatial, and
temporal patterns of anemone bleaching. Their results confirm that bleaching has been observed
in 7 of the 10 anemone species that host anemonefish (including four of the five A. percula host
species), with anecdotal reports of bleaching in the remaining 3 host anemone species. In
addition, they report anemone bleaching at 10 of 19 survey locations that are geographically
widespread. Importantly, they report considerable spatial and inter-specific variation in
bleaching susceptibility across multiple major bleaching events (Hobbs et al. 2013). Over the
entire timeframe and across all study areas, 3.5% of all anemones observed were bleached,
although during major bleaching events, the percentage at a given study area ranged from 19-
100%. At sites within the same study area, bleaching ranged between as much as 0 and 94%
during a single bleaching event. To further highlight the variability and uncertainty associated
with anemone bleaching susceptibility, Hobbs et al. (2013) report opposite patterns of
susceptibility for the same two species at the same site during two different bleaching events.
Additionally, the study reports decreased bleaching with increased depth in most of the major
bleaching events, indicating that depth, in some cases as shallow as 7 m, offers a refuge from
bleaching (Hobbs et al. 2013). Some anemone species have even been reported from mesophotic
depths, including one A. percula host species (H. crispa) (Bridge et al. 2012). These depths
likely serve as refugia from thermal stress. Although the capacity for acclimation or adaptation
in anemones is unknown, evidence from one site indicated that prior bleaching history may
influence subsequent likelihood of an anemone bleaching, as previously bleached individuals
were less likely to bleach a second time (Hobbs et al. 2013). It is also of note that, similar to
corals, bleaching does not automatically lead to mortality for anemones. Hobbs et al. (2013)
report variable consequences as a result of bleaching between and among species and locations
in their assessment of bleaching for all anemone species that host anemonefish (including those
that host A. percula); some species decreased in abundance and/or size after bleaching events,
while others showed no effect and recovered fully.
29	


When considering the effect of anemone bleaching into the foreseeable future, we evaluated the
best available information on future projections of warming-induced bleaching events, but also
considered the existing information on the impacts of previous bleaching events on anemones.
Evidence suggests that bleaching events will continue to occur and become more severe and
more frequent over the next few decades (van Hooidonk 2013). However, newer multivariate
modeling approaches indicate that traditional temperature threshold models may not give an
accurate picture of the likely outcomes of climate change for coral reefs, and impacts and
responses will be highly nuanced and heterogeneous across space and time (McClanahan et al.
2015). Although observed anemone bleaching has thus far been highly variable during localized
events, the overall effect of bleaching events on anemones globally (i.e., overall proportion of
observed anemones that have shown ill effects) has been of low magnitude at sites across their
ranges, as only 3.5% of the nearly 14,000 observed anemones were recorded as bleached across
19 study sites and multiple major bleaching events (Hobbs et al. 2013). The low overall effect
thus far, high amount of variability in anemone susceptibility, existence of depth refugia for
anemones, evidence of potential acclimation in some species, and the fact that A. percula has
been observed in the wild to associate with at least five different species of anemone that have
shown different levels of susceptibility to bleaching in different locations and over time, are all
factors that, in combination, indicate that A. percula is likely resilient to bleaching impacts that
may affect their hosts both now and in the foreseeable future. As such, we conclude that the
threat of habitat loss due to anemone bleaching has a low likelihood of contributing to extinction
risk for A. percula now or in the foreseeable future.
Anemone	
  Collection	
  	
  
Just like the fish they host, anemones are often collected for the marine aquarium trade. There
has been a recent shift in home aquaria from fish-only tanks to tanks that recreate mini-reef
environments with the inclusion of live invertebrates and corals, as well as live rock along with
tropical reef fish (Murray and Watson 2014). In a survey of 314 home aquarium hobbyists, 39%
indicated they have anemones in their tanks (Murray and Watson 2014). Thus far, there has been
limited successful aquaculture of anemones for aquaria; Moe (2003) reports the results from a
survey of hobbyists, scientists, and commercial breeders indicating several species have been
successfully propagated (typically via asexual reproduction), but anemones typically thwart both
scientific and hobbyist attempts at captive culture, especially on a large scale. As such, the vast
majority of anemone specimens in the trade are currently from wild collection. There is little
information available on the amount of collection or trade in wild anemones; none are listed
under the Convention of International Trade in Endangered Species of Wild Flora and Fauna
(CITES), so import/export of these species does not require CITES documentation, which
otherwise might be a source of information about the magnitude of trade.
Limited information is available on the impacts of collection to anemone populations in
Australia. Jones et al. (2008) surveyed two different regions of the Great Barrier Reef with
contrasting disturbance histories to determine the degree to which densities of anemones and
anemonefish are driven by bleaching and collection. They found that collection has likely
exacerbated the effects of bleaching and other disturbances on anemones in the Keppel Islands
region. In contrast, high densities of anemones and anemonefish were recorded in the Far North
Queensland region where collection also occurs, but fewer other disturbances have occurred.
The authors note that the Keppel Islands region is isolated from other reef areas, which likely
affects its ability to recover from disturbances via input from nearby reefs. Amphiprion percula
Status Review Report: Orange clownfish (Amphiprion percula)

More Related Content

Similar to Status Review Report: Orange clownfish (Amphiprion percula)

NOAA Tech Memo/Status Review Report: Humphead Wrasse (Cheilinus undulatus)
NOAA Tech Memo/Status Review Report: Humphead Wrasse (Cheilinus undulatus)NOAA Tech Memo/Status Review Report: Humphead Wrasse (Cheilinus undulatus)
NOAA Tech Memo/Status Review Report: Humphead Wrasse (Cheilinus undulatus)Krista (Spencer) Graham
 
Don't Feed the Fish Final Report
Don't Feed the Fish Final ReportDon't Feed the Fish Final Report
Don't Feed the Fish Final ReportMarisa Sprowles
 
Fluke Management Plan
Fluke Management PlanFluke Management Plan
Fluke Management PlanAshley Sidhu
 
Distribution of the parasitic snail, Cyphoma gibbosum, and its effects on the...
Distribution of the parasitic snail, Cyphoma gibbosum, and its effects on the...Distribution of the parasitic snail, Cyphoma gibbosum, and its effects on the...
Distribution of the parasitic snail, Cyphoma gibbosum, and its effects on the...Muriel Magnaye
 
CBD's clownfish and damselfish petition
CBD's clownfish and damselfish petitionCBD's clownfish and damselfish petition
CBD's clownfish and damselfish petitionHonolulu Civil Beat
 
Waterbird Conservation for the Americas
Waterbird Conservation for the AmericasWaterbird Conservation for the Americas
Waterbird Conservation for the AmericasSotirakou964
 
MBA_SeafoodWatch_Groundfish_Alaska_Report
MBA_SeafoodWatch_Groundfish_Alaska_ReportMBA_SeafoodWatch_Groundfish_Alaska_Report
MBA_SeafoodWatch_Groundfish_Alaska_ReportJohn Driscoll
 
Newsletter 205
Newsletter 205Newsletter 205
Newsletter 205ESTHHUB
 
fish genetics and conservation of aquatic species
fish genetics and conservation of aquatic speciesfish genetics and conservation of aquatic species
fish genetics and conservation of aquatic speciesjaYSHRI SHELKE
 
Effect of Light, Temperature and salinity on the growth of ARTEMIA
Effect of Light, Temperature and salinity on the growth of ARTEMIAEffect of Light, Temperature and salinity on the growth of ARTEMIA
Effect of Light, Temperature and salinity on the growth of ARTEMIAinventionjournals
 
Population Viability Analysis and Responses to Loss
Population Viability Analysis and Responses to LossPopulation Viability Analysis and Responses to Loss
Population Viability Analysis and Responses to LossHawkesdale P12 College
 
Online assignment nithin s p
Online assignment   nithin s pOnline assignment   nithin s p
Online assignment nithin s pnithinsp4
 
7 haddad et al, 2004. freshwater stingrays study of epidemiologic, clinic
7  haddad et al, 2004. freshwater stingrays study of epidemiologic, clinic7  haddad et al, 2004. freshwater stingrays study of epidemiologic, clinic
7 haddad et al, 2004. freshwater stingrays study of epidemiologic, clinicpryloock
 

Similar to Status Review Report: Orange clownfish (Amphiprion percula) (20)

NOAA Tech Memo/Status Review Report: Humphead Wrasse (Cheilinus undulatus)
NOAA Tech Memo/Status Review Report: Humphead Wrasse (Cheilinus undulatus)NOAA Tech Memo/Status Review Report: Humphead Wrasse (Cheilinus undulatus)
NOAA Tech Memo/Status Review Report: Humphead Wrasse (Cheilinus undulatus)
 
Don't Feed the Fish Final Report
Don't Feed the Fish Final ReportDon't Feed the Fish Final Report
Don't Feed the Fish Final Report
 
Fluke Management Plan
Fluke Management PlanFluke Management Plan
Fluke Management Plan
 
Distribution of the parasitic snail, Cyphoma gibbosum, and its effects on the...
Distribution of the parasitic snail, Cyphoma gibbosum, and its effects on the...Distribution of the parasitic snail, Cyphoma gibbosum, and its effects on the...
Distribution of the parasitic snail, Cyphoma gibbosum, and its effects on the...
 
CBD's clownfish and damselfish petition
CBD's clownfish and damselfish petitionCBD's clownfish and damselfish petition
CBD's clownfish and damselfish petition
 
rm-marinemammals
rm-marinemammalsrm-marinemammals
rm-marinemammals
 
Waterbird Conservation for the Americas
Waterbird Conservation for the AmericasWaterbird Conservation for the Americas
Waterbird Conservation for the Americas
 
MBA_SeafoodWatch_Groundfish_Alaska_Report
MBA_SeafoodWatch_Groundfish_Alaska_ReportMBA_SeafoodWatch_Groundfish_Alaska_Report
MBA_SeafoodWatch_Groundfish_Alaska_Report
 
Newsletter 205
Newsletter 205Newsletter 205
Newsletter 205
 
Marine conservation
Marine conservationMarine conservation
Marine conservation
 
Fish Dictionary (Glossary) A TO Z
Fish Dictionary (Glossary) A TO ZFish Dictionary (Glossary) A TO Z
Fish Dictionary (Glossary) A TO Z
 
FISH DICTIONARY (GLOSSARY)
FISH DICTIONARY (GLOSSARY)FISH DICTIONARY (GLOSSARY)
FISH DICTIONARY (GLOSSARY)
 
Shark overfishing
Shark overfishingShark overfishing
Shark overfishing
 
fish genetics and conservation of aquatic species
fish genetics and conservation of aquatic speciesfish genetics and conservation of aquatic species
fish genetics and conservation of aquatic species
 
Effect of Light, Temperature and salinity on the growth of ARTEMIA
Effect of Light, Temperature and salinity on the growth of ARTEMIAEffect of Light, Temperature and salinity on the growth of ARTEMIA
Effect of Light, Temperature and salinity on the growth of ARTEMIA
 
StatusReport23701
StatusReport23701StatusReport23701
StatusReport23701
 
Population Viability Analysis and Responses to Loss
Population Viability Analysis and Responses to LossPopulation Viability Analysis and Responses to Loss
Population Viability Analysis and Responses to Loss
 
Online assignment nithin s p
Online assignment   nithin s pOnline assignment   nithin s p
Online assignment nithin s p
 
7 haddad et al, 2004. freshwater stingrays study of epidemiologic, clinic
7  haddad et al, 2004. freshwater stingrays study of epidemiologic, clinic7  haddad et al, 2004. freshwater stingrays study of epidemiologic, clinic
7 haddad et al, 2004. freshwater stingrays study of epidemiologic, clinic
 
2
22
2
 

Recently uploaded

LUNULARIA -features, morphology, anatomy ,reproduction etc.
LUNULARIA -features, morphology, anatomy ,reproduction etc.LUNULARIA -features, morphology, anatomy ,reproduction etc.
LUNULARIA -features, morphology, anatomy ,reproduction etc.Silpa
 
Dr. E. Muralinath_ Blood indices_clinical aspects
Dr. E. Muralinath_ Blood indices_clinical  aspectsDr. E. Muralinath_ Blood indices_clinical  aspects
Dr. E. Muralinath_ Blood indices_clinical aspectsmuralinath2
 
Gwalior ❤CALL GIRL 84099*07087 ❤CALL GIRLS IN Gwalior ESCORT SERVICE❤CALL GIRL
Gwalior ❤CALL GIRL 84099*07087 ❤CALL GIRLS IN Gwalior ESCORT SERVICE❤CALL GIRLGwalior ❤CALL GIRL 84099*07087 ❤CALL GIRLS IN Gwalior ESCORT SERVICE❤CALL GIRL
Gwalior ❤CALL GIRL 84099*07087 ❤CALL GIRLS IN Gwalior ESCORT SERVICE❤CALL GIRLkantirani197
 
Molecular markers- RFLP, RAPD, AFLP, SNP etc.
Molecular markers- RFLP, RAPD, AFLP, SNP etc.Molecular markers- RFLP, RAPD, AFLP, SNP etc.
Molecular markers- RFLP, RAPD, AFLP, SNP etc.Silpa
 
Module for Grade 9 for Asynchronous/Distance learning
Module for Grade 9 for Asynchronous/Distance learningModule for Grade 9 for Asynchronous/Distance learning
Module for Grade 9 for Asynchronous/Distance learninglevieagacer
 
Biogenic Sulfur Gases as Biosignatures on Temperate Sub-Neptune Waterworlds
Biogenic Sulfur Gases as Biosignatures on Temperate Sub-Neptune WaterworldsBiogenic Sulfur Gases as Biosignatures on Temperate Sub-Neptune Waterworlds
Biogenic Sulfur Gases as Biosignatures on Temperate Sub-Neptune WaterworldsSérgio Sacani
 
TransientOffsetin14CAftertheCarringtonEventRecordedbyPolarTreeRings
TransientOffsetin14CAftertheCarringtonEventRecordedbyPolarTreeRingsTransientOffsetin14CAftertheCarringtonEventRecordedbyPolarTreeRings
TransientOffsetin14CAftertheCarringtonEventRecordedbyPolarTreeRingsSérgio Sacani
 
development of diagnostic enzyme assay to detect leuser virus
development of diagnostic enzyme assay to detect leuser virusdevelopment of diagnostic enzyme assay to detect leuser virus
development of diagnostic enzyme assay to detect leuser virusNazaninKarimi6
 
GBSN - Microbiology (Unit 3)Defense Mechanism of the body
GBSN - Microbiology (Unit 3)Defense Mechanism of the body GBSN - Microbiology (Unit 3)Defense Mechanism of the body
GBSN - Microbiology (Unit 3)Defense Mechanism of the body Areesha Ahmad
 
Genetics and epigenetics of ADHD and comorbid conditions
Genetics and epigenetics of ADHD and comorbid conditionsGenetics and epigenetics of ADHD and comorbid conditions
Genetics and epigenetics of ADHD and comorbid conditionsbassianu17
 
Zoology 5th semester notes( Sumit_yadav).pdf
Zoology 5th semester notes( Sumit_yadav).pdfZoology 5th semester notes( Sumit_yadav).pdf
Zoology 5th semester notes( Sumit_yadav).pdfSumit Kumar yadav
 
biology HL practice questions IB BIOLOGY
biology HL practice questions IB BIOLOGYbiology HL practice questions IB BIOLOGY
biology HL practice questions IB BIOLOGY1301aanya
 
Thyroid Physiology_Dr.E. Muralinath_ Associate Professor
Thyroid Physiology_Dr.E. Muralinath_ Associate ProfessorThyroid Physiology_Dr.E. Muralinath_ Associate Professor
Thyroid Physiology_Dr.E. Muralinath_ Associate Professormuralinath2
 
The Mariana Trench remarkable geological features on Earth.pptx
The Mariana Trench remarkable geological features on Earth.pptxThe Mariana Trench remarkable geological features on Earth.pptx
The Mariana Trench remarkable geological features on Earth.pptxseri bangash
 
Human & Veterinary Respiratory Physilogy_DR.E.Muralinath_Associate Professor....
Human & Veterinary Respiratory Physilogy_DR.E.Muralinath_Associate Professor....Human & Veterinary Respiratory Physilogy_DR.E.Muralinath_Associate Professor....
Human & Veterinary Respiratory Physilogy_DR.E.Muralinath_Associate Professor....muralinath2
 
(May 9, 2024) Enhanced Ultrafast Vector Flow Imaging (VFI) Using Multi-Angle ...
(May 9, 2024) Enhanced Ultrafast Vector Flow Imaging (VFI) Using Multi-Angle ...(May 9, 2024) Enhanced Ultrafast Vector Flow Imaging (VFI) Using Multi-Angle ...
(May 9, 2024) Enhanced Ultrafast Vector Flow Imaging (VFI) Using Multi-Angle ...Scintica Instrumentation
 
Cyanide resistant respiration pathway.pptx
Cyanide resistant respiration pathway.pptxCyanide resistant respiration pathway.pptx
Cyanide resistant respiration pathway.pptxSilpa
 
Climate Change Impacts on Terrestrial and Aquatic Ecosystems.pptx
Climate Change Impacts on Terrestrial and Aquatic Ecosystems.pptxClimate Change Impacts on Terrestrial and Aquatic Ecosystems.pptx
Climate Change Impacts on Terrestrial and Aquatic Ecosystems.pptxDiariAli
 

Recently uploaded (20)

LUNULARIA -features, morphology, anatomy ,reproduction etc.
LUNULARIA -features, morphology, anatomy ,reproduction etc.LUNULARIA -features, morphology, anatomy ,reproduction etc.
LUNULARIA -features, morphology, anatomy ,reproduction etc.
 
Dr. E. Muralinath_ Blood indices_clinical aspects
Dr. E. Muralinath_ Blood indices_clinical  aspectsDr. E. Muralinath_ Blood indices_clinical  aspects
Dr. E. Muralinath_ Blood indices_clinical aspects
 
Gwalior ❤CALL GIRL 84099*07087 ❤CALL GIRLS IN Gwalior ESCORT SERVICE❤CALL GIRL
Gwalior ❤CALL GIRL 84099*07087 ❤CALL GIRLS IN Gwalior ESCORT SERVICE❤CALL GIRLGwalior ❤CALL GIRL 84099*07087 ❤CALL GIRLS IN Gwalior ESCORT SERVICE❤CALL GIRL
Gwalior ❤CALL GIRL 84099*07087 ❤CALL GIRLS IN Gwalior ESCORT SERVICE❤CALL GIRL
 
Molecular markers- RFLP, RAPD, AFLP, SNP etc.
Molecular markers- RFLP, RAPD, AFLP, SNP etc.Molecular markers- RFLP, RAPD, AFLP, SNP etc.
Molecular markers- RFLP, RAPD, AFLP, SNP etc.
 
Clean In Place(CIP).pptx .
Clean In Place(CIP).pptx                 .Clean In Place(CIP).pptx                 .
Clean In Place(CIP).pptx .
 
Module for Grade 9 for Asynchronous/Distance learning
Module for Grade 9 for Asynchronous/Distance learningModule for Grade 9 for Asynchronous/Distance learning
Module for Grade 9 for Asynchronous/Distance learning
 
Biogenic Sulfur Gases as Biosignatures on Temperate Sub-Neptune Waterworlds
Biogenic Sulfur Gases as Biosignatures on Temperate Sub-Neptune WaterworldsBiogenic Sulfur Gases as Biosignatures on Temperate Sub-Neptune Waterworlds
Biogenic Sulfur Gases as Biosignatures on Temperate Sub-Neptune Waterworlds
 
TransientOffsetin14CAftertheCarringtonEventRecordedbyPolarTreeRings
TransientOffsetin14CAftertheCarringtonEventRecordedbyPolarTreeRingsTransientOffsetin14CAftertheCarringtonEventRecordedbyPolarTreeRings
TransientOffsetin14CAftertheCarringtonEventRecordedbyPolarTreeRings
 
development of diagnostic enzyme assay to detect leuser virus
development of diagnostic enzyme assay to detect leuser virusdevelopment of diagnostic enzyme assay to detect leuser virus
development of diagnostic enzyme assay to detect leuser virus
 
GBSN - Microbiology (Unit 3)Defense Mechanism of the body
GBSN - Microbiology (Unit 3)Defense Mechanism of the body GBSN - Microbiology (Unit 3)Defense Mechanism of the body
GBSN - Microbiology (Unit 3)Defense Mechanism of the body
 
Genetics and epigenetics of ADHD and comorbid conditions
Genetics and epigenetics of ADHD and comorbid conditionsGenetics and epigenetics of ADHD and comorbid conditions
Genetics and epigenetics of ADHD and comorbid conditions
 
Zoology 5th semester notes( Sumit_yadav).pdf
Zoology 5th semester notes( Sumit_yadav).pdfZoology 5th semester notes( Sumit_yadav).pdf
Zoology 5th semester notes( Sumit_yadav).pdf
 
biology HL practice questions IB BIOLOGY
biology HL practice questions IB BIOLOGYbiology HL practice questions IB BIOLOGY
biology HL practice questions IB BIOLOGY
 
Thyroid Physiology_Dr.E. Muralinath_ Associate Professor
Thyroid Physiology_Dr.E. Muralinath_ Associate ProfessorThyroid Physiology_Dr.E. Muralinath_ Associate Professor
Thyroid Physiology_Dr.E. Muralinath_ Associate Professor
 
The Mariana Trench remarkable geological features on Earth.pptx
The Mariana Trench remarkable geological features on Earth.pptxThe Mariana Trench remarkable geological features on Earth.pptx
The Mariana Trench remarkable geological features on Earth.pptx
 
Human & Veterinary Respiratory Physilogy_DR.E.Muralinath_Associate Professor....
Human & Veterinary Respiratory Physilogy_DR.E.Muralinath_Associate Professor....Human & Veterinary Respiratory Physilogy_DR.E.Muralinath_Associate Professor....
Human & Veterinary Respiratory Physilogy_DR.E.Muralinath_Associate Professor....
 
(May 9, 2024) Enhanced Ultrafast Vector Flow Imaging (VFI) Using Multi-Angle ...
(May 9, 2024) Enhanced Ultrafast Vector Flow Imaging (VFI) Using Multi-Angle ...(May 9, 2024) Enhanced Ultrafast Vector Flow Imaging (VFI) Using Multi-Angle ...
(May 9, 2024) Enhanced Ultrafast Vector Flow Imaging (VFI) Using Multi-Angle ...
 
Cyanide resistant respiration pathway.pptx
Cyanide resistant respiration pathway.pptxCyanide resistant respiration pathway.pptx
Cyanide resistant respiration pathway.pptx
 
Climate Change Impacts on Terrestrial and Aquatic Ecosystems.pptx
Climate Change Impacts on Terrestrial and Aquatic Ecosystems.pptxClimate Change Impacts on Terrestrial and Aquatic Ecosystems.pptx
Climate Change Impacts on Terrestrial and Aquatic Ecosystems.pptx
 
+971581248768>> SAFE AND ORIGINAL ABORTION PILLS FOR SALE IN DUBAI AND ABUDHA...
+971581248768>> SAFE AND ORIGINAL ABORTION PILLS FOR SALE IN DUBAI AND ABUDHA...+971581248768>> SAFE AND ORIGINAL ABORTION PILLS FOR SALE IN DUBAI AND ABUDHA...
+971581248768>> SAFE AND ORIGINAL ABORTION PILLS FOR SALE IN DUBAI AND ABUDHA...
 

Status Review Report: Orange clownfish (Amphiprion percula)

  • 1. Status Review Report: Orange Clownfish (Amphiprion percula) ©Margaret Paton Walsh 2015 National Marine Fisheries Service National Oceanic and Atmospheric Administration U.S. Department of Commerce
  • 2. 2     Acknowledgements   Numerous individual biologists, scientists, and managers provided information that aided in preparation of this report and deserve special thanks. We particularly wish to thank Maarten De Brauwer, Jeff Kinch, Andrew Rhyne, and Colette Wabnitz for information, data, and professional opinions. We would also like to thank those who submitted information through the public comment process. We would especially like to thank the peer reviewers Peter Buston, Maarten De Brauwer, and Colette Wabnitz for their time and professional review of this report. This document should be cited as: Maison, K.A. and K.S. Graham. 2015. Status review report: Orange clownfish (Amphiprion percula). Report to National Marine Fisheries Service, Office of Protected Resources. July, 2015. 67 p.
  • 3. 3     Executive  Summary   This report was produced in response to a petition received from the Center for Biological Diversity on September 14, 2012, to list eight species of pomacentrid reef fish as endangered or threatened under the Endangered Species Act (ESA) and to designate critical habitat for these species concurrent with the listing. The National Marine Fisheries Service (NMFS) evaluated the petition to determine whether the petitioner provided substantial information as required by the ESA to determine that listing these species may be warranted. On September 3, 2014, the NMFS Pacific Islands Regional Office (PIRO) announced in the Federal Register that the petition presented substantial information that listing may be warranted for the orange clownfish (Amphiprion percula), and NMFS requested information on this species from the public (79 FR 52276). Subsequently, NMFS initiated a status review of this species, which we document in this report. This report summarizes the best available scientific and commercial information on the orange clownfish, and presents an evaluation of the species’ status and extinction risk. On September 3, 2014, NMFS PIRO also announced a negative 90-day finding for the six Indo- Pacific damselfishes: Hawaiian dascyllus (Dascyllus albisella), blue-eyed damselfish (Plectroglyphidodon johnstonianus), black-axil chromis (Chromis atripectoralis), blue-green damselfish (Chromis viridis), reticulated damselfish (Dascyllus reticulatus), and blackbar devil or Dick’s damselfish (Plectroglyphidodon dickii). The NMFS Southeast Regional Office led the response to the petition to list the yellowtail damselfish (Microspathodon chrysurus) and announced a negative 90-day finding (80 FR 8619) for that species on February 18, 2015.     In assessing four demographic risks for A. percula -- abundance, growth rate/productivity, spatial structure, and diversity -- we determined that the likelihood of these risks individually contributing to the extinction risk for the species is low or unknown. We also assessed current and predicted threats to the species and determined that the likelihood of these individual threats contributing to the extinction risk of the species throughout its range varies between very low and low-to-medium. We acknowledge that uncertainties exist regarding how these demographic risks and current and predicted threats may affect the species at both the individual and population levels.     Of the 12 identified current and predicted threats, our greatest concern relates to the species’ susceptibility and exposure to sedimentation and nutrients, as well as the inadequacy of regulatory mechanisms to address this threat, especially since juveniles and adults occur in shallow water and are non-migratory once they have settled into a host anemone. Therefore, we conservatively assigned a low-to-medium likelihood that both this threat and the inadequate regulatory mechanisms to address this threat may significantly contribute to the extinction risk for A. percula. The range of the species across heterogeneous habitats, the conservatively estimated abundance of 13-18 million individuals, the spatial and temporal variation in threats, coupled with resiliency and potential for trans-generational adaptive capabilities to future impacts all contribute to a low overall vulnerability of the species to the collective threats we have identified. We have determined that the overall extinction risk to A. percula is low, both now and in the foreseeable future.
  • 4. 4     Table  of  Contents     Acknowledgements  .....................................................................................................................................  2   Executive  Summary  .....................................................................................................................................  3   1.0.     INTRODUCTION  ...................................................................................................................  6   1.1.   Scope  and  Intent  of  this  Document  .....................................................................................  6   1.2.   Questions  and  Information  Considered  in  ESA  Evaluations  ................................................  6   2.0.     LIFE  HISTORY  AND  ECOLOGY  ...............................................................................................  7   2.1.     Classification  and  Distinctive  Characteristics  ......................................................................  7   2.2.   Habitat  .................................................................................................................................  9   2.3.     Diet,  Feeding,  and  Growth  ................................................................................................  11   2.4.     Reproduction  and  Development  .......................................................................................  12   2.5.   Settlement  and  Recruitment  .............................................................................................  13   2.6.     Longevity  and  Resilience  ...................................................................................................  14   2.7.     Geographic  Range  .............................................................................................................  15   2.8.   Distribution  and  Connectivity  ............................................................................................  16   2.9.     Estimated  Abundance  .......................................................................................................  20   3.0.     ASSESSMENT  OF  EXTINCTION  RISK  ..............................................................................  20   3.1.     Approach  to  Evaluating  Extinction  Risk  .............................................................................  20   3.1.1.   Foreseeable  Future  ............................................................................................................  22   3.2.     Demographic  Risks  ............................................................................................................  22   3.2.1.   Abundance  .........................................................................................................................  23   3.2.2.   Population  Growth  Rate  /  Productivity  ..............................................................................  23   3.2.3.   Spatial  Structure  /  Connectivity  .........................................................................................  24   3.2.4.   Diversity  .............................................................................................................................  25   3.3.   Analysis  of  the  ESA  Section  4(A)(1)  Factors  .......................................................................  26   3.3.1.   Factor  A:  Present  or  Threatened  Destruction,  Modification  or  Curtailment  of  Habitat  or   Range  .................................................................................................................................  27   3.3.2.   Factor  B:  Overutilization  for  Commercial,  Recreational,  Scientific,  or  Educational  Purposes  ...........................................................................................................................................  32   3.3.3.   Factor  C:  Disease  or  Predation  ...........................................................................................  37   3.3.4.     Factor  D:  Inadequacy  of  Existing  Regulatory  Mechanisms  ................................................  37   3.3.5.   Factor  E:  Other  Natural  or  Manmade  Factors  ....................................................................  44  
  • 5. 5     3.3.6.     Summary  of  Threats  ...........................................................................................................  47   4.0.     CONSERVATION  EFFORTS  ..................................................................................................  48   5.0.     SYNTHESIS  AND  CONCLUSION  ...........................................................................................  50   6.0.   REFERENCES  ......................................................................................................................  51        
  • 6. 6     1.0.     INTRODUCTION   1.1.   Scope  and  Intent  of  this  Document   This report documents the status review conducted in response to a petition1 to list the orange clownfish (Amphiprion percula) under the Endangered Species Act (ESA). Under the ESA, if a petition is found to present substantial scientific or commercial information that the petitioned action may be warranted, a status review shall be promptly commenced (16 U.S.C. 1533(b)(3)(A)). The National Marine Fisheries Service (NMFS or NOAA Fisheries) determined that the petition presented substantial information that a status review was warranted for the orange clownfish (79 FR 52276; September 3, 2014), and promptly initiated a status review. The ESA stipulates that listing determinations should be made based on the best scientific and commercial information available, after taking into consideration any efforts by any State or foreign nation, or any political subdivision of a State or foreign nation, to protect the species (16 U.S.C. §1533(b)). NMFS assigned two Endangered Species Biologists in the Protected Resources Division of the NMFS Pacific Islands Regional Office (PIRO) to compile the best available data on this species, and complete a thorough review of the biology, population status, and future outlook for this species. An extensive literature search was undertaken and researchers were contacted regarding gray literature and additional information. As announced in the 90-day finding, NMFS also solicited the public for relevant data and information from September 3, 2014, through November 3, 2014. Relevant information submitted by the public, contributed by experts, and extracted from the literature search is incorporated into this status review. This status review includes an analysis of the biology, demography, and ecology of the species, threats to the species, and makes conclusions regarding the extinction risk of the species. For the risk assessment, we used a qualitative reference level of relative extinction risk modified from the reference levels commonly used in status reviews (e.g., rockfish in the Puget Sound, Banggai cardinal fish, etc.). Recommendations as to whether the species should be listed as threatened or endangered were not made. Rather, conclusions are drawn about the overall risk of extinction faced by the species based on an evaluation of the species’ current status, demographic risks, as well as present and future threats to the species and how the species is responding, or is likely to respond in the future, to those threats. 1.2.   Questions  and  Information  Considered  in  ESA  Evaluations   In determining whether a listing under the ESA is warranted, two key questions must be addressed: 1) Is the entity in question a “species” as defined by the ESA? 2) If so, is the “species” threatened or endangered? Section 3 of the ESA defines a “species” to include “any subspecies of fish or wildlife or plants, and any distinct population segment (DPS) of any species of vertebrate fish or wildlife which                                                                                                                           1  Center for Biological Diversity to U.S. Secretary of Commerce, Acting through the National Oceanic and Atmospheric Administration and the National Marine Fisheries Service, September 14, 2012, “Petition to list 8 species of Pomacentrid reef fish under the U.S. Endangered Species Act.”  
  • 7. 7     interbreeds when mature.” Section 3 further defines the term “endangered species” as “any species which is in danger of extinction throughout all or a significant portion of its range.” The term “threatened species” is defined as “any species which is likely to become an endangered species within the foreseeable future throughout all or a significant portion of its range.” NMFS considers a variety of information in evaluating the level of risk faced by a species in deciding whether the species meets the statutory definition of either threatened or endangered. Important considerations include 1) absolute numbers of individuals and their spatial and temporal distribution, 2) current abundance in relation to historical abundance and carrying capacity of the habitat, 3) trends in abundance, 4) natural and human influenced factors that cause variability in survival and abundance, 5) possible threats to genetic integrity, and 6) recent events (e.g., a change in management) that have predictable short-term consequences for abundance of the species. Additional risk factors, such as disease prevalence or life history traits, may also be considered in evaluating risk to populations (NMFS 2013). Under section 4(a)(1) of the ESA, NMFS must determine whether one or more of the following factors is/are causing a species to be threatened or endangered: (A) The present or threatened destruction, modification or curtailment of its habitat or range; (B) Overutilization for commercial, recreational, scientific, or educational purposes; (C) Disease or predation; (D) The inadequacy of existing regulatory mechanisms; or (E) Other natural or human factors affecting its continued existence. The determination of whether a species is threatened or endangered must be based on the best available scientific and commercial information regarding its current status, after taking into consideration measures in place to conserve the species. The purpose of this document is to review and summarize the best available information/data to describe the status of the orange clownfish. A determination as to whether or not the species meets the statutory definition of threatened or endangered, and therefore may be warranted for listing, is not included in this document but will be included in the 12-month finding for the species. 2.0.     LIFE  HISTORY  AND  ECOLOGY   2.1.     Classification  and  Distinctive  Characteristics   The orange clownfish, Amphiprion percula, is a valid taxonomic species within the family Pomacentridae. The species was first described by Lacepède in 1802, as Lutjanus percula and later re-described as Amphiprion percula (Florida Museum of Natural History 2005). There are 360 species in the Pomacentridae family that are classified into 29 genera. Two of those genera contain all 28 recognized species of clownfish: one species in the genus Premnas, and the remaining species in the genus Amphiprion. The number of recognized clownfish species has evolved over time due to inconsistent recognition of natural hybrids and geographic color variants of previously described species as separate species in the literature (Allen 1991; Fautin and Allen 1997; Buston and Garcia 2007; Ollerton et al. 2007; Allen et al. 2008; Thornhill 2012;
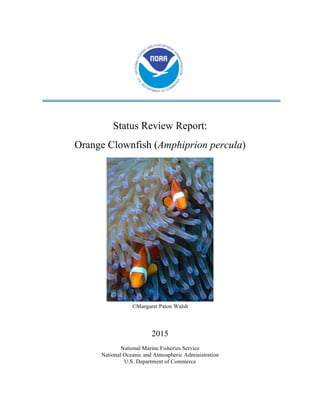
  • 8. 8     Litsios et al. 2014; and Tao et al. 2014). Their mutualistic relationship with sea anemones is correlated with the adaptive radiation and accelerated speciation of clownfish species (Litsios et al. 2012). In addition, hybridization events are linked with diversification in clownfish, and several recently diverged clownfish lineages likely originated through hybridization. This suggests that diversification, catalyzed by hybridization events, may still be happening (Litsios and Salamin 2014). The taxonomic classification for A. percula is as follows: Kingdom: Animalia Phylum: Chordata Class: Actinopterygii Order: Perciformes Family: Pomacentridae Genus: Amphiprion Species: percula The species is known by common English names that include orange clownfish, clown anemonefish, percula clownfish, percula anemonefish, orange anemonefish, true percula clownfish, blackfinned clownfish, eastern clownfish, eastern clown anemonefish, and orange- clown anemonefish (Animal-World 2015). Common names in other languages include bantay bot-bot (Cebuano); orangegul klovnfisk (Danish); pata (Davawenyo); maumanu ni masao (Gela); clownfisch (German); samok-samok (Kagayanen); paja-paja (Makassarese); clown fish biak, gelang roay (Malay); amfiprion (Polish); baro-baro (Visayan); and bantay-kibot (Waray-waray) (Florida Museum of Natural History 2005). A more comprehensive list of common names can be found at the Fishbase web site (www.Fishbase.org). Amphiprion percula is bright orange with three thick white vertical bars (see Figure 1). The anterior bar occurs just behind the eye, the middle bar bisects the fish and has a forward- projecting bulge, and the posterior bar occurs near the caudal fin. The white bars have a black border that varies in width. Orange clownfish have 30-38 pored scales with no interruptions along the lateral line, and their fins have black tips (Fautin and Allen 1997; Florida Museum of Natural History 2005). Although this describes the type specimen, some polymorphism does occur with diverse geographic regional and local color forms, mostly in the form of variation in the width of the black margin along the white bars (Militz 2015; Timm et al. 2008). Figure 1: Photograph of A. percula. © www.aquaticcreationsgroup.com
  • 9. 9     While there is no difference in color pattern between sexes, dimorphic variation is present in size as females are larger than males (Fautin and Allen 1997; Florida Museum of Natural History 2005). It is important to note that size alone cannot be used to identify the sex of an individual because individuals in different groups will vary in maximum and minimum size. Maximum reported length for this species is approximately 80 millimeters (mm) (Fautin and Allen 1997), but individuals up to 110 mm in length have been reported (Florida Museum of Natural History 2005). Standard length is reported as 46 mm for females and 36 mm for males (Florida Museum of Natural History 2005). The total length of a fish has been correlated with the diameter of its host anemone (Fautin 1992), with larger anemones hosting larger clownfish. Amphiprion percula very closely resembles A. ocellaris, also known as the false percula clownfish, and the two are considered sibling species. There are several morphological differences that may allow an observer, upon closer examination, to distinguish between the two species. Amphiprion percula has 9-10 dorsal spines while A. ocellaris has 10-11 (Timm et al. 2008), and the anterior part of A. percula’s dorsal fin is shorter than that of A. ocellaris. In addition, A. percula has a thick black margin around its white bars whereas A. ocellaris often has a thin or even non-existent black margin, though this is not always the case. Amphiprion percula has been described as more brilliant in color, and its iris is orange, giving the appearance of very small eyes while the iris of A. ocellaris is grayish-orange, thus giving the appearance of slightly larger eyes (Florida Museum of Natural History 2005). Ecologically, both species prefer some of the same host anemone species (Heteractis magnifica; Stichodactyla gigantean; S. mertensii) (Fautin and Allen 1997; Timm et al. 2008). Of noted difference is that these two species have an allopatric distribution, meaning their ranges do not overlap. Amphiprion percula is found in northern Queensland and Melanesia; A. ocellaris is found in the Andaman and Nicobar Islands (Andaman Sea), Indo-Malayan Archipelago, Philippines, northwestern Australia, and the coast of Southeast Asia northwards to the Ryukyu Islands of Japan (Fautin and Allen 1997; Timm et al. 2008). Genetically, the two species appear to have diverged between 1.9 and 5 million years ago (Litsios et al. 2012; Nelson et al. 2000; Timm et al. 2008). In the aquarium trade, A. ocellaris is the most popular anemonefish with A. percula the second most popular (Animal-World 2015). The two species are often mistaken for one another and misidentified in the aquarium trade. They are also often reported as a species complex (i.e., reported as A. ocellaris/percula) in trade documentation and scientific research due to the difficulty in distinguishing between the two species. Even though their ranges do not overlap, source countries often catch and/or culture one or both species, exporting both wild- captured and captive bred individuals. 2.2.   Habitat   Amphiprion percula is described as a habitat specialist due to its symbiotic association primarily with three species of anemone: Heteractis crispa, H. magnifica, and Stichodactyla gigantea (Fautin and Allen 1997; Elliott and Mariscal 1997a; Ollerton et al. 2007). The species has also been reported as associating with S. mertensii (Elliott and Mariscal 2001) and S. haddoni (Planes et al. 2009). As described in more detail below in the Geographic Range section, anemone habitat for A. percula is spread throughout northern Queensland (Australia), the northern coast of West Papua, northern Papua New Guinea (including New Britain), the Solomon Islands, and Vanuatu (Rosenberg and Cruz 1988; Fautin and Allen 1997; De Brauwer 2014) (See Figure 2).
  • 10. 10     Anemones and their symbiotic anemonefish inhabit coral reefs and nearby habitats such as lagoons and seagrass beds. Although Fautin and Allen (1992, 1997) estimate that as many anemone hosts and symbiotic fish live on sand flats or other substrate surrounding reefs as live on the reef itself, the symbiotic pairs are thought of as reef dwellers because most diving and observations occur on reefs. Both symbionts reside in shallow coastal waters primarily in depths of 1-12 meters (m) (though the anemones can be found in depths up to 50 m) and water temperatures ranging from 25-28 ºC (77-82 ºF) (Fautin and Allen 1997; Randall et al. 1997). Two anemone species, including one A. percula host (H. crispa), and two species of symbiotic anemonefish have been reported from mesophotic depths (>50m) in Australia (Bridge et al. 2012). Although anemonefishes have been the subject of considerable scientific research, less is known about the population dynamics or biology of the giant anemones that serve as their hosts. (Anemones and giant anemones are used interchangeably here and in the literature; several individual anemones may cluster together, forming what appears as a giant individual (Fautin and Allen 1997).) There are over 1,000 anemone species but only 10 of them are known to be associated with anemonefish. As described by Fautin and Allen (1992, 1997), giant anemones have a lower end known as the pedal, which attaches firmly to a solid object like a coral branch or rock. The opposite, unattached end is the mouth, or oral disc. Hollow tentacles emerge from the oral disc and come in varying shapes, lengths, sizes, and colors. Microscopic, single-celled algae known as zooxanthellae live within the tentacles and oral disc and provide energy to the anemone through photosynthesis. Microscopic nematocysts, or stinging cells, are found on the tentacles and internal structures and are used for defense and to capture prey (Fautin and Allen 1997). Acting like microscopic harpoons or needles, nematocysts mechanically sting prey. Nematocyst toxins cause pain, loss of muscular coordination, paralysis, and tissue damage (Mebs 1994, 2009). Prey items include plankton, small fish, sea urchins, and crustaceans such as shrimp and crabs. The mucous coating of giant anemones also contains cytolytic poisons, which are lethal at dilute concentrations to most fish (Mebs 1994, 2009). Relatively little is known about reproduction in giant anemones. Male and female H. crispa anemones synchronously broadcast spawn sperm and eggs into the water column a few nights each year (Scott and Harrison 2007a). After spawning, fertilized eggs become ciliated planula larvae and become motile within 36 hours (Scott and Harrison 2007b). The larvae disperse for 4-12 days (Scott and Harrison 2007b, 2008) before settling in appropriate habitat. High mortality is likely associated with this larval stage, as is common with broadcast spawning species, although dispersal distances and mortality rates have not been examined for any giant anemone species (Thornhill 2012). In addition to reproducing sexually, H. magnifica is also able to reproduce asexually, whereby a polyp divides and becomes two polyps within the space of a few days. Each of the two smaller individuals continues to grow before dividing again (Fautin and Allen 1997). It is unknown which form of reproduction (i.e., sexual vs. asexual) is more common. Giant anemones are likely slow growing and very long lived, living decades to several centuries (Fautin 1991; Fautin and Allen 1997). To be a viable host for anemonefish, an anemone must be of a sufficient size to provide shelter and protection from predators. The long-term growth rate and survival of anemones is correlated with the size and number of anemonefish they host, which provide protection for the anemone from predators (Porat and Chadwick-Furman 2004) among
  • 11. 11     the other benefits listed below. As for locomotion, anemones are typically settled at their location, though if conditions are unfavorable, they are able to use their pedal disc to move a few millimeters a day, or may detach entirely and roll or be carried a longer distance via water currents (Fautin and Allen 1997). The symbiosis between A. percula and its host anemones serves as an effective anti-predation measure for both symbionts. Clownfish, including A. percula, are a unique group of fish that can live unharmed among the stinging tentacles of anemones. A thick mucus layer cloaks the fish from detection and response by anemone tentacles (Rosenberg and Cruz 1988; Elliott and Mariscal 1997a, 1997b). Species that lack this physiological adaptation are immobilized by stinging tentacles and consumed by the anemone. Thanks to this symbiotic association and protection from their host anemones, adult A. percula have very few predators. Predators of both anemones and anemonefish are deterred by the anemone’s stinging tentacles and by the presence of territorial clownfish. In return, anemonefish swim through and create fresh water circulation for the stationary anemone, allowing it to access more oxygenated water, speed up its metabolism, and grow faster (Szczebak et al. 2013). Anemonefish also fertilize host anemones with their ammonia-rich waste (Roopin and Chadwick 2009; Cleveland et al. 2011)), leading to increases in anemone growth and asexual reproduction (Holbrook and Schmitt 2005). At most geographic locations where anemonefish populations have been studied, all or most anemones are occupied by anemonefish (Mariscal 1970; Allen 1972; Fautin 1985, 1992; Ochi 1986; Hattori 1995; Elliott and Mariscal 2001). Unoccupied anemones are typically either very small or in shallow water (Elliott and Mariscal 2001) (~<1 m), presumably due to the potential for lower salinity, increased temperatures, and exposure at low tides. Typically, only one species of anemonefish occupies a single anemone at any given time due to niche differentiation; but this is not always the case. Elliott and Mariscal (2001) studied anemone use by anemonefish in the region of Madang, Papua New Guinea, which has the highest reported species diversity of both anemonefish (9 species) and their host anemones (10 species). Of 72 anemones occupied by A. percula, 4 also hosted other anemonefish species (Elliott and Mariscal 2001). As a demonstration of further niche differentiation, both A. percula and A. perideraion occupied H. magnifica anemones, but A. percula occupied the H. magnifica individuals in nearshore zones, while A. perideraion occupied H. magnifica in offshore zones. Amphiprion percula is a highly territorial species, likely due to intense competition for limited resources, with niche differentiation caused by the distribution, abundance, and recruitment patterns of competing species (Fautin and Allen 1997; Elliott and Mariscal 1997a, 2001; Randall et al. 1997). Once anemonefish settle into a host, they are unlikely to migrate between anemones (Mariscal 1970; Elliott et al. 1995). 2.3.     Diet,  Feeding,  and  Growth   Anemonefish are omnivorous and feed on a variety of prey items consisting of planktonic algae and zooplankton, such as copepods and larval tunicates (Fautin and Allen 1997). Amphiprion percula also feeds on prey remnants left over from its host anemone’s feeding activity and dead tentacles from its host (Fautin and Allen 1997; Florida Museum of Natural History 2005). An anemone will typically host a female and male breeding pair and up to four other subordinate, non-breeding and non-related percula clownfish (Buston 2003a; Buston and Garcia
  • 12. 12     2007; Buston et al. 2007). Individuals rarely stray beyond the periphery of their anemone’s tentacles to feed (Buston 2003c). A size-based hierarchy develops within each group; the female is the largest (rank 1), the male second largest (rank 2), and the non-breeding males get progressively smaller as you descend the hierarchy (ranks 3-6) (Allen 1991). Subordinates tend to be 80% of the size of their immediate dominant in the hierarchy (Buston 2003b; Buston and Cant 2006). Subordinates likely regulate their growth to avoid coming into conflict with their immediate dominant, and thereby avoid eviction from the social group (Buston 2003b; Buston and Wong 2014). When a fish is removed from the hierarchical social group structure (due to mortality or collection), all smaller members grow rapidly, filling in the size gap, to the point that they are once again 80% the size of their immediate dominant (Fautin and Allen 1997; Buston 2003b). 2.4.     Reproduction  and  Development   Spawning for A. percula can occur year round due to perpetually warm waters within the species’ range (Fautin and Allen 1997). Spawning is also strongly correlated with the lunar cycle, with most nesting occurring when the moon is full or nearly so (Fautin and Allen 1997). Like all anemonefishes, all A. percula are born as males (Fautin and Allen 1997). Females develop through protandrous hermaphroditism, or sex change from male to female. This occurs when the female and largest member of the group dies (or is otherwise removed) and the next largest male changes sex to become the dominant breeding female. The second largest male subsequently becomes the dominant male (Rosenberg and Cruz 1988; Fautin and Allen 1997). Only the dominant pair contributes to the reproductive output of a group within an anemone. Non-breeders within the social group do not have an effect on the reproductive success of mating pairs (Buston 2004; Buston and Elith 2011). Within a social group, the rate of development from juvenile to adult and male to female is highly dependent on the mortality rates of individuals within the group (Fautin and Allen 1997; Buston 2004b). In other words, the larger the group size (up to six individuals), the longer an individual fish could remain as a sub-adult male (i.e., subordinate to the breeding female and male pair). Courtship   Adult male and female A. percula form strong monogamous pair-bonds. Initiation of ritualized courtship is highly correlated with the lunar cycle (Fautin and Allen 1997) and typically commences three to five days prior to spawning. Social interaction increases noticeably during courtship and includes chasing and dorsal fin erection (Fautin and Allen 1997). During this time, the female’s belly begins to swell with eggs (Animal-World 2015). Courtship also includes preparation of the nest site, which is important for survival of the eggs. This is done by the mating male through nipping at the host anemone’s tentacles in order to create a flat patch of rock located under the anemone (Rosenberg and Cruz 1988; Myers 1999), and using his mouth to clear any algae or debris (Fautin and Allen 1997; Buston and Elith 2011). Spawning   Once the female is ready to spawn, a conical whitish tube known as an ovipositor becomes visible and eggs slowly descend from her belly onto the nest site. Once eggs are laid, the male follows closely behind and fertilizes them externally. Spawning can last anywhere from 30 minutes to 2 hours (Fautin and Allen 1997; Dhaneesh et al. 2009). Clutch sizes vary widely between 100 to over 1000 eggs (Fautin and Allen 1997; Dhaneesh et al. 2009), with the average
  • 13. 13     being 324 eggs ± 153 (mean ± one standard deviation) recorded in Madang Lagoon, Papua New Guinea (Buston and Elith 2011), depending on fish size and previous experience. Larger and more experienced mating pairs will produce more eggs per clutch (Fautin and Allen 1997; Buston and Elith 2011; Animal-World 2015), and can produce up to three clutches per lunar cycle (Gordon and Hecht 2002; Buston and Elith 2011). Buston (2004) reports 12 years as the typical expected tenure of breeding females in the field. While this is relatively long for a fish species of this small size, it is not unheard of among reef fish species (e.g., 13 years for A. clarkii (Moyer 1986); 18 years for A. frenatus and 18+ years for A. perideraion (Fautin and Allen 1997)). Reports of clownfish in captivity conclude that clownfish cease spawning several years before the end of their life expectancy (Animal-World 2015), but it is unknown if this is also the case in the wild. Development   After egg deposition has finished, a 6-8 day incubation period begins, with developmental rate varying with temperature and oxygen content of the water (Dhaneesh et al. 2009). Eggs are adhered to the nest surface via short filaments (Fautin and Allen 1997; Dhaneesh et al. 2009) and are attended to by the male. The male aerates the nest with his mouth and fans the eggs with his pectoral fins (Fautin and Allen 1997; Dhaneesh et al. 2011). The male also removes dead eggs and debris from the nest, ensuring ample oxygenation. Though the overhanging tentacles of the anemone provide some protection (Allen 1991; Arvedlund et al. 2000), the male fiercely guards the eggs against potential predators (Rosenberg and Cruz 1988). The most common egg predators during the day are Pseudochromis fuscus wrasses (family Labridae) and other damselfishes (family Pomacentridae); nighttime predators are typically not fish, but invertebrates such as brittle stars (families Ophiotrichidae, Ophiochimidae, and Ophiodermatidae) (Arvedlund et al. 2000 citing D.R. Bellwood, pers. comm.). During this period of male parental care, the female is occupied with feeding activity (Fautin and Allen 1997). As eggs continue to incubate over the course of a week, embryos become visible through a transparent membrane. Silvery pupils contained within large eyes and red-orange yolk sacs are two noticeable features during development (Buston and Elith 2011). Average hatch success recorded in Madang Lagoon, Papua New Guinea, is estimated at 87% (Buston and Elith 2011). Upon hatching, which typically occurs in the evening, larvae are 3-4 mm in length (Fautin and Allen 1997; Gordon and Hecht 2002; Dhaneesh et al. 2009). They initially sink to the benthic environment before swimming to the upper surface of the water column using a process called phototaxis where moonlight helps to orient them (Fautin and Allen 1997). Larvae then enter a pelagic phase and are likely engaged in active swimming and orientation, and also transported by ocean currents (Fautin and Allen 1997; Leis et al. 2011). 2.5.   Settlement  and  Recruitment   The larval stage of A. percula ends when the larval anemonefish settles into a host anemone approximately 8-12 days after hatching (Fautin and Allen 1997; Almany et al. 2007; Buston et al. 2007). Compared to many other coral reef species, this is considered a short pelagic larval duration, though is typical of genera restricted to the Indo-Pacific (Wellington and Victor 1989; Almany et al. 2007). The likelihood of successful recruitment depends on anemone saturation and habitat type (Buston 2003c; Dixson et al. 2008; Elliott and Mariscal 2001). Buston (2003c) showed that removal of non-breeders resulted in recruitment of new individuals within a few months. Under natural conditions, populations are close to carrying capacity and resident A.
  • 14. 14     percula prevent recruitment of new individuals; when residents are removed, new individuals recruit. Like most reef fish species, the egg, pelagic larval, and settlement life stages for A. percula experience the highest rates of natural mortality (there may be only one successful recruit for every 10,000 eggs produced – Peter Buston pers. obs.). Once they gain the protection of an anemone, mortality is greatly reduced. Anemonefishes search for and settle into a suitable host anemone using a variety of cues. Dixson et al. (2008, 2014) and Munday et al. (2009a) found that A. percula are attracted to olfactory cues such as leaf litter and tropical trees, a means of locating island reef habitats, when searching for a settlement site. Amphiprion percula are also attracted to unrelated conspecific adults (Munday et al. 2009a). Embryos and newly hatched juveniles may learn cues from the host anemone where they hatched and respond to imprinted cues when searching for suitable settlement locations (Fautin and Allen 1997; Arvedlund et al. 2000; Paris et al. 2013; Dixson et al. 2014; Miyagawa-Kohshima 2014). Innate recognition is also used and refers to the ability of anemonefish to locate a suitable host without prior experience (Fautin and Allen 1997; Miyagawa-Kohshima 2014). Studies indicate that imprinting on anemone olfactory cues complements innate recognition, leading to rigid species-specific host recognition (Miyagawa- Kohshima 2014). Fish acclimation to a host anemone lasts anywhere from a few minutes to a few hours (Fautin and Allen 1997; Arvedlund et al. 2000) and is accomplished by briefly touching the tips of the tentacles with pectoral fins. At first there is an adhesive effect and the fish typically flees the anemone but then continually returns, making progressively more contact until tenticular clinging no longer occurs due to a protective mucus coating that develops on the anemonefish (Davenport and Norris 1958; Elliott and Mariscal 1997a). Once acclimated, the mucus protection may disappear upon extended separation between host and fish. Continued contact with tentacles appears to reactivate the mucus coat (Arvedlund et al. 2000). Coloration of anemonefish usually also begins during this anemone acclimation process (Elliott and Mariscal 2001). Upon settlement, the entire metamorphosis from larva to juvenile takes about a day (Fautin and Allen 1997). 2.6.     Longevity  and  Resilience   Fautin and Allen (1992, 1997) reported that some anemonefish are recorded to have lived at least 6-10 years in nature, with 18 years the record in captivity. More recently, Buston and Garcia (2007) studied a wild population of A. percula in Papua New Guinea and their results suggest that females can live up to 30 years in the wild (lower 95% CI = 22.0 years, upper 95% CI = 89.9 years), although this life expectancy estimate has not been empirically proven through otolith examination. This estimate is notably two times greater than the longevity estimated for any other coral reef damselfish and six times greater than the longevity expected for a fish that size (Buston and Garcia 2007). Their results are consistent with the idea that organisms subject to low levels of extrinsic mortality, like anemonefish, experience delayed senescence and increased longevity (Buston and Garcia 2007). For individuals that move up in social rank to eventually attain the female position, remaining life span or time spent as a female does not vary with group size. The amount of time spent queuing to attain the female position, however, does vary with group size, which leads to the variable overall life expectancy of a female based on group size (Buston and Garcia 2007).
  • 15. 15     As noted above, post-recruitment mortality associated with predation is quite low, ranging from 2% (Elliott and Mariscal 2001) to ~7% for ranks 1-3 and ~30% for ranks 4-6 (Buston 2003a), especially compared to other coral reef fish. This is likely attributable to the amount of protection provided by host anemones (Buston 2003a). Social rank appears to be the only factor associated with mortality of the species post-settlement rather than factors such as number of individuals, density, standard length, anemone diameter, depth, or reef size (Buston 2003a, 2003b). Competition for rank amongst individuals within an anemone can lead to eviction of subordinates. Buston (2003a) speculated that individuals probably compete for rank because it confers access to reproduction, and not because it confers access to food or shelter. Using a methodology designed to determine resilience to fishing impacts, Fishbase.org rates A. percula as highly resilient, with an estimated minimum population doubling time of less than 15 months (Florida Museum of Natural History 2005; Fishbase.org 2015). Another analysis, using the Cheung et al. (2005) “fuzzy logic” method for estimating fish vulnerability to fishing pressure, assigned A. percula a low vulnerability score, with a level of 23 out of 100 (Fishbase.org 2015). Fujita et al. (2014) analyzed data deficient marine aquarium trade species, although they did not include A. percula. Using a recently developed semi-quantitative methodology known as the productivity susceptibility analysis (Patrick et al. 2010), A. ocellaris and A. clarkii were assessed and both were rated as highly vulnerable due to their low productivity and high susceptibility to capture for the aquarium fishery. While this is informative, it is difficult to determine if these results are indicative of the status of A. percula as well due to several important differences including the species’ range and levels of exploitation in countries where they occur. While all of these analyses are specific to the threat of fishing pressure (which is not the only threat facing A. percula), they assess the life history characteristics of the species (or similar species) and determine how those characteristics may affect its response to population reduction, which is informative in the case of sources of mortality besides fishing pressure. As such, we consider the species-specific results to be reliable indicators of the species’ resilience overall. 2.7.     Geographic  Range   Clownfish first appeared and diversified in the Indo-Australian Archipelago (Litsios et al. 2014). The orange clownfish is native to the Indo-Pacific region (Rosenberg and Cruz 1988), from 6º S - 26º S, 141º E - 155º E. Range countries include northern Queensland (Australia), the northern coast of West Papua, northern Papua New Guinea (including New Britain), the Solomon Islands, and Vanuatu (Rosenberg and Cruz 1988; Fautin and Allen 1997; De Brauwer 2014) (see Figure 2). There are reports of A. percula occurring beyond these areas, including in the Andaman and Nicobar Islands off southeast India (Madhu and Madhu 2006); Tomini Bay in Sulawesi, Indonesia (Kuiter and Tonozuka 2004, cited by Timm et al. 2008); Cocos (Keeling) Islands and Christmas Island in the eastern Indian Ocean; Fiji; Micronesia; and as far north as the Ryukyu Islands in the East China Sea (Thornhill 2012). However, these reports are most likely cases of misidentification of A. ocellaris (Maarten De Brauwer, pers. comm. 2015), or indicative of a potential third, cryptic species in the species complex that has yet to be described. Phylogenetic analysis from Timm et al. (2008) shows that specimens from Tomini Bay (Sulawesi, Indonesia) belong to the A. percula clade, but were genetically distinct from A. percula sampled within the known range of the species at the sub-clade level. These results
  • 16. 16     suggest the possibility of a third, cryptic species present within the A. ocellaris/percula species complex, which is not concordant to the current taxonomy. More genetic analyses are required to determine whether the range of A. percula is more extensive than what has been described previously or if a third cryptic species does exist. The existence of a third species would not affect our analyses here as we have not considered the geographic area where this third species might exist to be part of the range of A. percula. If further genetic research indicates there is no third species and the range of A. percula extends beyond what we have analyzed here, we could consider our conclusions to be conservative underestimates of range size and abundance. For the purposes of this analysis, we did not speculate as to which scenario is more likely; rather, we used the best available scientific and commercial information to determine the species’ current range. Figure 2: Range map for A. percula based on Fishbase.org, Timm et al. 2008, and De Brauwer 2014, also showing coral reef areas from Burke et al. 2011. Overall, the area of coral reef habitat within the range of A. percula, based on satellite imagery and classification, is estimated between 36,000 km2 and 50,000 km2 (Burke et al. 2011; De Brauwer 2014 citing Fautin and Allen 1992 and Spalding et al. 2001). We are unable to provide an estimate of the non-coral reef habitat within the species’ range including sandy patches between patch reefs, parts of lagoons, and seagrass beds. As such, the likely area where A. percula occurs is actually much greater and thus the estimated area is likely an underestimate. 2.8.   Distribution  and  Connectivity   Distribution  within  Reef  Habitats   The distribution of suitable host anemone species essentially dictates the distribution of A. percula within its habitat (Elliott and Mariscal 2001). Although competition with other anemonefish species may lead to finer-scale niche differentiation as previously described.
  • 17. 17     Heteractis crispa, H. magnifica, and S. gigantea range throughout and beyond A. percula’s geographic extent. Stichodactyla haddoni occurs in Australia and Papua New Guinea, but has not yet officially been recorded in Vanuatu or the Solomon Islands, and S. mertensii officially has been recorded only from Australia within A. percula’s range (Fautin and Allen 1997; Fautin 2013). However, two recent observations extended the known distribution of S. haddoni, both northward and southward, indicating they have the ability to expand in range and facilitate the expanded occurrence of commensal species (Hobbs et al. 2014; Scott et al. 2014). Anecdotally, there are photo images and video footage of S. haddoni and S. mertensii in the Solomon Islands, Vanuatu, and Papua New Guinea (e.g., Shutterstock (Vanuatu, Solomon Islands), National Geographic (Solomon Islands), and Getty Images (Papua New Guinea)). Species experts, however, have not officially confirmed these reports. Although geographically widespread, anemone species differ in their preferred habitat (e.g., reef zonation, substrate, depth (Fautin 1981)). Hattori (2006) found that H. crispa individuals were larger along reef edges and smaller in shallow inner reef flats. The larger anemones on reef edges experienced higher growth, probably because deeper (up to 4 m) reef edges provide more prey and lower levels of physiological stress. The author speculates that habitat and depth ideal for high anemone growth will vary by study site and occur at depths where there is a balance between available sunlight to allow for photosynthesis and low physiological stress, both of which are dependent on site-specific environmental conditions. Elliott and Mariscal (2001) found that coexistence of multiple clownfish species in close proximity is possible because of differences in their host anemone preference and differences in their habitat utilization. For example, in Madang, Papua New Guinea, both A. percula and A. perideraion primarily occupied H. magnifica hosts, but A. percula dominated H. magnifica in the nearshore zone while A. perideraion dominated in the offshore zone. It is difficult to generalize the likely distribution, abundance, and trends of anemone hosts throughout the range of A. percula; these parameters are likely highly variable across the species’ range. In an assessment done throughout the Great Barrier Reef, anemones, including those that host A. percula, were quantified as “common” (Roelofs and Silcock 2008). On the other hand, Jones et al. (2008) and De Brauwer et al. (in prep) note that anemones occur in relatively low densities throughout their range. Based on the available information, it is difficult to generalize the likely distribution of anemones, and therefore A. percula in coral reef environments throughout its range; it is likely to be variable and dependent on local environmental conditions. At least one study indicates that A. percula may prefer nearshore or shallower habitats (Elliott and Mariscal 2001). Dispersal  and  Connectivity   Because orange clownfish are unable to migrate from one coral reef to another during their adult life stage, dispersal between reefs is limited to the species’ approximately 8-12 day pelagic larval stage. There is support that simply having a pelagic larval phase can lead to some degree of long-range dispersal for species (Saenz-Agudelo et al. 2012; Treml et al. 2012). Pelagic larval duration is likely to be a strong predictor of dispersal distances (Shanks et al. 2003), although no direct evidence exists where both dispersal distance and pelagic larval duration have been measured. On the other hand, in a review of research on connectivity on coral reefs, Jones et al. (2009) conclude that variation in self-recruitment estimates within fish and coral species is more likely influenced by geographic isolation and spacing of reefs than pelagic larval duration, a
  • 18. 18     conclusion supported by Pinsky et al. (2012). Williams and Hastings (2013) highlight the significance of temporally variable fluid dynamic processes leading to stochastic dispersal events for marine organisms. Despite evidence correlating pelagic larval duration with dispersal distance, it has typically been a poor predictor of genetic similarity (Bay et al. 2006; Bowen et al. 2006; Weersing and Toonen 2009) and genetic population structure (Bay et al. 2006; Bowen et al. 2006; Luiz et al. 2012). Because small pelagic larvae are extremely difficult to track in the open ocean, population genetics is a useful technique to evaluate gene flow and connectivity between populations of coral reef associated organisms. Measuring self-recruitment rates in particular helps us to understand small scale connectivity in meta-populations of reef fish like A. percula. Using larval tagging, Almany et al. (2007) estimated that 60% of larvae they tagged around Kimbe Island, Papua New Guinea were spawned at Kimbe Island (self-recruiters) and the remaining 40% of tagged larvae were from reefs outside the study area, the closest of which is 10 km away. Using genetic parentage analysis, Planes et al. (2009) documented 42% self-recruitment for A. percula at Kimbe Island and found that the Kimbe Island population produced larvae that successfully dispersed to other populations 15-35 km away, revealing significant demographic connectivity. Based on these data (Planes et al. 2009), Buston et al. (2012) found the probability of successful dispersal between populations decreasing fivefold over 1 km of distance from a natal site. In yet another study, a total of 110 juvenile orange clownfish collected on Kimbe Island were screened, again using genetic parentage analysis; 46 were assigned to parents on Kimbe Island (“self- recruiters”) and the remaining 64 were classified as “immigrants” that arrived from another reef at least 10 km away (Berumen et al. 2010). Overall, while A. percula dispersal between reef groups in Kimbe Bay appears variable over time (Berumen et al. 2012), the above studies’ findings consistently indicate that self-recruitment around Kimbe Island ranges from 42-60%, and there exists significant connectivity at the scale of 10s of km for A. percula. Anemonefish larvae possess significant locomotory and sensory abilities that may help them avoid dispersal away from the sensory halo of Kimbe Island (Fisher et al. 2000; Dixson et al. 2008); however, other factors, presumably including local current patterns, must also influence larval dispersal, to some degree (Berumen et al. 2012). While A. percula populations in Kimbe Bay have been well studied, it is unclear how representative these results may be of other areas within the species’ range. In addition to the density of A. percula likely being highest in Kimbe Bay and nearby areas, aspects of the geographical setting that influence dispersal will also vary among sites across the species’ range, leading to variable levels of self-recruitment. Research on congeners of A. percula has revealed similar variability in levels of self-recruitment at different locations. For example, along 28 km of coastline near Port Moresby, Papua New Guinea, study results showed highly variable levels of self-recruitment of A. polymnus among sites, but overall low observed self-recruitment rates, a high proportion of connectivity among sites, and a relatively high proportion of long-distance dispersal. This led to the conclusion that connectivity, not self-recruitment, dominates larval replenishment in this focal clownfish meta- population (Saenz-Agudelo et al. 2011). The authors noted that differences in self-recruitment rates among sites within the meta-population were likely linked to different localized geographies that affect access and proximity to alongshore current flows (Saenz-Agudelo et al. 2011). In contrast, Jones et al. (2005) found high levels of self-recruitment for A. polymnus at sites within Kimbe Bay, which supports the notion that the level of self-recruitment in a meta- population likely depends on the level of geographic isolation. Another congener, A. melanopus,
  • 19. 19     was included in a list of species studied on the Great Barrier Reef and found to have generally high genetic diversity that did not differ significantly among species and locations (Bay et al. 2006). Additionally, genetic parentage analysis of A. bicintus in the Red Sea found minimal to no self-recruitment in two consecutive years, indicating a virtually open population over several kilometers (Nanninga 2013). Moreover, van der Meer et al. (2012) report 68-84% self- recruitment at three island marine protected areas in Australia for the endemic A. mccullochi, while self-recruitment for A. ocellaris and A. perideraion ranged from 44-65% among sites and sampling periods in the Spermonde Archipelago, Indonesia (Madduppa et al. 2014). The variability in self-recruitment rates among these species and populations is likely to be driven by the variable nature of the geographical settings of the different study locations. In well- connected populations, self-recruits are diffused by immigrants; the opposite is true for geographically isolated populations that tend to show higher rates of self-recruitment. On a larger geographic scale, Treml et al. (2012), hypothesize that broad-scale connectivity is strongly influenced by reproductive output and length of pelagic larval duration based on a biophysical model of larval dispersal. However, there are limitations to this approach when considering species that actively swim during their pelagic larval phase, like some anemonefish, rather than passively disperse. This is evidenced by the fact that, for several clownfish species, there have been conflicting results regarding whether regional ocean currents are a good predictor of phylogeographic structure and, therefore, whether such passive dispersal modeling based on ocean currents is informative. For example, Nelson et al. (2000) mapped the phylogeography of A. ocellaris across its range and found that surface ocean currents in the region, which should influence larval dispersal, were poorly correlated with phylogeographic structure. Instead, A. ocellaris phylogeography is more reminiscent of Pleistocene sea level changes and flooding of the Sunda shelf. Omani clownfish populations on the other hand, separated by over 400 km, were found to be connected in both directions using genetic assignment tests; this long-distance dispersal matched predictions from a dispersal model based on oceanographic currents, demonstrating that simple physically forced models can give valuable predictions for realized patterns of connectivity in some cases (Simpson et al. 2014). In the absence of a broad-scale phylogeographic study for A. percula, we are left with small- scale meta-population connectivity studies as the best available information. Results from studies in Kimbe Bay, Papua New Guinea, indicate that A. percula have the ability to disperse at least up to 35 km away from natal areas (Planes et al. 2009). In addition, there is evidence that rates of self-recruitment are likely to be linked with not only pelagic larval duration, but also geographical isolation (Jones et al. 2009; Pinsky et al. 2012). Because of the size and distribution of A. percula’s range, there are likely areas of higher and lower connectivity throughout, linked with the variability in geographic isolation across locations, creating significant spatial structure. This is, however, speculative because no large-scale connectivity study has been conducted for this species. Based on the best available information, we consider that the species is likely to have highly variable small scale connectivity among and between meta-populations, but unknown large scale genetic structure across its entire range.
  • 20. 20     2.9.     Estimated  Abundance   Based on the best available information, densities of meta-populations of A. percula are highly variable throughout the species’ range. Densities are highest in the northern region of Papua New Guinea, which has the greatest reported species diversity and densities of both anemonefishes and anemones (Elliott and Mariscal 2001). In Madang, Papua New Guinea, Elliott and Mariscal (2001) estimated the total density of A. percula at approximately 0.79 fish per 100 m2 , or approximately 7,900 individuals per km2 of reef area. In Kimbe Bay, Papua New Guinea, Planes et al. (2009) counted 975 individuals (506 adults and 469 juveniles) in 270 anemones in a 1 km2 area of reef. Density of A. percula is lower at survey locations in the Solomon Islands and Australia than Papua New Guinea sites (Maarten De Brauwer, pers. comm. 2015). De Brauwer (2014) determined an average density for the species within its range from 658 surveys across 205 sites throughout the species’ range. He calculated the global estimated mean density at 0.09 fish per 250 m2 , or 360 fish per km2 . With no existing estimate of global abundance for A. percula, we estimated, based on the best available information a total of 13-18 million individuals for the species throughout its range. Acknowledging that density estimates for A. percula are highly variable throughout the species’ range, we used De Brauwer’s (2014) estimated average density of 360 fish per km2 to derive global abundance. In order to extrapolate this average density to estimate abundance, we used two different estimates of coral reef area within the species’ range. De Brauwer (2014) estimated 36,000 km2 of coral reef area within the species’ range based on Fautin and Allen (1992, 1997) and Spalding et al. (2001). We also used newer coral reef mapping data from Burke et al. (2011; ArcGIS shapefiles of coral reef area provided by K. Reytar) resulting in an estimate of approximately 50,000 km2 of coral reef area within A. percula’s range. We used both values to determine a range of estimated abundance (13-18 million) to reflect uncertainty. It is important to note that this may be an underestimate because it is based on coral reef area, which likely does not account for most of the non-reef area where the species occurs throughout its range. We found no information on historic abundance or recent population trends for A. percula throughout all or part of its range. 3.0.     ASSESSMENT  OF  EXTINCTION  RISK   3.1.     Approach  to  Evaluating  Extinction  Risk   In evaluating extinction risk to the species, we identified the four demographic risk factors suggested by Wainwright and Kope (1999) and McElhany et al. (2000), as well as the threat factors identified in section 4 of the ESA. The four demographic viability risk criteria, considered at the species level include: abundance, growth rate/productivity, spatial structure/connectivity, and diversity. These viability criteria reflect concepts that are well founded in conservation biology and that individually and collectively provide strong indicators of extinction risk. The approach of considering demographic risk factors to help frame the consideration of extinction risk has been used in many status reviews including Pacific salmonids, Pacific hake, walleye pollock, Pacific cod, Puget Sound rockfishes, Pacific herring, scalloped hammerhead sharks and black abalone (see http://www.nmfs.noaa.gov/pr/species/ for links to these reviews). In addition to these factors, we considered the five threat factors listed in section 4(a)(1) of the ESA. Based on all of this information, we describe the likely level of
  • 21. 21     extinction risk faced by the orange clownfish both now and in the foreseeable future (defined below). Because information on the orange clownfish is sparse and often non-quantitative, we used qualitative risk categories to characterize the likelihoods of the four demographic viability criteria significantly contributing to extinction risk: very low, low, medium, high or unknown. In addition, because some threats to the orange clownfish are either poorly understood or unquantifiable, we characterized the relative likelihood (as very low, low, medium, high, or unknown) that threats (confirmed, potential or assumed) are significantly contributing to extinction risk for A. percula. We do not make recommendations as to whether the species should be listed as threatened or endangered. Rather, conclusions are drawn about the overall risk of extinction faced by the species under present conditions and in the foreseeable future based on an evaluation of the species’ demographic risks and threats. Although the orange clownfish is not officially listed under the IUCN Red List of Threatened Species, De Brauwer (2014) assessed extinction risk for all anemonefish species using the IUCN Red List criteria. De Brauwer used multiple methods to calculate values for each criterion (18 methods in total to calculate different values for the 4 criteria) and A. percula was most commonly assigned to the “Least Concern” category. The Least Concern category is used to highlight species that have a relatively low extinction risk compared with those taxa that are assessed as Near Threatened, Threatened, Endangered or Critically Endangered. For De Brauwer (2014), the only scenario where A. percula was conservatively assigned to a higher IUCN risk category (“Endangered”) resulted from one of the methods he used to calculate the area of occupancy. Using this most conservative method to determine area of occupancy to assess risk of extinction for all anemonefish, 20 species could potentially be classified as Endangered and 8 species as Critically Endangered (De Brauwer 2014). Although IUCN Red List criteria differ from how we assess species under the ESA, it is a useful exercise to inform our analysis of A. percula’s risk of extinction. Risk classifications by other organizations, or made under other Federal or state statutes, may be informative, but the classification alone may not provide the rationale for evaluating species status under the ESA. Rather, we evaluate the sources of information on which the classification is based and determine how this information informs our assessment of extinction risk and whether a species meets the definition of threatened or endangered under the ESA. According to the ESA, the determination of whether a species is threatened or endangered should be made on the basis of the best scientific information available regarding its current status, after taking into account efforts being made to protect the species. During the extinction risk assessment, likely or possible effects of conservation measures are taken into account to the extent they are reflected in metrics of population or species viability. Conservation measures that have not yet been implemented or shown to be effective are taken into account in a separate process by NMFS prior to proposing any listing determinations. In the last part of this section, we summarize the conservation efforts that are currently in place that may be benefiting the orange clownfish so that NMFS can consider them before making a listing determination.  
  • 22. 22     3.1.1.    Foreseeable  Future   The term “foreseeable future” is not defined in the ESA. The NMFS guidance for conducting status reviews under the ESA instructs us to interpret this phrase as the timeframe over which predictions about the future conservation status of the species can be reasonably relied upon (NMFS 2013). Those predictions can be in the form of extrapolation of population or threat trends, analysis of how threats will affect the status of the species, or assessment of future events that will have a significant new impact on the species. We consider the life history of the species, habitat characteristics, availability of data, kinds of threats, ability to predict threats, and the reliability of models used to forecast threats over that “foreseeable future” in determining the time period that constitutes the foreseeable future. This approach does not limit the time frame under consideration to the length of time into the future for which a species’ status can be quantitatively modeled or predicted within predetermined limits of statistical confidence, although uncertainties of any modeling efforts should be documented. Because a species may be susceptible to a variety of threats for which different data are available or which operate across different time scales, the foreseeable future is not necessarily reducible to a particular number of years.    Thus, we may describe the foreseeable future in general or qualitative terms. In our consideration of the foreseeable future for this status review, we evaluated how far into the future we could reliably predict the operation of the major threats to this species, as well as the species’ response to those threats. We are reasonably confident in our ability to predict out several decades in assessing all threats listed below and their interaction with the life history of the orange clownfish. We considered generation length to reflect turnover of breeding individuals and account for non-breeding older individuals. Estimates for generation length, which is greater than first age of breeding but lower than the oldest breeding individual (IUCN 2015), of the orange clownfish range between 6 and 15 years. Therefore, we conservatively define the foreseeable future as 30 years from the present, which is based on 2-3 generation lengths as well as the estimated lifespan of the orange clownfish. We note that, while we may have information with which to predict the trajectory of a particular threat into the future for a defined amount of time (e.g., climate projections out to the year 2100), we may lack information on the species’ response to that threat over the same time period, and therefore do not extend the foreseeable future as far as we can predict the trajectory of such a threat. 3.2.     Demographic  Risks   Summarized below are various demographic risks to the viability of A. percula. As mentioned previously, we conducted a qualitative assessment of the overall status of the species using four demographic viability risk criteria: abundance, population growth rate/productivity, spatial structure/connectivity, and diversity. The relative likelihood that each particular demographic factor contributes, or will contribute in the foreseeable future as defined above, in a significant way to extinction risk of the species is summarized at the end of this section (Table 1) according to the following scale: (1) Very low – it is very unlikely that the particular factor contributes or will contribute significantly to risk of extinction; (2) Low – it is unlikely that the particular factor contributes or will contribute significantly to risk of extinction;
  • 23. 23     (3) Medium – it is likely the particular factor contributes or will contribute significantly to risk of extinction; and, (4) High – it is highly likely that the particular factor contributes or will contribute significantly to risk of extinction. (5) Unknown – it is unknown how the particular factor contributes or will contribute to risk of extinction. (Note: The term “significantly” is used here as it is generally defined – i.e., in a sufficiently great or important way as to be worthy of attention.) If there was some uncertainty between two of the qualitative categories for any particular demographic factor, and/or uncertainty in the available information for that factor, we conservatively assigned it to the higher level of likelihood out of the two. 3.2.1.   Abundance   In general, very low levels of a species’ abundance and density may cause difficulty in mate choice; sex-ratios; fertilization and recruitment success; reproductive or courting behaviors; foraging success; and predator avoidance behaviors.    There are no global historical or current abundance estimates for A. percula in the literature. However, we estimate global, wild population abundance for A. percula to be approximately 13-18 million individuals based on De Brauwer (2014) and estimates of total habitat area. We believe this estimate to be a conservative estimate for reasons discussed in section 2.9 above.   Based on our estimate of global abundance and information gleaned from the literature on the reproductive strategy of the species, we determined that the species’ abundance is not so low that it is at risk of extinction due to environmental variation, anthropogenic perturbations or demographic stochasticity. Amphiprion percula’s reproductive strategy is not dependent on finding a mate or affected by sex ratios, so depensatory processes are not of great concern. An abundance of 13-18 million individuals is sufficiently high to provide genetic diversity, which is supported by results from several studies of connectivity for the species (Almany et al. 2007; Planes et al. 2009; Berumen et al. 2012; Buston et al. 2012). We found no evidence that the species is not fulfilling its ecological role due to low abundance in any part of its range. While we acknowledge that there is uncertainty associated with our estimate of population abundance, it was determined based on the best available information (De Brauwer 2014) and is deemed conservative as it does not encompass areas such as seagrass beds known to harbor significant numbers of anemones with anemonefish, especially in Papua New Guinea (Colette Wabnitz, pers. comm. 2015). Overall, the best available information indicates that the estimated current global, wild abundance of A. percula is unlikely to be contributing to the extinction risk of the species. 3.2.2.   Population  Growth  Rate  /  Productivity   Amphiprion percula are estimated to have a minimum population doubling time of less than 15 months (Florida Museum of Natural History 2005; Fishbase.org 2015), and low vulnerability to fishing based on biological and life history parameters (Cheung et al. 2005; Fishbase.org 2015). Natural mortality for juveniles and adults is low, ranging from 2% (Elliott and Mariscal 2001) to ~7% for ranks 1-3 and ~30% for ranks 4-6 (Buston 2003a). The species is also highly productive and can spawn monthly, with an individual laying from 100 to over 1000 eggs during each spawning session, depending on fish size and previous experience (Fautin and Allen 1997).
  • 24. 24     There are currently no data that provide an estimate of how long orange clownfish spawn during their life span. We do not know the recent or historical trend of the global population of orange clownfish and therefore cannot estimate an overall population growth rate or decline. However, their high fecundity in combination with low juvenile and adult mortality and estimated minimum population doubling time of 15 months all indicate that populations are likely to be resilient to periodic disturbances. It is important to note that the suitable number of host anemones, not availability of new anemonefish recruits, is what limits anemonefish populations (Fautin and Allen 1997). This notion is supported by the observation in Madang Lagoon, Papua New Guinea in 1997 that when non-breeders were removed they were rapidly replaced (Buston 2003c), indicating that the population was basically at carrying capacity. We recognize that, based on this limitation, the population growth rate and status of A. percula is very closely linked to the population status of its host anemone species. However, because data on anemones are virtually non-existent, it is difficult to generalize the likely distribution, abundance, and trends of A. percula’s anemone hosts, as described above in section 2.8. We use the best available information to assess threats to host anemones below in section 3.3.1. Based on the conclusion below in section 3.3.1 in combination with the best available information presented here, we determined that population growth rate/productivity of A. percula is unlikely contributing to extinction risk for the species.   3.2.3.   Spatial  Structure  /  Connectivity   We can consider spatial structure for A. percula on different scales and have variable amounts of evidence to inform each level of assessment. As described above, multiple DNA parentage analyses have been conducted in and around Kimbe Bay, Papua New Guinea, that offer some insight into meta-population connectivity for this species in those locations. Self-recruitment rates range from 40% to over 60% (Almany et al. 2007; Planes et al. 2009; Buston et al. 2012). In one study, up to 10% of A. percula larvae were long distance migrants that successfully recruited to reefs up to 35 km away (Planes et al. 2009). This was originally the longest direct measure of larval dispersal distance for any marine fish species reported using the genetic parentage methodology until Simpson et al. (2014) reported Omani clownfish (A. omanensis) migrating over 400 km from their natal origins. It also demonstrates significant demographic connectivity within Kimbe Bay. These results are also consistent with more general biophysical modeling for the tropical western Pacific region, which suggests high levels of connectivity in regions where reefs are only 20-30 km apart, including for species with a wide range of pelagic larval durations (Treml et al. 2008). Connectivity information for congeners that inhabit the same areas and habitat types support the variability reported in self-recruitment and high connectivity of meta-populations (Bay et al. 2006; Saenz-Agudelo et al. 2011; van der Meer et al. 2012; Nanninga 2013; Madduppa et al. 2014; and Saenz-Agudelo et al. 2015). As reported earlier, connectivity and self-recruitment rates for meta-populations are likely based on local geographic settings (Jones et al. 2009) and environmental conditions, which explains the variability between study sites in different locations. On a broader geographic scale, Timm et al. (2008) report that the close relatedness of genetic samples of A. percula from sites in New Britain (Papua New Guinea) and the Solomon Islands could indicate connectivity in a southeast direction, at least historically. However, it remains unclear how closely related individuals from various parts of the species’ range are on a broad
  • 25. 25     scale currently; there may be some dispersal barriers within the range of A. percula of variable strength (Treml et al. 2015). We have insufficient genetic information to identify whether critical source populations exist; this epistemic uncertainty can only be reduced through further research. Amphiprion percula’s spatial structure appears to consist of a series of meta-populations throughout the species’ range that have variable rates of both internal and external connectivity likely linked to varying degrees of geographic isolation. The best available information indicates that at a local scale, A. percula meta-populations experience variable levels of self-recruitment related to geographic isolation but can disperse up to 35 km away from their origins. Globally, however, there is no information available on the overall spatial and genetic structure for the species. Therefore, we conclude that the level to which spatial structure and connectivity is likely to be a factor contributing to extinction risk for A. percula is unknown. 3.2.4.   Diversity   The loss of diversity can reduce a species’ reproductive fitness, fecundity, and survival, thereby contributing to declines in abundance and population growth rate and increasing extinction risk (e.g., Gilpin and Soulé 1986). There is some uncertainty, however, as to whether the loss of diversity by itself confers risk of extinction (see Brook et al. 2002). Although the loss of diversity certainly increases extinction risk through its compounding effects on other demographic factors, it is argued by some that the loss of diversity by itself plays a relatively minor role in extinctions. The loss of diversity can help bring species to a high risk status, but other demographic or environmental factors usually play the direct role in causing extinctions (Lande 1988; Caro and Laurenson 1994; Caughley 1994; Dobson 1999). For A. percula, we found no evidence that genetic diversity is a factor limiting the success of the species and contributing to extinction risk. Meta-populations of this species exhibit variable levels of connectivity that appear sufficient to maintain genetic diversity. Heterogeneity of habitats across the species’ range also likely leads to behavioral or physiological adaptations to local environmental conditions, thereby increasing diversity. Examples may be preference for one anemone species over another, preference for anemones that are nearshore versus offshore, or other local behavioral and/or physiological adaptations. In addition, a mixture of genetic and environmental factors usually causes phenotypic diversity; clownfish species often exhibit geographical color morphs or other phenotypic diversity (Moyer 1976). Militz (2015) reports a broad diversity in color forms for A. percula in Kavieng, New Ireland, Papua New Guinea including variation in the width of the black border along its white bars (also observed by Timm et al. 2008) or “mis-barred” individuals that have some variation in vertical white bars from the norm for the species. Based on genetic and phenotypic diversity exhibited by the species, we conclude that genetic diversity is unlikely to be contributing to extinction risk for A. percula.
  • 26. 26     Table 1. Summary of demographic risk factors for A. percula and relative strength of the evidence indicating these factors are posing an extinction risk for the species. Characterizations of the relative likelihood (very low, low, medium, high, or unknown) that a particular factor is contributing in a significant way to the extinction risk of the species are explained further in the text above. Demographic Risk Likelihood Abundance Low* Growth rate / productivity Low* Spatial structure and connectivity Unknown Diversity Low* *Low means it is unlikely that the particular threat contributes or will contribute significantly to extinction risk for the species. Based on the best available information/data, we assigned a low likelihood to three of the four demographic risk factors because we determined they are unlikely to contribute significantly to extinction risk for A. percula both now and in the foreseeable future. On a local scale, spatial structure and connectivity do not appear to be a cause for concern for this species but, because global genetic structure is unknown, we cannot assign a likelihood that this factor is contributing to extinction risk for A. percula.   3.3.   Analysis  of  the  ESA  Section  4(A)(1)  Factors   According to section 4 of the ESA, the Secretary determines whether a species is threatened or endangered as a result of any of the following five factors: (A) Present or threatened destruction, modification, or curtailment of habitat or range; (B) overutilization; (C) disease or predation; (D) inadequacy of existing regulatory mechanisms; or (E) other natural or manmade factors. Collectively, these five factors are referred to here as “threats.” The following sections provide information on the threats from each of these five factors as they relate to the status of the orange clownfish. The likelihood that each particular threat is contributing to extinction risk for the orange clownfish is summarized at the end of this section (Table 2) according to a qualitative scale: (1) Very low – it is very unlikely that the particular threat contributes or will contribute significantly to risk of extinction; (2) Low – it is unlikely that the particular threat contributes or will contribute significantly to risk of extinction; (3) Medium – it is likely the particular threat contributes or will contribute significantly to risk of extinction; and, (4) High – it is highly likely that the particular threat contributes or will contribute significantly to risk of extinction. (5) Unknown – it is unknown how the particular factor contributes or will contribute to risk of extinction. (Note: The term “significantly” is used here as it is generally defined, the same way it is used under section 3.2 – i.e., in a sufficiently great or important way as to be worthy of attention.) If there was some uncertainty between two of the qualitative categories for any particular threat and/or uncertainty in the future projections or impacts of the threat, we conservatively assigned it to the higher level of concern.
  • 27. 27     3.3.1.   Factor  A:  Present  or  Threatened  Destruction,  Modification  or  Curtailment  of  Habitat   or  Range   Anemone  Bleaching     Amphiprion percula is described as a habitat specialist due to its symbiotic association primarily with three species of anemone: Heteractis crispa, H. magnifica, and Stichodactyla gigantea (Ollerton et al. 2007), although the species has also been reported associating with S. mertensii (Elliott and Mariscal 2001) and S. haddoni (Planes et al. 2009). As habitat specialists, the symbiotic relationship between A. percula and its host anemone makes this species indirectly susceptible to threats that are likely to impact its host anemone. Anemones and their symbiotic anemonefish inhabit coral reefs and nearby habitats such as lagoons, seagrass beds, and sand flats (Fautin and Allen 1997). NMFS recently reviewed and summarized the best available scientific information on the effects of climate change on corals and coral reefs in the final rule listing 20 coral species as threatened (79 FR 53851). In summary, increased ocean temperatures are already affecting coral reef communities worldwide and will continue to do so. While all model results provide evidence that coral reef communities will be negatively affected in the future, the magnitude of those effects varies widely over both spatial and temporal scales. Coral reefs and other nearshore areas are highly heterogeneous habitats that experience yearly, seasonal, daily, and even more frequent fluctuations in environmental conditions. While some models suggest disastrous effects of climate change on coral reefs by the year 2100, such projections are based on spatially coarse analyses associated with high uncertainty, especially at local spatial scales. In addition, the majority of relevant studies use models based on temperature anomalies and thresholds only; however, McClanahan et al. (2015) found that temperature threshold indices had weak or no significant relationship with observed coral cover and susceptibility before, during, and after a major bleaching event. A more comprehensive multiple parameter approach showed significant fit with those field observations, indicating heterogeneous environmental causes and responses to climate disturbances and warming over space and time. Determining the effects of global threats on an individual coral species over the foreseeable future was described in the coral final listing rule as complicated by the combination of (1) uncertainty associated with projected ocean warming and acidification threats; (2) regional and local variability in global threats; (3) large distributions and high habitat heterogeneity of the species; and (4) limited species-specific information on responses to global threats. These complicating factors also apply to determining the effects of future climate change on anemone species that host A. percula. The limited available information for anemones is described below.   Just like corals, anemones have symbiotic relationships with microscopic algae known as zooxanthellae. Because of this symbiosis, they are susceptible to thermally-induced bleaching, during which those symbionts are expelled due to thermal stress (Hill and Scott 2012). Anemone vulnerability to bleaching events is dependent on susceptibility, exposure, and adaptive capacity or response, each of which are influenced by a host of biological and environmental factors, differ across species and locations, and can change over time (Hobbs et al. 2013). Bleaching events may affect host anemone species by causing reductions in abundance of anemone populations and/or a reduction in size of bleached anemones (Hattori 2002; Saenz- Agudelo et al. 2011; Hill and Scott 2012). The degree of impact of such bleaching events varies
  • 28. 28     widely. Following a mass bleaching event off Sesoko Island, Japan, the number of observed H. crispa hosts decreased by over 80% (Hattori 2002). In comparison, near Port Moresby, Papua New Guinea, a bleaching event resulted in the loss of 3 out of 55 S. haddoni and H. crispa anemones and a reduction in size of the bleached anemones by approximately 34% (Saenz- Agudelo et al. 2011). While reductions in size were evident in shallower waters at the Papua New Guinea site, anemones found at depths >7 m were not affected by the bleaching and researchers noted that all remaining impacted anemones recovered full pigmentation two years after the bleaching event (Saenz-Agudelo et al. 2011). Variable impacts to anemonefish assemblages in response to anemone bleaching events have also been reported. These range from the local extinction of one species of Amphiprion due to displacement by another Amphiprion species at one site (Hattori 2002), to only short-term changes in female egg production and recruitment at a different site (Saenz-Agudelo et al. 2011). The evidence described above, while limited, indicates that thermally-induced bleaching can have negative impacts on orange clownfish host anemones, which may lead to localized impacts of unknown magnitude on the fish itself. Evidence thus far indicates high variability in the response of both anemones and anemonefish to localized bleaching events. As noted above, susceptibility to thermal stress varies between different species of the same taxon and is often variable within individual species; as a result of habitat heterogeneity across a species’ range, individuals of the same species may develop in very different environmental conditions. Hobbs et al. (2013) compiled datasets that were collected between 2005 and 2012 across 276 sites at 19 locations in the Pacific Ocean, Indian Ocean, and Red Sea to examine taxonomic, spatial, and temporal patterns of anemone bleaching. Their results confirm that bleaching has been observed in 7 of the 10 anemone species that host anemonefish (including four of the five A. percula host species), with anecdotal reports of bleaching in the remaining 3 host anemone species. In addition, they report anemone bleaching at 10 of 19 survey locations that are geographically widespread. Importantly, they report considerable spatial and inter-specific variation in bleaching susceptibility across multiple major bleaching events (Hobbs et al. 2013). Over the entire timeframe and across all study areas, 3.5% of all anemones observed were bleached, although during major bleaching events, the percentage at a given study area ranged from 19- 100%. At sites within the same study area, bleaching ranged between as much as 0 and 94% during a single bleaching event. To further highlight the variability and uncertainty associated with anemone bleaching susceptibility, Hobbs et al. (2013) report opposite patterns of susceptibility for the same two species at the same site during two different bleaching events. Additionally, the study reports decreased bleaching with increased depth in most of the major bleaching events, indicating that depth, in some cases as shallow as 7 m, offers a refuge from bleaching (Hobbs et al. 2013). Some anemone species have even been reported from mesophotic depths, including one A. percula host species (H. crispa) (Bridge et al. 2012). These depths likely serve as refugia from thermal stress. Although the capacity for acclimation or adaptation in anemones is unknown, evidence from one site indicated that prior bleaching history may influence subsequent likelihood of an anemone bleaching, as previously bleached individuals were less likely to bleach a second time (Hobbs et al. 2013). It is also of note that, similar to corals, bleaching does not automatically lead to mortality for anemones. Hobbs et al. (2013) report variable consequences as a result of bleaching between and among species and locations in their assessment of bleaching for all anemone species that host anemonefish (including those that host A. percula); some species decreased in abundance and/or size after bleaching events, while others showed no effect and recovered fully.
  • 29. 29     When considering the effect of anemone bleaching into the foreseeable future, we evaluated the best available information on future projections of warming-induced bleaching events, but also considered the existing information on the impacts of previous bleaching events on anemones. Evidence suggests that bleaching events will continue to occur and become more severe and more frequent over the next few decades (van Hooidonk 2013). However, newer multivariate modeling approaches indicate that traditional temperature threshold models may not give an accurate picture of the likely outcomes of climate change for coral reefs, and impacts and responses will be highly nuanced and heterogeneous across space and time (McClanahan et al. 2015). Although observed anemone bleaching has thus far been highly variable during localized events, the overall effect of bleaching events on anemones globally (i.e., overall proportion of observed anemones that have shown ill effects) has been of low magnitude at sites across their ranges, as only 3.5% of the nearly 14,000 observed anemones were recorded as bleached across 19 study sites and multiple major bleaching events (Hobbs et al. 2013). The low overall effect thus far, high amount of variability in anemone susceptibility, existence of depth refugia for anemones, evidence of potential acclimation in some species, and the fact that A. percula has been observed in the wild to associate with at least five different species of anemone that have shown different levels of susceptibility to bleaching in different locations and over time, are all factors that, in combination, indicate that A. percula is likely resilient to bleaching impacts that may affect their hosts both now and in the foreseeable future. As such, we conclude that the threat of habitat loss due to anemone bleaching has a low likelihood of contributing to extinction risk for A. percula now or in the foreseeable future. Anemone  Collection     Just like the fish they host, anemones are often collected for the marine aquarium trade. There has been a recent shift in home aquaria from fish-only tanks to tanks that recreate mini-reef environments with the inclusion of live invertebrates and corals, as well as live rock along with tropical reef fish (Murray and Watson 2014). In a survey of 314 home aquarium hobbyists, 39% indicated they have anemones in their tanks (Murray and Watson 2014). Thus far, there has been limited successful aquaculture of anemones for aquaria; Moe (2003) reports the results from a survey of hobbyists, scientists, and commercial breeders indicating several species have been successfully propagated (typically via asexual reproduction), but anemones typically thwart both scientific and hobbyist attempts at captive culture, especially on a large scale. As such, the vast majority of anemone specimens in the trade are currently from wild collection. There is little information available on the amount of collection or trade in wild anemones; none are listed under the Convention of International Trade in Endangered Species of Wild Flora and Fauna (CITES), so import/export of these species does not require CITES documentation, which otherwise might be a source of information about the magnitude of trade. Limited information is available on the impacts of collection to anemone populations in Australia. Jones et al. (2008) surveyed two different regions of the Great Barrier Reef with contrasting disturbance histories to determine the degree to which densities of anemones and anemonefish are driven by bleaching and collection. They found that collection has likely exacerbated the effects of bleaching and other disturbances on anemones in the Keppel Islands region. In contrast, high densities of anemones and anemonefish were recorded in the Far North Queensland region where collection also occurs, but fewer other disturbances have occurred. The authors note that the Keppel Islands region is isolated from other reef areas, which likely affects its ability to recover from disturbances via input from nearby reefs. Amphiprion percula