Design and Analysis of a Robotic Arm for Sheet Metal Handling
1. Design and Structural Analysis
of a Robotic Arm
Gurudu Rishank Reddy
Venkata Krishna Prashanth Eranki
Department of Mechanical Engineering
Blekinge Institute of Technology
Karlskrona, Sweden
2016
Thesis submitted for completion of Master of Science in Mechanical
Engineering with emphasis on Structural Mechanics at the Department of
Mechanical Engineering, Blekinge Institute of Technology, Karlskrona,
Sweden.
Abstract:
Now a days Automation is creating revolution in the present industrial
sector, as it reduces manpower and time of production. Our project
mainly deals around the shearing operation, were the sheet is picked
manually and placed on the belt for shearing which involves risk factor.
Our challenge is designing of pick and place operator to carry the sheet
from the stack and place it in the shearing machine for the feeding. The
reason behind choosing such machine is discussed in the document. We
have gone through different research papers, articles and had observed
the advanced technologies used in other industries for the similar
operation. After related study we have achieved the design of a 3-jointed
robotic arm were the base is fixed and the remaining joints move in
vertical and horizontal directions. The end effector is also designed such
that to lift the sheet we use suction cups were the sheet is uplifted with a
certain pressure. Here we used Creo-Parametric for design and
Autodesk-Inventor 2017 to simulate the designed model.
Keywords:
Autodesk-Inventor 2107, Creo-Parametric, robotic arm, suction cups.
2. 2
Acknowledgements
This work is carried out at the Department of Mechanical Engineering,
Blekinge Institute of Technology (BTH), Karlskrona, Sweden and Signode
India Limited (SIG), Rudhraram, India from February 2016 to October
2016 under the supervision of R.V Jhansi Rao.
We wish to express our sincere gratitude to our industrial
supervisors, Signode India limited, India for their competent guidance and
support throughout the project. We are thankful to our academic and
internal supervisor Prof. Sharon Kao-Walter BTH Sweden for her valuable
support and advice.
We would also like to express our deepest gratitude to the staff
at Signode India limited Mr. Madhu, Mr. Annand and Mr. Prashanth in
particular, for their timely help, support and everlasting patience. And we
would like to thank our beloved Sir. Sravan Kumar from JNTUH
Mechanical department for valuable discussions and support. We are
thankful to SIG in providing us the required equipment and software to
carry out the project.
We are very thankful to our parents for their constant support,
love and care.
Karlskrona, October 2016
Gurudu Rishank Reddy
Venkata Krishna Prashanth Eranki
3. 3
Contents
1 Notation 7
2 Introduction 9
2.1 Project Statement 10
2.2 Background Study 10
2.3 Research Problem 11
2.4 Scope of Implementation 12
2.5 Objectives 12
2.6 Research Questions 13
2.7 Preliminary Discussion 13
2.7.1 Articulated Arm Robots 14
2.7.2 End Effector of the Robot 14
2.8 Related Works 15
3 Design & Drafting 16
3.1 Mechanical Design 17
3.2 Part 1 19
3.3 Part 2 22
3.4 Part 3 23
3.5 Part 4 & Part 5 24
3.6 Pneumatic Cylinders 26
3.7 Assembly 27
3.7.1 Joint 1 (Waist & Shoulder) 27
3.7.2 Joint 2 30
3.7.3 Joint 3 (Elbow) 31
3.7.4 Joint 4 (Wrist) 32
3.7.5 Joint 5 (End Effector) 33
3.8 Dynamic Behaviour of Robotic Arm 35
4 Materials 41
5 Simulation & Analysis 45
5.1 Need for Stress Analysis 45
5.2 Loads & Boundary Conditions 45
5.3 Export to FEA Module 48
5.4 Meshing 51
5.5 Stress Analysis Environment 52
6 Analytical Model 54
4. 4
7 Results & Discussions 56
7.1 Stress Analysis Results 57
7.2 Life Cycles Calculation 67
7.3 Stress-Cycle (S-N Diagram) 72
8 Summary &Conclusions 73
8.1 Validation 74
8.2 Conclusion 76
8.3 Future Works 78
References 79
Appendix 80
A. External Forces Acting on Parts 80
B. Deformations on Parts 82
C. Moment Vs Time Graphs 85
D. The Factor of Safety on Parts 86
E. Von-Misses Stress of Part 5 with CFRP material 88
F. Matlab Code for calculating the Number of Cycles 89
5. 5
List of Figures
Figure 2.3.1: The Prototype of robotic arm (Pick and Place Operator).... 11
Figure 3.2.1: The upper part of Oldham Coupling. ................................... 20
Figure 3.2.2: The shaft and Key of Oldham Coupling. .............................. 21
Figure 3.3.1: The CAD design of Part 2..................................................... 23
Figure 3.4.1: The CAD design of Part 3..................................................... 24
Figure 3.5.1: The CAD design of Part 4 and Part 5. ................................. 25
Figure 3.6.1: The CAD design of pneumatic Cylinder............................... 26
Figure 3.7.1: The CAD design of Joint 1 (Waist and Shoulder). ............... 28
Figure 3.7.2: The CAD design of Joint 2.................................................... 31
Figure 3.7.3: The CAD design of Joint 3 (Elbow)...................................... 32
Figure 3.7.4: The CAD design Joint 4 (Wrist). .......................................... 33
Figure 3.7.5: The CAD design of Joint 5 (End Effector)............................ 34
Figure 3.7.6:The Complete Assembly of Articulated Arm Robot. .............. 35
Figure 3.8.1:The dynamic behaviour of Pneumatic Cylinder. ................... 36
Figure 3.8.2: The Prototype of Robotic Arm in three sections................... 37
Figure 3.8.3: The Top view of Robotic Arm. .............................................. 38
Figure 3.8.4: The Graph between Position vs Time................................... 39
Figure 3.8.5: The flow chart construction of Robotic Arm. ....................... 40
Figure 3.8.6: The Graph between Position vs speed.................................. 41
Figure 3.8.1: The Graph between Strength and Density of the Material... 42
Figure 3.8.2: The Graph between Strength and Relative cost per unit
volume......................................................................................................... 43
Figure 3.8.3:Part-5 assigned with CFRP material. ................................... 44
Figure 5.2.1: The Force acting on the sheet............................................... 47
Figure 0.1: The Export to FEA. .................................................................. 48
Figure 0.2: The Part-5 in Export to FEA. .................................................. 50
6. 6
Figure 0.3: The Output Grapher and Time Series......................................50
Figure 5.4.1: The Joint were the meshing is excited...................................52
Figure 5.4.2: The Meshed Part of FEA. .....................................................52
Figure 7.1.1: The graph between Time (sec) vs Stress of Part 1................59
Figure 7.1.2: The graphs between Time (sec) vs force and moment. .........60
Figure 7.1.3: The stress distribution plot of Part 1. ...................................61
Figure 7.1.4: The Stress distribution of Part 2...........................................62
Figure 7.1.5: The Stress distribution of Part 3 ..........................................62
Figure 7.1.6: The Stress distribution of Part 4...........................................63
Figure 7.1.7: The Stress distribution of Part 5. ...........................................64
Figure 7.1.8: The FOS of Part 5.................................................................66
Figure 7.3.1: The graph between Time (sec) vs Stress (Mpa). ...................72
Figure 8.1.1: The Factor of Safety for Part 2.............................................75
Figure 8.2.1: The position of Shearing Machine in Industry......................77
7. 7
1 Notation
A Area
B Width
D Diameter of Solid Shaft
E Young’s Modulus
H Height
I Moment of Inertia
L Length
M Mass
Q Weight
R Radial Arm
R Radius of Solid Shaft
T Torque acting on Solid Shaft
T Thickness
V Volume
W Load acting on Solid Shaft
Density
8. 8
Abbreviations
CAD Computer Aided Design
CFRP Carbon Fibre Reinforced Plastic
DOF Degrees of Freedom
FANUC Fuji Automated Numerical Control
FEA Finite Element Method
FOS Factor of Safety
KSI Kilo pound per Square Inch
SIG Signode India Limited
RCC Remote Censor Control
9. 9
2 Introduction
The most aged methods of metal engaged procedures are
shearing and bending. These are the basic operations that are performed for
metal working. Shearing is a mechanical operation, cutting of large sheets
of metal into smaller pieces of predetermined sizes. When an operation
completes an entire perimeter forming a line with closed geometry is
known as blanking. Shearing machines are of different types, but a typical
shear generally consists of,
• A fixed bed to which one blade is attached.
• A vertically moving crosshead which mounts on the upper blade.
• A series of hold-down pins or feet which holds the material in
place while the cutting occurs.
• A gaging system, either front, back or squaring arm, to produce
specific work piece sizes.
Shearing operation is generally conducted manually, but it can
be conducted using mechanical, pneumatic and hydraulic means also.
Currently, the operation is performed manually at the industry but at a very
high risk. The raw material is collected by the worker and feeding is done
into the shearing machine manually till the sheet is induced completely into
it. This operation is very hazardous to the personnel performing the
operation. Also, there is a fair chance that automating this process might
speed up the rate of work when compared to the manual execution.
In order to overcome these disadvantages, the entire manual
process in the shearing process is to be automated. In this project, a pick
and place machine is designed to lift the raw material sheets one by one to
the shearing machine. Suction cups are designed as holders for these
machines to hold the metal sheets and place it on the conveyor belt of the
shearing machine. This auto feeding mechanism will be operated by the
sheet guide.
This project undergoes an in-depth study of related topics that are explained
in-detail in the future sections. Our main intension is to design this is entire
manually operated system (picking of sheet from stack to feed) into
10. 10
automation, such that it reduces the risk-factor during feeding operation. On
developing this system, we reduce the time of action performed that leads
to increase in productivity.
2.1 Project Statement
The thesis examines the compelling design of a robotic arm i.e.
a pick and place machine and auto feeding mechanism that improves the
safety of the workers. The main intension of designing this pick and place
machine is there will be no need of manual operation of picking the sheet
form stack to shearing machine and the auto feeding mechanism is a
continuous process were the productivity could be effected.
2.2 Background Study
This project is discussed mainly on Design and structural
analysis of a robotic arm, which reduces the man power and might have a
good effect on production rate. This change can motivate the industry and
academics such that the business of the firm is increased. The development
in automation can reduce the revenue cost and raise in capability of
delivering the services at low cost scaling.
In order to look at the safety of the workmen, we designed a pick and
place operator i.e. a robotic arm and for the feeding mechanism two
pneumatic cylinders are designed. Earlier we have studied about different
feeding mechanisms [1] among those we have designed a new model i.e.
using the pneumatic cylinders pushing the sheet forward through the cutting
blades. In this process the time of feeding is reduced for each sheet.
We have also studied about RCC control for designing the robotic arm[2].
In this the system integrates manipulator position sensor into the robots
control routine. It also gives the robot its ability to interact with nature. So
depending upon these conditions the manipulator makes it more efficient by
providing self-optimisation system. With this self-awareness of the robot
there will be work safety in the environment onsite. Due to this RCC the
efficiency of the manipulator increases. In order to design these RCC model
11. 11
we need to compare with revolutionary symmetric structure and circular
periodic structure, due to this we can achieve low stiffness and material will
remain same. We have consulted automation companies like Fanuc
Automation Solutions, Rexroth Pneumatic cylinders and many other
information sources searching for most reasonable and proper solution.
2.3 Research Problem
In sheet shearing operation, picking of sheet and feeding is
undergoing manually which is time taking and risk factor is involved in it.
So, for the first phase (picking of sheet from stack) we need to avoid that by
using an automotive application i.e. pick and place operator and the auto
feeding mechanism is initiated with two cylinders parallel to the sheet. As
we have discussed above the pick and placer is regulated as a continuous
operation for picking the sheets and placing it on the conveyor belt.
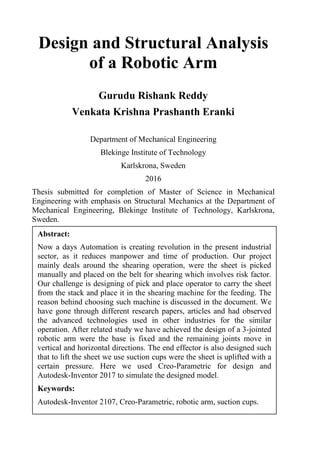
Let us consider the pick and place operator i.e. robotic arm design
Figure 2.3.1: The Prototype of robotic arm (Pick and Place Operator).
12. 12
In the above figure 2.3 we need to consider three links of a robotic
arm as the base is fixed. These three links are connected to each other by a
finge. The link1 is having rotary motion, link 2 is having transient
movement upwards and downwards. The link3 is again a rotary motion.
Towards the end of link3 an end effector is being placed which is stable and
parallel to the feed.
Through this robotic arm, we need to analyse the forces on individual
component and also the complete arm. Now let us consider the free body
diagrams of individual links. The end effector is connected to link3 which
is designed with suction cups to lift the sheet. In this we need to analyse the
static and dynamic properties of the arm. The pressures at vacuum cups is
to be converted to forces and sum of the forces should be greater than the
weight of sheet. The pressure and force relations are to be calibrated for
each and every link and also for the complete arm.
2.4 Scope of Implementation
The basic idea in this project is implementation of robotic
arm. Though it can be implemented in various methods, when different
parameters are taken into consideration this model is the most feasible way
of implementation. Other ways of enactmenting the model is enabling them
to adapt to the surroundings.
2.5 Objectives
Designing, Modelling and Simulation of the pick and place
mechanism. We need to have a time study between currently
undergoing manual operation and newly designed automated
operation.
The frequency of this operator, it’s repeatability, lifetime etc. are to
be found out.
The choice of the end effector, it’s design and analysis should be
carried out and documented.
13. 13
2.6 Research Questions
• How can we automate the process of feeding the metal sheet into
the shearing machine?
• How can we design the pick and place robot to meet the
requirements of the shearing operation?
2.7 Preliminary Discussion
Before designating about the pick and place operators, we
have undergone various methods like use of conveyor belt, pulleys and
other simplified mechanisms for this operation. But after a broad search and
enquiry, we decided to design an articulated robotic system that makes the
entire process more flexible and easier in inducing the mechanism without
any employee payload. The reason for selecting only this particular robot as
a solution depends upon many factors. The very first one is, these sheets get
painted and printed one by one and stacked at the end of the printing
process. The transportation of sheets in this process is done using a frame
with suction cups connected to a conveyor belt. The shearing machine is
really close to the stack and the direction of the feed in the shearing
machine is perpendicular to the stack direction. It is really complex and
complicated or in other words not possible to extend the track of conveyor
which is already in use in the printing to deliver the sheet directly into the
feed of shearing machine without stacking. It is because the time of one
cycle of printing and the time of one cycle of shearing operation of are not
same. So these two process cannot be interlinked without stacking the
sheets. Moreover, the space around these two machines is very less to adopt
any other automation technique. So keeping all of these in mind, we came
to a conclusion that an articulated robotic arm can do the job of picking and
placing in the given space and also can correlate these two operations
perfectly.
Our main motive is to reduce the risk factor involved
physically in this operation. So, we took a forward push of designing a
three jointed robotic system with good and malleable end effector to it.
Basically in our study the articulated robots are of rotary joint system, that
can range from two to ten jointed and are mechanized by servo motors.
They are various robotic systems, which could be articulated and non-
articulated. But according to our operation we prepared rotary joint system
14. 14
which is articulated, in this the space consumption is précised as the joints
are supported in chain. The major factors of initiating this system are it is
having a continuous path, acceptable degree of freedom, proper grip, cyclic
rotation, good accuracy and reach, speed control, repeatability and high
resolution.
2.7.1 Articulated Arm Robots
Articulated arm robots are generally used to perform risky,
treacherous and highly repetitive and obnoxious works. This entire system
is controlled by a trained operator using a portable device like a teach
pendant to a robot in order to do its work manually. The main prospective
is not the working of the robot, but how it is to be safeguarded in a regular
usage in the industries. The maintenance depends only on technical
operators, how hazardous the use of the robot system is its environment
conditions, position, initialization requirements, technical errors and other
functions.
While many engineers working on these robot systems they
could be associated with risks in the operation. In this combination they
need to use safeguarding methods like repetition and backup systems and
the entire thing should be monitored by a human operator. As the entire
system is to be controlled by an electric device, they are two controllers’
servo and non-servo. The use of servo controller gives immense feedback
about the robot system and that continually monitors the robot axes which
are correlated with the position, velocity and the entire data is stored in the
robot’s memory. Were as the non-servo controllers do not have the
feedback criteria and the system is controlled through very finite switches.
So, in our case as we need the backup system the servo controller is best to
initiate.
2.7.2 End Effector of the Robot
The end effector is one aspect that what brings the robot
to give adaptable solutions[3]. This device is designed to have a great
connection with the environment, and the working of end effector depends
completely on the robot applications. Basically the end effector is nothing
but a gripper or a device that works according to different applications
15. 15
induced in it and when we consider it to robotic awareness. They are of
different divisions like.
Impactive, Ingressive, Astrictive, Contigutive. These work differently for
different end effectors.
Impactive: - This works as a jaw or fingernail that grasp physically by
giving an explicit collision to the object that is to be acted.
Ingressive: - Use of pins, needles that helps in physically infiltrating the
surface of the object. In my case I use vacuum cups to pick the sheet.
Astrictive: - It is nothing but the suction that is generated on the surface of
the object, which is produced through vacuum cups as outsource and also
by electromagnetic stuff if in use.
Contigutive: - It is enforced to have a direct contact for the holding process
of the object, for example surface tension generated at particular point.
So, these are the categories based on various physical
belongings of the system. And in individual purpose depending on the
working material like for metal sheets, vacuum cups or electromagnets play
a dominant role as end effectors. In our case we have taken into the
consideration many factors and took an initiative to design suitable vacuum
cups such that the sheet is picked firmly with a particular pressure exerted
and is placed on the conveyor belt of the shearing operation without any
uneven movement of the sheet.
2.8 Related Works
S. Pachaiyappan, M. Micheal Balraj and T. Sridhar[4] have
published a journal that contains complete data related to articulated arm
robots for industrial applications. They have developed an advanced
technique in working of these particular robots from hazardous conditions
and how the human can intervene into the robotic work zone. The ultimate
motive in the research was to save human lives and in addition of
increasing the productivity and quality of product with good and high
technology environment. Nonetheless they have focused on safety and to
16. 16
create a good and healthy environment in the industry with use of advanced
technology.
After a deep study we have undergone many methods in
development of articulated arm robots as pick and place operators related to
our usage in the industry. The FANUC system has been taken into
reference for developing a new robot according to the constrained
environment and material of work [5]. The entire model is designed in Creo
parametric 3.0, the Assembly and Simulation part is carried out in
Autodesk Inventor 2017. As we have experience and knowledge about
these tools earlier.
We have been introduced to robotic arm in JNTU Hyderabad
(where we have earlier done our Bachelor’s), and there we did a detail
study on the manual of robot provided by FANUC. So, we have taken the
dimensions based upon these manuals to develop our model, which are not
exactly same dimensions according to FANUC standards, but have been
modified slightly as we need to do relating to space constraints in SIG
(Signode India Limited).
17. 17
3 Design & Drafting
Design of robotic arm means the human supervision on this
operation should be reduced. The shearing operation on which we are
working can handle one sheet at a time. So, the first feature that is expected
from this automation is picking up a single sheet from the stack of many
sheets. There are many options to consider for this carrying operation. For
example, a set of suction cups in a conveyor belt or suction cups replaced
with electric magnets. We cannot use electric magnets as they might pick
multiple sheets instead of one. The cutting blades cannot take more than
one blade. Of course, it can cut those 2 at a time but the blades get worn out
quickly. In order to make sure only one sheet gets picked up, we use
suction cups. If at all we consider the possibility of making a robotic arm
for the purpose of carrying the sheet, then our end effector should consist of
suction cups. Between conveyor and robotic arm, we chose robotic arm for
two reasons. First one was, robotic arm occupies less space when compared
to a conveyor setup. In the industry we are working, the place and position
of this machine is so important. Just to install an extra enhancement, the
whole shearing machine, which is very huge, cannot be replaced. So, to get
fit into a small space, we thought that robotic arm would do more good than
a conveyor setup. The second reason was its portability. How easily it can
be transported. Definitely, a robotic arm can be transported from one place
to another quickly. So, considering all the above reasons, we decided to
design a robotic arm with a pick and place type end effector.
The outline of the total mechanism was drawn on the paper just giving
us the basic idea of the robotic arm which acts as a gateway to our
imagination of how the shapes should be.
3.1 Mechanical Design
The most important aspect and backbone of this thesis is the
mechanical design of the robotic arm. A robotic arm has certain design
specifications and certain parameters are to be taken into the consideration.
Since, the design is an area related to thought, many varieties of designs
come to the mind at the initial stages of the design. Everything might not be
18. 18
fruitful and trial and error method cannot be trusted blindly. So, keeping all
these things in mind, we have decided to design the robotic arm whose
dimensions are loosely based on the dimension standards of Fanuc robotic
arm. The basic points[6] to be noted and followed for the design are:
Functionality: The arm should have the ability to lift, move, lower and
release an object while closely mimicking the motion of the human arm
with full extension. Any device that can perform the required motions to
pick and place an object required would have met the requirements of this
criterion. The choice of the number of the parts in this particular robotic
arm is taken by comparing it with a human arm. Let the action of human
hand picking up a container appear in your mind. We have the shoulder,
waist, elbow, arm, wrist and fingers do the job. This is the motivation for
the choice of the number of parts. This robotic arm also has 5 parts and 5
joints which are pretty much similar to the human hand.
Reliability: The device should be able to consistently pick up and place
objects in a smooth manner. I.e. the motion of the device should be smooth
enough in order to not drop the objects that are being lifted. Therefore, any
device that is able to lift and move an object from one place to another
without losing any grip would meet the criteria. After a detailed study, the
choice of end effector is made. Since, this device is used for picking and
placing metal sheets, the first common thought any mind would get is that a
magnet can be used to lift the sheet up. But the problem with that is, the
thickness of the sheet is so small that there is a very good chance of more
than one sheet being picked. If more than one sheet is fed to the shearing
machine at a time, that hurts the shearing blade really bad which can reduce
the life of the blade. The next option in front of us was to use suction cups
to lift the sheets. This I the most commonly used technique for the
transportation metal sheets in industries all over the world. So, we had
decided to use this technique for this purpose. Also the industry also had
the use of suction cups and a linear robot (conveyor) for the transportation
of sheets in the printing process. So, we have enough motivation and data
to use this technique.
Motion Range and Speed: Similar to human body the robots are
constructed with same joints between bones, here we have a constrained
limit for the movement of axis. In our design application every particular
axis has its own capacity of motion. The degree of movement of robot is
calibrated from centre base of axis. By this the speed in pick and place
19. 19
operation might vary, and this is occurred because each axis moves at
different speeds. The complete motion of the operation is recorded in terms
of degrees travelled per second.
Payload: The limited weight of each robot is its payload. So, the critical
specifications and tooling weights are sotted out. In our application this is
useful in specifying different categories of robots by the above
specifications.
Reach: In our articulated robot we need to check the two extremities that is
nothing but the V-reach and H-reach. Vertical reach is considered to know
how high our robot can go in terms of height extension. Whereas the
Horizontal reach is considered to know the distance of fully extended arm
from base to wrist. In few other applications we need to even consider a
short Horizontal reach.
Axes: The distinctive segments of our robot is associated with mechanical
joints, that serves as an axis of movement. We have designed our
articulated robot with 5-axis of movement. Generally according to our
knowledge industrial robots are designed to have 6-axis of movement, but
the number and placement of robot just gives flexibility variation for each
model.
3.2 Part 1
The first part designed in this project is this. It is because, based on
its measurements we have to measure remaining parts. And the weight of
all other parts including the payload will have its great effect on this part
since it is the base of this robotic arm. This part is an assembly of two
different parts. Part 1 has to rotate on its axis and other parts are connected
to this. So, it is the main source of transportation. The two sub parts in this
assembly are upper part and a shaft. The upper part is designed such that its
bottom is the one side of an Oldham coupling as shown in the figure 3.2
below.
20. 20
Figure 3.2.1: The upper part of Oldham Coupling.
The dimensions of this part are tabulated in the later part of the
document. This part stays in the upper area of the base and will be visible.
But there is a combination of shaft and key attached to this part from the
bottom to which a power source is connected and is made to rotate. This
supposed to be the component that transfers motion (rotational) from the
power source to the upper part of the body. The shaft and key and also the
total assembly of the part 1 is shown in the figure below. The shaft and key
inserted in this assembly acts as a typical Oldham coupling.
A general Oldham coupling has three discs, one coupled to the
input, one coupled to the output, and a middle disc that is joined to the first
two by tongue and groove. The tongue and groove on one side is
perpendicular to the tongue and groove on the other. The middle disc
rotates around its centre at the same speed as the input and output shafts. Its
centre traces a circular orbit, twice per rotation, around the midpoint
between input and output shafts. For this operation, we modified the
Oldham coupling a bit. Instead of using 3 discs, we used only two, which
too not discs exactly. We designed the ends of the 2 parts in the base as
Oldham couplings as shown below.
Since this is a pick and place operation, two disc instead of three
might be able to withstand the torque ranges of this operation. As we can
see the lower part of Oldham coupling has a shaft and a key. The upper end
21. 21
of the coupling has a flange which is directly designed with shoulder of the
robotic arm. All the assembly described till now will be assigned a rotatory
motion. That means, a motor is attached to the shaft at the lower most part
in the figure below and if it rotates, the whole robotic arm rotates.
Figure 3.2.2: The shaft and Key of Oldham Coupling.
The dimensions of the shaft are given below.
Length of the shaft (L) = 0.182 meters
Radius of the shaft (r)= 0.12 meters
Volume of the shaft (V) = 0.002055 meters3
22. 22
3.3 Part 2
This part can be compared to the bicep of the human arm. Like
the muscle of the human arm, it moves very less when compared to the
forearm but it provides the strength and hold for the forearm and wrist to do
their jobs. Its length is supposed to be more than part 1 and less than part 3
(since our design is similar to the human arm). An end of this arm is
connected to part 1 creating joint 2 and the other end is connected to the
part 3 to create joint 3. The design of this arm is shown below. The
dimensions are tabulated in the later part of document. The upper end of the
part is having a shaft to make itself rotate around the axis of the joint
between part 1 and part 2. The lower end of this part is having holes and a
gap between the two extended grooves to place the part 3 creating joint 3.
The power source is connected to the shaft at the top end part 2. The
rotation of this arm happens at this end. Its assembly, creating the joint and
its limits are discussed in the assembly section. The dimensions of this part
are given below.
Length of the part (L)= 0.45 meters
Thickness of the part (t) = 0.08 meters
Width of the part (b)= 0.153 meters
Volume of the part (V)= 0.00359787 meters3
Area of the part (A)= 0.269904 meters2
23. 23
Figure 3.3.1: The CAD design of Part 2.
3.4 Part 3
This part is the forearm of this robotic arm. The reach of this
robot mainly depends upon this part. This is a bit longer than part 2. The
movement of this part is more when compared to the other parts. This part
with part 2 creates a joint which is similar to the elbow in the human arm.
The main purpose of these two arms is sustaining the weight that is lifted
by the arm. One end of this arm is connected to part 2 as describe earlier.
The other end is connected to part 4 which is a kind of wrist to this hand.
The power source for this arm is given to the shaft on the left end in the
picture below. The dimensions of this part are:
Length of the part (L)= 0.775 meters
Thickness of the part (t) = 0.08 meters
Width of the part (b)= 0.21 meters
24. 24
Volume of the part (V)= 0.008741335 meters3
Area of the part (A)= 0.488215 meters2
Figure 3.4.1: The CAD design of Part 3.
3.5 Part 4 & Part 5
Now we have arrived at the wrist part of the hand. Part 4 is the
linkage itself between end effector and part 3. It has the ability to rotate
around the axis at the end of part 3 (around X axis). It can rotate 360
degrees on the axis. How much it should rotate can be adjusted as per the
requirement of the user. It also holds the end effecter (Part 5) in the desired
position. It acts a joint for the part 5 where part 5 can rotate around its own
axis (Y axis). The part 4 is shown in the figure 3.5 below on the left. Joint 4
is created between these 2 components. Part 4 being the stable one, it lets
part 5 rotate around Y axis.
Length of Part 4 (L)= 0.266 meters
Height of Part 4 (H)= 0.155 meters
25. 25
Volume of Part 4 (V)= 0.000875211 meters3
Area of Part 4 (A)= 0.133435 meters2
On the right of this picture, the part 5 can be seen. This is the one that
rotates around Y axis. This part allows pneumatic cylinders to get
connected to it. This part has the capacity to sustain the weight of 8
pneumatic cylinders and the sheet attached to them that is to be lifted. This
part has the space to carry 8 more pneumatic cylinders. The dimensions of
this part are:
Length of the part (L)= 0.75 meters
Height of the part (H)= 0.515 meters
Width of the part (b)= 0.5 meters
Volume of the part (V)= 0.005367438 meters3
Area of the part (A)= 0.453101 meters2
Figure 3.5.1: The CAD design of Part 4 and Part 5.
26. 26
3.6 Pneumatic Cylinders
As we discussed earlier, the means of holding the sheet in this
operation is executed with the help of suction cups and pneumatic
cylinders. The phenomenon of this action is that, rubber suction cups get
places on the sheet. And when ready, the air between the suction cup and
the sheet is sucked out and a pressure near to the vacuum is created. The
pressure outside the suction cup in way too larger than the pressure inside
the cup. So the air tries to enter inside the suction cup through the gap
between the sheet and suction cup. This automatically creates an air lock
and the sheet gets strongly attached to the suction cups. This phenomenon
is already in use in the industry in the printing process which is already
mentioned earlier. The pneumatic cylinder assembly is shown below.
Figure 3.6.1: The CAD design of pneumatic Cylinder.
27. 27
3.7 Assembly
After the design of individual part is developed in CREO
Parametric 3.0 the next step is we need to assemble the parts to form a
complete robotic arm using Autodesk Inventor 2017 Software[7]. The
assembly has the arm with the wrist and end effector. If we describe the
functionality of the robotic arm, it is a six degrees of freedom system. Six
degrees of freedom (6DOF) refers to the freedom of movement of a rigid
body in three-dimensional space. Specifically, the body is free to change
position as forward/backward (surge), up/down (heave), left/right (sway)
translation in three perpendicular axes, combined with changes in
orientation through rotation about three perpendicular axes, often termed
pitch, yaw, and roll. The part in the yellow rotates around its axis. The parts
in red and brown are fixed at their bottom ends and move up and down.
Now, the most important area of the robotic arm is described. It is the wrist
and end effector.
And the dynamic behaviour of these assembled joints is
explained below.
3.7.1 Joint 1 (Waist & Shoulder)
In the below figure 3.7.1, we can see 3 parts. The base
is fixed which is obvious and the first part was coloured in black. Part 1, as
marked in the figure 3.7.1, is allowed to rotate on its axis perpendicular to
the base. How much it to rotate that has to be decided by the user. In
reality, the base does not rotate by itself. We use a power source which
rotates the base. The base we designed might not be as simple as the outline
shown below. The base area we designed consists of 3 parts. First one is the
fixed, which provides a fixed support to the remaining moving arms. The
second and third parts are the rotating ones. They are together assembled as
shown on the figure 3.7.1. So first the base part is to be fixed firmly to the
ground and joint 1 is between the base and part1, the nature is it rotates
around its common axis at a fixed limit of 0 to 360 degrees. The distance
between part 1 and base is 1/8th of an inch and it is generated to avoid the
friction between them, but we can set the gap between these two parts by an
option in inventor. In the figure 3.7.1 below, the left one has a yellow arrow
mark showing the direction of rotation and
28. 28
Figure 3.7.1: The CAD design of Joint 1 (Waist and Shoulder).
As we know the dimensions of the solid shaft the length, volume and
radius, now to find the torque of the solid shaft we need to consider few
other dimensions.
R= 0.958m
W= 33N
Where,
R is the distance of the radial arm from centre of shaft to maximum bending
length of the arm.
W is the load acting on the shaft.
So, by considering the above dimensions the torque is to be calibrated.
Torque T= load acting on the shaft is multiplied to distance of the radial
arm from centre of shaft to maximum bending length of the arm.
29. 29
Therefore, the torque is T= W * R
T= 33 * 0.958
Torque of the solid shaft is = 31.614 Nm.
Actually to know the stability of the shaft we need to find the FOS that is
nothing but the Factor of Safety of a solid shaft.
We need to calculate Induced shear and allowable shear to find the Factor
of Safety.
Induced Shear =
Here, as we know the radius of the shaft is r = 0.12m
Then the diameter is d = 0.24m
Now, we need to substitute the calculated values in the formula above to
find
the induced shear of the shaft.
Therefore, Induced shear is = 31.614 * 16 / 3.14 *(0.24)3
= 505.824 / 0.0434
= 11654.9 Kpa
Induced shear is = 11.65 Mpa
As we know the induced shear the allowable shear is to be taken form the
ASME code depending upon the material we have considered.
So, according to ASME code for T6 6061 Aluminium material the
allowable shear of solid shaft is calculated below.
The maximum shear stress should be 0.3 times tensile stress as per ASME
code.
30. 30
For T6 6061 aluminium alloy the tensile = 276 Mpa
For T6 6061 aluminium alloy the UTS = 310 Mpa
We have to take the highest value that is UTS for calculating the allowable
shear as per ASME code.
Allowable shear = 0.18 * 310
= 55.8 Mpa
Therefore, the factor of safety is = allowable shear / Induced shear
= 55.8 / 11.65
The Factor of safety of a solid shaft is = 4.75
3.7.2 Joint 2
This is the joint that is formed by the combination of Part
1 and Part 2. Part 1 is associated to base with a joint (joint 1). This
particular joint allows part 1 to rotate on its axis (Y axis). Now as part 2 is
attached to part 1, part 2 can rotate on its axis (Z axis) in an up and down
movement, and also can rotate around the axis of part 1 (Y axis)
simultaneously as both of these parts are connected. The anatomy of this
joint is shown in the figure 3.7.2 below.
31. 31
Figure 3.7.2: The CAD design of Joint 2.
The joint 2 has a fixed limit of rotation where part 2 (the part in
yellow) rotates from 55 to 270 degrees. However, these limits are given
such that both the parts consisting this joint do not collide. These can
always be changed by the user. The gaps between walls of part 1 and part 2
are equal, and this is developed by avoiding all the possible contact among
them, such that there is no proper friction development and the gap is also
adjustable.
3.7.3 Joint 3 (Elbow)
The further anatomy of the robotic arm deals with the elbow.
The elbow is the joint of two parts 2 and 3. The main purpose of this elbow
is to give the arm some more room to move the end effector forward.
Although each and every link in a robotic arm is important and has to bare
some weight, but this elbow is quite important as it can be termed as the
centre of the robotic arm. The elbow is a joint of two parts which are shown
below.
32. 32
Figure 3.7.3: The CAD design of Joint 3 (Elbow).
These two parts are assembled to each other and their common point
becomes the joint. Both of these are supposed to rotate around Z – axis i.e.,
they should move up and down. The yellow part shown in the figure is
connected to the shoulder of the robotic arm shown above. This yellow part
is continued with another arm in red as shown in the figure 3.7.3. Joint 3
has a fixed limit of rotation that is the red part moves on positive axis from
0 to 100 degrees and negative axis from 0 to –120 degrees.
3.7.4 Joint 4 (Wrist)
Wrist is the area which balances the operation. In this
operation, the most important point is to balance the sheet while it is being
transported. This robotic arm has to pick a sheet and place it in another
point. The picture below shows the top view of a prototype of the robotic
arm. In this picture, there is a starting point and end point. The sheet is
carried all the way from pick up point to end point. The most important
point is, the sheet must remain parallel to the shearing surface all the time.
The wrist plays an important role in doing this. The construction of this
joint done in such a way that part 4 rotates around its axis (Z axis) and also
hold the end effector. Since part 4 is smaller in size when compared to part
3, it is important to balance the part 4 between the groves of part 3.
33. 33
Improper balance might affect in non-uniform loading on part 3 and uneven
deformation.
Figure 3.7.4: The CAD design Joint 4 (Wrist).
Joint 4 has a fixed limit of rotation that is positive axis from 0 to
230 degrees and negative axis from 0 to –20 degrees. In the part 2, 3 and
part 4 are having joints in between them which are identical and its nature
doesn't change.
3.7.5 Joint 5 (End Effector)
Joint 5 is the most important and delicate part of this whole
assembly. This joint is between part 4 and part 5. Part 5 rotates around Y
axis at the joint. Part 5 again needed to be assembled with the pneumatic
cylinders. The movement of joint 5 is identical too joint 1 and hence the
limits are also the same that is 0 to 360 degrees. In this the joint 1 and 5 are
moving around y-axis and joints 2, 3 and 4 are moving around z-axis. In
joints 6 we have eight pneumatic cylinders on the end effector as shown in
figure 3.7.5, which means they consists of eight pistons and each piston is
set into its respective cylinders with the same limits. The limits are
(assuming that the piston wall is in touch with topmost wall of pneumatic
34. 34
cylinder and the movement is possible only downwards), the piston has a
limit of 2.5 inch of maximum reach as 0.5 inch as the end, the same thing
happens for the remaining seven pistons and thus the articulated arm is
assembled. The figure 3.7.5 below is the full end effector which has 8
pneumatic cylinders and suction cups at its ends.
Figure 3.7.5: The CAD design of Joint 5 (End Effector).
All these joints assembled together gives the robotic arm, a
pick and place operator. This robotic arm is now consisting of parts those
are movable. Now, we have to assign jobs for these parts. The main job is
to pick and place a sheet metal from one position to another. This main job
is divided into smaller jobs and assigned to each part and joint. Them
working simultaneously as per directions given gets the job done. These set
of directions explain dynamic behaviour of the robotic arm.
The complete Assembly of the Articulated Arm Robot is show in Figure
3.7.6. below.
35. 35
Figure 3.7.6:The Complete Assembly of Articulated Arm Robot.
3.8 Dynamic Behaviour of Robotic Arm
The very first job that is needed to be done is holding the sheet and
getting ready to the take off. This work is done by the end effector. In our
case, pistons of 8 pneumatic cylinders we have, shoot down and suction
cups get themselves attached to the sheet. When they get attached to the
sheet and an air lock is created between suction cups and the sheet, the
piston rods retrace themselves into the cylinders creating a gap between
ground or stack and the lifted sheet. This retracing action takes place in half
a second, were this time is not a fixed. The user can edit the time as per his
wish and requirements. These inputs are given in the dynamic simulation
module[8] in Autodesk Inventor 2017. All proper assemblies created in
Inventor are converted into required joints in the dynamic simulation
module. For example, the piston is placed in the cylinder and constrain its
motion limits such that it moves in between front and rear wall of the
piston. This assembly is converted into a cylindrical joint in the dynamic
simulation environment. Cylindrical joint has a nature where the part
attached can move translationally and also can rotate on its axis. This
rotation is unwanted for our use here. Only translational motion is desired.
36. 36
Autodesk Inventor provides an option to lock the DOF’s using which we
lock the rotational motion in this part. The total action of lifting the sheet
up starts at 0 seconds and ends at 0.5 seconds. Now the next motion starts
from 0.6th
second.
Figure 3.8.1:The dynamic behaviour of Pneumatic Cylinder.
The next job is to lift the sheet up to a safer height, so that it can
be transported from one place to another. The word safe is used because, if
it is not at a proper height the sheet might hit and collide with other
machinery or may be any person standing near. This job of lifting it up is a
result of simultaneous actions between part 2, part 3 and part 4. At 0.6th
second, part 2 starts moving upwards (Anti-clockwise direction). By the
end of 2.5th
second, part two changes its position by 37 degrees. During this
time period, there is a simultaneous movement in part 3. It also moves
upwards changing its position by 10 degrees and then 20 degrees
downwards. The reason of this up and down movement is that, there is a
safe distance between end effector and the other parts of robotic arm.
Collisions are messy but the movement of part 3 starts from 0.7th
second.
All these time limits and commands can be changed as per the user.
37. 37
Now the most important task arrives, that is to try maximum how to
maintain the sheet parallel to the ground (o machining surface). The reason
is, since the sheet is held on the basis of an air lock between suction cups
and the sheet. So, if the sheet is slant, it is forced to pull itself downwards
and air lock can be broken. So to avoid this and to maintain the hold, it is
important to maintain the sheet parallel to the ground.
Figure 3.8.2: The Prototype of Robotic Arm in three sections.
Let us consider a human wrist while lifting and carrying a tray
with glasses full of water in it. While lifting up the tray, even though the
arm moves upwards the position of the wrist changes with the motion to
keep the tray parallel to the ground, so that the water won't spill. The same
mechanism is being used here in the wrist. If we see the picture above, it is
a rough sketch demonstration of the current action. We observe that the
blue part and the sheet are parallel to the machining surface all the time.
That blue part is part 4, which is described in the earlier sections. As part 2
and part 3 moves upwards or downwards, part 4 rotates in the opposite
direction to put this sheet parallel to the ground. For this action from 0.6th
second to 2.5th
second, the part 4 to which end effector is connected rotates
28 degrees in clockwise direction. These 3 simultaneous actions lift the
sheet up to the desired height and also maintaining it parallel to the ground.
The next motion that follows is to transfer the sheet from its
position to the destination. This is a solo action of joint 1, the rotational
38. 38
joint between base and part 1. The part 1 rotates and all other parts
connected to it displace. This rotation starts at 2.5th
second and ends at 5th
second. The part 1 changes its position by rotating 90 degrees clockwise
from its current position. But that is not the only task here. Let’s observe
the rough sketch below. It shows 3 steps of this action. In all these steps,
the circle in the figure is the top view of the part 1. In section 1, the robotic
arm is at its 2.5th
second i.e. the starting point of rotation of part 1. Section
2 is its position during the travel and Section 3 shows the end point of this
rotation (5th
second). In all these 3 pictures, the sheet which is light green in
the picture, always stayed in the same position with respect to the red line
in the picture during the transportation. It only changes its position with
respect to ground. This action is executed by the joint 5 (Rotational joint
between part 4 and effector). As joint 1 starts acting, joint 5 also starts
acting. The end effector rotates from 2.5th
second to 5th
second by 90
degrees, but in counter clockwise direction.
Figure 3.8.3: The Top view of Robotic Arm.
This particular action is assigned in this process only to test and
verify the abilities of the robotic arm. These can always be changed by the
user. As the sheet reaches the 5th
second, the next task is to put it down.
This action is again related to part 2, part 3 and part 4. This action is a
mirror image of the action of lifting up performed by these parts (0.6th
39. 39
second to 2.5th
second) only difference will be the timing of this action.
This action starts from 5th
second and ends at 7th
second. Again the suction
cups shoot down and pot the sheet down. This action spans from 7th
second
to 7.5th
second. As an example the position vs time graph of part 2 is shown
below. The whole action spans are for 7.5 seconds. The steps involved in
assigning these positions and speeds at each joint is explained next.
Figure 3.8.4: The Graph between Position vs Time.
In environments section in Autodesk Inventor 2017, there
is the dynamic simulation module. Once it is opened, we can see a section
called standard joints in model tree. This is obtained while performing the
assembly. All joints that are assigned in the assembly are taken as standard
joints. In our case, all the joints described above are present here. If these
are unwanted or needed to be modified, there is an option available in this
module. In bar the upper part of the screen, we find some option simulation
settings. On clicking this, it gives an option Automatically convert
constrains to standard joints. By clicking that off, we can edit our own
joints in dynamic atmosphere using the insert joint option in the upper part
of the screen. Now it’s just assigning the actions for every arm and
coordinating their actions according to the job that is needed to be done.
40. 40
For example, select a joint in our case its joint 3 (Part 2 and part 3). Find
this joint in standard joints section in model tree. Right click on it and
select properties. Find edit DOF’s option and start assigning the values
either a numerical value or an input grapher. The process that is done for
this joint is shown in a flow chart 3.8.5 below. Following these steps lead
you to the command box shown in the following figure. We have the
choices to edit the DOF’s, change the path of a part or lock the DOF’s such
that the parts do not move at all. In this assembly for robotic arm, we have
used rotational joints for joint 1, 2, 3 and 4 and we have used cylindrical
joints between piston rods and pneumatic cylinders.
Now, let us see the construction of robotic arm in a flow chart below.
Figure 3.8.5: The flow chart construction of Robotic Arm.
42. 42
4 Materials
Robots are mostly built of common materials. Some
specialized robots for clean room applications, the space program, or other
"high tech" projects they may use titanium metal and structural composites
of carbon fibers. The operating environment and strength required are
major factors in material selection[9]. There are a wide variety of metals
and composites available in the market these days. Selection of material is
very deep process. We have referred material and process charts designed
by Mike Ashby[10]. He has provided us with a wide range of plots showing
the different qualities and characteristics of materials plotted against each
other. Of all them, we focused on 2 chats, strength vs density plot and
strength vs relative cost figures 4.1 and 4.2. Selection of materials and the
cost study to design an economic model is a completely different and
deeper area of engineering. That case study requires more parameters to
compare judge the choice of materials. We are not getting into that now
but, we tried to choose the materials in such way that they satisfy our load
capacity requirements and also not too expensive.
Figure 3.8.1: The Graph between Strength and Density of the Material.
43. 43
Figure 3.8.2: The Graph between Strength and Relative cost per unit
volume.
Steel, cast iron and aluminium are most often used materials for the
arms and bases of robots. Aluminium is a softer material and therefore easy
to work with. But steel is several types stronger. We chose to design the
parts with aluminium. It hasn’t been a direct selection. The part 1 has a
choice to have more weight when compared to other parts. The remaining
parts are not grounded and also needed to carry some weight of other arms
and end effector also the sheet in this case. So they cannot be heavier than
the base which can harm the part 1. We decided to assign aluminium to all
parts including part 1. Of course we always have choice to change the
material. Our selection has been proven good as aluminium did good for
parts 1,2,3 and 4. But, in the opposite case, we decided to assign stainless
steel to the parts. Only part 5 showed less load bearing capacity with
aluminium but, we have tried changing the material to CFRP (Carbon Fiber
Reinforced Polymer). The reason for this is it is stronger and lighter
material than aluminium. We cannot assign a material with more density.
As density increases, weight increases and increase in weight of Part 5
might have bad effects on other arms. Our experiment worked and the part
5 has increased its capacity in figure 4.3. The only problem with CFRP is it
is relatively expensive. But again, selection of materials is a completely
44. 44
different study. We limit our study to the usage requirements of the
industry.
The material used for most of the parts of robotic arm is Aluminium 6061
alloy[11]. 6061 is a precipitation-hardened aluminium alloy, containing
magnesium and silicon as its major alloying elements. It has good
mechanical properties, exhibits good weldability, and is very commonly
extruded (second in popularity only to 6063). It is one of the most common
alloys of aluminium for general-purpose use. The mechanical properties of
6061 depend greatly on the temper, or heat treatment, of the material.
Young's Modulus is 69 GPa (10,000 ksi). Annealed 6061 (6061-O temper)
has maximum tensile strength no more than 120 MPa (18,000 psi), and
maximum yield strength no more than 55 MPa (8,000 psi). The material has
elongation (stretch before ultimate failure) of 25–30%.
Figure 3.8.3:Part-5 assigned with CFRP material.
45. 45
5 Simulation & Analysis
5.1 Need for Stress Analysis
A good design is always judged by its load bearing capacity. In
operations like transport where machines are used, we expect them to be
stronger than the necessity, so that they can perform the required action for
a long time. Stress analysis is an engineering discipline that uses many
methods to determine the stresses and strains in materials and structures
subjected to forces. In engineering, stress analysis is often a tool rather than
a goal in itself; the ultimate goal being the design of structures and artifacts
that can withstand a specified load, using the minimum amount of material
or that satisfies some other optimality criterion. The stress on the part can
be related with the load carrying capacity. Typically, the starting point for
stress analysis is the geometrical description of the structure, the properties
of the materials used for its parts, how the parts are joined, and the
maximum or typical forces that are expected to be applied to the structure.
The result of the study (analysis) is a description of how the applied forces
spread throughout the structure, resulting in stresses, strains and the
deflections of the entire structure and each component of that structure. The
analysis may consider forces that vary with time, such as engine vibrations
or the load of moving vehicles. In that case, the stresses and deformations
will also be functions of time and space. Generally, the calculation of the
stress distribution used to be carried out using mathematical means and
Finite Element Methods. But calculation of stress distribution more
appropriately needs more number of elements in the geometric design. This
increases the computational time and effort by doing it only in the
mathematical way. Hence, we take the aid of simulation techniques of CAD
software’s such as Autodesk Inventor 2017 to perform these tasks and save
the effort. To establish a good simulation environment, we have to apply
proper loads and boundary conditions to make the model as close to reality
as possible.
5.2 Loads & Boundary Conditions
The robotic arm has 5 joints and every joint has only one degree of
freedom (rotational). To do this, we have to specify an axis for each joint to
46. 46
rotate around it. Any other kinds of movement are constrained. The way the
joints are created are explained in the Assembly section in the earlier part
of the document. In this area we discuss about the Behavior of the joints
under loads and boundary conditions. The figure 3.7.2 shows joint 2 of the
assembly. The joint has already been defined as the rotational joint. Now,
for part 2 to rotate, a moment must act on the shaft of part 2. The angular
momentum of an object can be connected to the angular velocity ω of the
object (how fast it rotates about an axis) via the moment of inertia I (which
depends on the shape and distribution of mass about the axis of rotation).
The part 2 moves from 230 degrees to 193 degrees in anticlockwise
direction for 37 degrees in 2 seconds giving the angular speed of 18.5
degrees/sec. The speeds of the joints are tabulated below table 5.2 for the
calculation of moment.
Table 5.2-1: The table for Velocities of all Parts.
Part No. Start point End point Time taken Velocity
1 360 degrees 270 degrees 2.5 secs 36 deg/sec
2 230 degrees 193 degrees 2 secs 18.5 deg/sec
3 168 degrees 178 degrees 5 secs 20 deg/sec
4 186 degrees 214 degrees 1.2 secs 23.3 deg/sec
5 360 degrees 270 degrees 2.5 secs 36 deg/sec
The angular moment L can be calculated using the formula ,
where is the moment of Inertia of the body and is the angular speed.
Inventor performs these calculations itself and takes the moment value for
the calculation. Along with the speeds of the joints, we also give the loads
47. 47
on the end effector. The sheet is an Iron sheet with measurements
777 400 4 mm, mass of the sheet is 3.35 Kg and weight 32.9286 N. There
are 8 suction cups on the end effector. The weight of the sheet acts
downwards (due to gravity). The suction cups need to create a force that
overcomes gravity. The only external loading given in this model is, the
pressure acting on the sheet at the suction cups to lift the sheet up. As we
said earlier, the suction cup phenomenon is already in practice in the
industry. There the pressure created on the sheet in the direction against
gravity by the locking of suction cups is 3 bar. In our case, we have 8
suction cups. This pressure is divided among 8 cups and is converted to
force by multiplying the divided pressure with the area of the suction cup.
The overall pressure on the sheet is, P = 3 bar = 300000 Pa
Divided among 8 cups, pressure by each cup is, Pcup = 37,500 Pa
The area of the suction cup (Calculated from Creo) is, Asheet = 0.00108
meter2
Now, the force created at each cup is, F= Pressure x Area = 40.5078 N
The force F that is calculated above is the force that acts against gravity at
one suction cup. There are 8 of them on the end effector so the net force
against the gravity is 8 times F.
Figure 5.2.1: The Force acting on the sheet.
48. 48
The remaining loading in this model is automatically taken from the
assembly. The external loads are to be given separately.
5.3 Export to FEA Module
The dynamic simulation module only provides the means to learn and
correct the dynamic behaviour of the assembly. We have provided the
loads, forces and constraints needed for the robotic arm. There is a
particular timing for each part and all of them moves correspondingly with
each other. All the action happens in 7.5 seconds and the movement is
solved for stress in stress analysis module.
As discussed earlier, all these components are to be exported to
FEA to perform stress analysis. For this we have export to FEA option in
Dynamic Simulation module. All that is needed to be done is selecting the
part that is needed to be exported. Click on the export to FEA, then select a
part or multiple parts. As soon as the parts get selected, a window opens
asking to select all the joints and contacts related to it. For example, part 2
is selected to export. The links we have for part 2 are joint 2 and joint 3.
We select the surfaces of part 2 that has direct contact with joint 2 and joint
3. Results can go really bad. The export to FEA module and selection for
part 2 are shown in the figure below 0.1.
Figure 5.3.1: The Export to FEA.
49. 49
Part 2 doesn’t have any welded joints attached to it. Even though
the selection is same for those components with the welded joints, here is
the example of part 5 which is associated with joint 5 and also has 8
pneumatic cylinder surfaces welded to it. The selection is shown in the
figure below. It is important that the component that is to be exported must
be a flexible one. That means, sometimes for our convenience, we assemble
different components in different assembly atmospheres and join them
under one atmosphere later. The final assembly which has sub-assemblies
in it treats all the sub-assemblies as parts. So to select a single part from a
sub-assembly, we need to select that sub-assembly and right click on it,
then select the option flexible on it. In this way, we select all the necessary
parts that are exported to Stress analysis module in Autodesk Inventor.
After selection, run the simulation using the simulation player. In
this case, the total time period is 7.5 seconds. After the simulation has run,
open the output grapher in the upper part of the screen. There we find the
export to FEA option. Click that and we can see the parts that are selected
for FEA. Now, we have to generate a time series. Right click on the time
series option and select generate series option. A window opens up showing
the number of steps present between 0 and 7.5. We can select any number
of time steps according to which we are going to analyse those parts. In the
output grapher itself, we have all the stable groups, welded groups and
standard joints present in it. Click any of the joint, select any option present
there such as position, velocity and acceleration of that joint. Run the
simulation and you can see the path of that particular physical quantity
throughout the run time of the simulation. Which brings us to the point, the
velocities or torques that are assigned for the joints with which they move.
50. 50
Figure 5.3.2: The Part-5 in Export to FEA.
Figure 5.3.3: The Output Grapher and Time Series
Now, exit the dynamic simulation module and go to environment
module. Go to stress analysis. Create the study, select the option motion
loads. This option gives us the chance to select a particular part at a
particular time. Here, for example, we chose part 2 to be simulated at the
time 1.5th
second. Select that time or any time step closer to this value.
Click ok and we enter the stress analysis environment. Here, the part which
is going to be simulated appears as it is but all other parts in the assembly
fades out. We can also see the yellow arrow marks all over the figure. Each
arrow mark represents a load or force acting on that body. All the data is
taken from the information generated by the dynamic simulation. Now, we
51. 51
assign the materials for the parts here. Click materials section, go to assign
materials and give each part a material which is desired. Here, we give
aluminium for all parts except suction cups and sheet metal. Suction cups
are given the rubber material and sheet metal is assigned with cast iron. The
density of the material multiples itself with the volume of the part
automatically giving the mass of the part. As the gravity is also assigned,
the weight of the component is also added to the loads section. All this
work is done by the software itself. The loads are given, constraints are set
and materials are assigned. The next step is meshing. Go to the mesh
controls, edit mesh size and click mesh view. The mesh is generated. Now,
check for geometry updates such as contacts. Update contacts if necessary
and run the simulation. Now, we arrive at the most interesting part,
interpretation of results.
5.4 Meshing
The meshing of the designed articulated arm robot is accomplished
very cautiously in order to achieve good amount of stress distributions. The
stresses generated here are very high and these stresses are developed due
to bending loads at the round and sharp corners. And by having a deep
study about articulated arm robot cautiously, the high stresses generated are
calibrated and are characterized as detracting ranges.
By default, meshing provided by inventor is made and the part is
simulated, after the detail study of this stress distribution obtained. We
found some areas were stresses are more when compared to remaining
areas. The initial sizes of mesh are 0.1 minimum element size and the
average element size is 0.2. Then the local mesh area option present in
inventor to select the areas those are observed to possess high stresses and
their element dimensions are changed to 0.01 minimum element size and
0.02 average element size. The local mesh control gives us the option to
edit the density if mesh at any chosen area. The mesh adjusts itself
according to the shape of the geometry. The shape of the element is
tetrahedral and during the final stages of simulation, we made sure that
each geometry has at least 2 lakh elements. The meshed Finite element
model is shown in Figures below 5.4 and 5.4.1.
52. 52
Figure 5.4.1: The Joint were the meshing is excited
Figure 5.4.2: The Meshed Part of FEA.
5.5 Stress Analysis Environment
The Finite element analysis in Autodesk Inventor becomes really
easy when the assembly is proper and the joint forces, loads and constraints
are given properly. The joints and parts are described and the way they are
53. 53
assembled is explained in the previous section. In this section, we discuss
about the finite element analysis performed by the Autodesk Inventor on
our robot. For this, we have exported the parts from dynamic simulation
module to stress analysis module[12]. The movement of each and every
part of robotic arm is preloaded and exported to FEA. The constraint set is
very important for any structural analysis of any physical structure. If we
have a load acting on a body, there has to be a reaction of that load on that
body. Physical constraints determine that reaction. For example, let us
consider a cantilever beam with a load acting on its free end. Naturally, the
deformation will be more at the free end. But its reaction is learnt at the
constrained end. So, the strength and stiffness of that beam for that material
is learnt.
Similarly, we constrain the components of the robotic arm
according to our use. Each arm in the robot is involved in at least one joint.
Even though the connections won’t change during the process, the
orientation of stresses on the components change due to their motion in the
given time. Inventor provides the option of motion loads in stress analysis
module. Where we analyse each part at any interval of time including the
external loads, body loads and gravity. We just have to generate a time
series with the number of time steps between them. In this case, we have
taken 25 time steps between 0 and 7.5 seconds. We choose 6 time points
where we feel the change in the stresses and displacements can be observed
clearly. The loading in this model is automatically taken from the assembly.
The stress is analysed dynamically as we have to know how the stresses are
fluctuating in a part during its motion. The loads and boundary conditions
change and recorrect themselves whenever there is the change in the
position or time step. Now, we will have a stress distribution once the
simulation is done. But, how do we know whether the results obtained are
correct or at least approximately correct? Even if they are correct, are the
results good enough to say that the design can take the load. Let’s have this
discussion in the coming sections.
54. 54
6 Analytical Model
The hand calculations are performed in this case are just to verify
whether the simulation is going accordingly too solid mechanics theory.
Since it is very tough and complicated to establish a 3D model with hand
calculations, we always prefer simulation software’s of FEA (Like
Autodesk Inventor 2017). But to verify whether the given boundary
conditions and created environment is correct, we tried to establish a
deformation equation for a part in our model. Here we are going to compare
the calculated value to the displacement (deformation) in x-direction in the
simulation.
For this purpose, we take part-2 to carry on the hand calculations
with in. we have few changes in the geometry of this part, such as we have
ignored gaps and holes in the geometry and haven taken it has a solid linear
beam with uniform cross section. The curved cross section is taken has a
straight line. The dimensions of part-2 are given below.
Volume V = 0.00359787m
Density = 2700kg/m3
Mass M = volume * density
= 9.714kg
Weight q = mass * g = 95.29N
Length L = 0.45m
b = 0.153 and h = 0.08
Euler-Bernoulli Beam theory
Euler-Bernoulli beam theory is a simplification of the linear theory
of elasticity which can calculate load carrying and deflection characteristics
of beam. We start with a 4th
order differential equation of deflection and
derive the 1st
order equation. For this purpose, we take the position of beam
at 0.5th
second and assume it as a simply supported beam[13], with both
ends fixed.
The boundary conditions of a simply supported beam are.
55. 55
w (0) =0. Because the beam is pinned to its support, the beam
cannot experience deflection at the left-hand support.
w(L)=0. The beam is also pinned at the right-hand support.
w''(0) =0. As for the cantilevered beam, this boundary condition
says that the beam is free to rotate and does not experience any
torque. In real life, there is usually a small torque due to friction
between the beam and its pin, but if the pin is well-greased, this
torque may be ignored.
w''(L)=0. In the same way, the beam does not experience and
bending moments on its right-hand attachment.
The Euler-Bernoulli beam equation is given as
On integrating the Euler-Bernoulli beam equation we get the derived
equations as follows.
(1)
(2)
(3)
(4)
Now, let us consider that the load acting on the beam is uniformly
distributed. So, to calculate the load at a particular point on the beam the
function we use is
Where,
(x = 0.1 to L)
56. 56
Applying the boundary conditions in the above equation (4), we get the
values of constants by using the MATLAB software as.
After solving this in MATLAB we came up with a graph showing
maximum deformation at the center.
The value obtained is 5.3*10-7
m, but the obtained value at the center of
beam in simulation of part-2 is 6.83*10-7
m which is really close. But if we
observe more closely the deflection obtained from hand calculation is lesser
than the one which we obtained from simulation.
They are many reasons for that, it might be loading because our
loading is very approximate taken for the convenience of calculation. While
the simulation environment might have more realistic loading. The other
reason might be the material (density). For our mathematical model w have
ignored all the groves and holes and took the beam as normal solid beam,
but where in reality it has multiple grooves and holes more material
(density) means less deflection. With all these observations and results, we
can say the simulation performed is close to reality and are logical.
57. 57
7 Results & Discussions
7.1 Stress Analysis Results
The ultimate purpose of any analysis is to allow the comparison of
the developed stresses, strains, and deflections with those that are allowed
by the design criteria. All structures, and components therefore, must
obviously be designed to have a capacity greater than what is expected to
develop during the structure's use to obviate failure. The stress that is
calculated to develop in a member is compared to the strength of the
material from which the member is made by calculating the ratio of the
strength of the material to the calculated stress. But, before the simulation,
one must be able to figure out where the maximum deflection occurs in a
part provided you have the information of boundary conditions. For
example, if I see a cantilever beam with a load acting on it downwards, I
can figure out that the maximum deflection would be at the free end and
there would be a reaction force present at the fixed end acting opposite to
the load. Similarly, we know the boundary conditions and loads acting on
each part at every time step. Therefore, we have some idea where
maximum deflection is going to be.
The Autodesk Inventor gives the stress distribution or deformation over the
part at a particular instant. If I want the stress distribution at a particular
time step, say 4.3rd
second, I can edit the study properties, change the time
step and re-simulate it. But, Inventor doesn’t give the behavior of stresses
along with time. That means, we cannot able to see a Time vs Stress plot in
Inventor. So, just to understand the behavior of the stresses in a cycle and
also to find out where the stresses are maximum or minimum in the cycle,
we have found out a way. The output grapher in the Dynamic simulation
module of Autodesk Inventor, we can find the model tree of all the part,
joints, stable parts, forces arranged there. By clicking any of them gives the
option to view its plot against time. Here, we arrive at joints and select a
joint. If we open that joint, we can find sub columns of position, velocity,
acceleration, imposed force and moment, each having their plot against
time throughout the cycle. We select the moment graph. The reason behind
selecting the moment graph is,
We know that,
58. 58
Where is the moment,
is the Young’s modulus of the material,
is the Moment of Inertia and
is the density of the material
The stress denoted by σ(y), can be written as the following equation,
The term replaced by gives
In the above equation, the moment of inertia is a constant value as the
dimensions of the part remain same over the cycle. Therefore, the moment
is proportional to the stress. Moreover, if we consider any part in the
robotic arm, the maximum deflection is always at the closer to the joints
i.e.; at the ends. The moment of the rotating part creates the deflections at
those particular areas. Considering all these reasons, we can say that the
Time vs Stress plot will be similar to Time vs Moment plot. But, to validate
our assumption, we have provided with the following information. The
Time vs Stress graph of Part 1 is shown below figure 7.1. We have
simulated the part 1 in all the 30 time steps and plot the obtained maximum
stress values against time steps. Both of them are shown below figure 7.1.
They are not exactly similar because the Time vs Stress plot is generated by
plotting 30 time steps against the respective stress values in Matlab. But the
graph generated by Inventor is finer and definitely has more than 30 time
steps. So, we can see more smooth curve than the one generated by the
Matlab. But, the time steps where maximum and minimum values of stress
59. 59
occur and time steps where maximum and minimum moment acts are the
same.
Figure 7.1.1: The graph between Time (sec) vs Stress of Part 1.
This supports our assumption. As simulating each part for 30 times
and recording the stress values is a complicated process, we can use Time
vs Moment plots to check those particular time steps where stresses are
maximum and minimum. To check this again, we have done all the process
explained above for part 2 also. Those two plots are also shown to be
similar, making our point stronger. The comparison is shown in appendix.
But, a different process for Part 5 is applied. There are 8 suction cups on
Part 5 and the forces acting on those 8 cups is same. But change in the
position of the sheet with time changes the behavior of forces are moments
on Part 5. But all those Force vs Time graphs and Moment vs Time graphs
for Part 5 have their peak and lowest values at the same point for all the
suction cups. We can find the maximum and minimum time steps using
those figures which are shown below figure 7.1.1.
60. 60
Figure 7.1.2: The graphs between Time (sec) vs force and moment.
The figure 7.1.2 below shows the stress distribution of Part 1. The
stress as expected, is maximum at the top where it forms a joint with part 2.
Part 2 has a shaft that rotates inside the holes provided in the top of part 1.
The movement of part 2 induce stresses on part 1 on the top. There are also
stresses in the remaining part of the body. Complete blue color doesn’t say
that there are no stresses present at all. The division of these stress ranges
over the scale can be edited using the color plot option in inventor. Reduce
the maximum value and more detail stress distribution is seen. The
maximum stress on this part is 2.101 KSI which is equal to 14.48 MPa.
61. 61
Figure 7.1.3: The stress distribution plot of Part 1.
Similarly, as shown in the figure (load section) in the Loads
section, Part 2 is also connected with a part on both of its ends. The right
end of Part 2 is connected with Part 3. Therefore, the moment on the Part 3
shaft which makes it rotate, have its effect on deflection in Part 2. Also Part
2 is connected to Part 1. So, the maximum stress values are developed at
both the ends of Part 2. In the same way, Part 3 is also connected with a
part at each end. The kind of forces that are acting on Part 3 are similar to
part 2. The most important observation form the stress distribution pictures
down here is that the critical areas (where stresses are maximum) are found
out to be at the ends of both Part 2 and Part 3, not anywhere in the middle.
As we have discussed earlier, we expect the critical areas to be at the ends
due to loading at the ends. If by any chance the critical area is spotted at the
middle of either Part 2 or Part 3, it can be really bad. It is because, if the
stresses are seen maximum at those areas where loading is not more
correspondingly, this means that the stress distribution of that particular
geometry is not proper and tend to fail soon. Both the stress distribution
images for Part 2 and Part 3 are shown below figures 7.1.3 and 7.1.4. The
62. 62
maximum stress found in Part 2 is 2.425 KSI which is equal to 16.71 MPa.
The maximum stress found in Part 3 is 4.607 KSI which is equal to 31.76
MPa.
Figure 7.1.4: The Stress distribution of Part 2.
Figure 7.1.5: The Stress distribution of Part 3 .
63. 63
Part 4 and Part 5 both of them constitutes the end effector. Part 4 shown
below figure 7.1.5 is a smaller part when compared to the size of remaining
parts. It is suspended at the end of part 3 and rotates inside the holes on the
right end of Part 3. It has 2 jobs to do. First one is to carry the weight if the
end effector and move itself in correspondence with Part 2 and Part 3. The
second job is to aid the rotation of end effector on its own axis. Naturally,
as the load is acting on its center, the deformation is expected to be more at
the center. The sides experience less deformation when compared to
centers. The maximum stress on this part shown below figure 7.1.5 is found
out to be 0.235 KSI which is equal to 1.67 MPa.
Figure 7.1.6: The Stress distribution of Part 4.
Part 5 is the backbone of end effector. The only duty it has to hold
the sheet. So the maximum effect created by the pneumatic cylinders and
the sheet is seen on this part. There are a lot of pretreated stresses in this
part as we assume that the pneumatic cylinders are welded to this part (just
to lock the DOFs of the cylinders). But in reality, those cylinders are
assembled using screws and nuts. If observed clearly, we can see that the
64. 64
end effector is provided with the bases with holes and thread rods just for
the cylinders to sit in. Due to the welded joints created on this part, the
stress values that are generated by this simulation might be a bit more than
the values in reality. The stress distribution of part 5 is shown below figure
7.1.6. The maximum stress observed is 15.63 KSI which is equal to 107.13
MPa.
Now, we have the stress distribution data for all the 5 major parts here
but to know whether these stresses are safe or not, we have to check them.
To perform this task, we take the help of the factor of safety concept. But
before we get into this, the values of stresses shown along with these
figures are at one particular time step. But, the whole process is for 7.5
seconds. They also vary with the time and this point has already been
explained along with Time vs Moment plot earlier in this section. To know
where maximum and minimum stress occurs in the whole cycle, we take
the help of Time vs Moment plots of all the parts and take out the
maximum and minimum time steps in those plots. Those values are
tabulated below in table 7.1.7.
Figure 7.1.7: The Stress distribution of Part 5.
65. 65
Table 7.1-1: The Table of maximum and minimum stresses.
PART MAX.
STRESS
TIME
STEP AT
WHICH
MAX.
STRESS
OCCURS
MIN.STRESS TIME STEP
AT WHICH
MIN.
STRESS
OCCURS
1 15.72 MPa 0.54 sec 14.14 MPa 0.136 sec
2 20.408 MPa 0.54 sec 4.52 MPa 0.136 sec
3 4.136 MPa 1.09 sec 1.31 MPa 0 sec
4 6.51 MPa 1.09 0.387 MPa 0 sec
5 15.92 MPa 1.22 sec 4.49 MPa 0 sec
The Factor of Safety is a term describing the load carrying
capacity of a system beyond the expected or actual loads. Essentially, the
factor of safety is how much stronger the system is than it usually needs to
be for an intended load. Safety factors are often calculated using detailed
analysis because comprehensive testing is impractical on many projects,
such as bridges and buildings, but the structure's ability to carry load must
be determined to a reasonable accuracy. Many systems are purposefully
built much stronger than needed for normal usage to allow for emergency
situations, unexpected loads, misuse, or degradation. Factor of safety is the
ratio of Yield stress and Working stress. It gives a value which gives the
load capacity of the part. If Factor of Safety is 1, this means the design can
carry the load exactly that is required to carry. If the value is 2, this means
it can carry twice the required load. Let us see the factor of safety values
generated by Inventor for all the parts.
66. 66
As we see that the Part 5 is not as strong as expected. The safety
factor it has permits it only to carry the load of the sheet, which is good for
this case but we expect the design to be stronger than this. There are many
ways to make this stronger. We can either optimize it and redesign it
accordingly or can try a different material. The Part 5 is the end most part
of the robotic arm. Part 5 showed less load bearing capacity with aluminum
but, we have tried changing the material to CFRP (Carbon Fiber Reinforced
Polymer). The reason for this is it is stronger and lighter material than
aluminum. We cannot assign a material with more density. As density
increases, weight increases and increase in weight of Part 5 might have bad
effects on other arms. Our experiment worked and the part 5 has increased
its capacity. The only problem with CFRP is it is relatively expensive. But
again, selection of materials is a completely different study. We limit our
study to the usage requirements of the industry.
Figure 7.1.8: The FOS of Part 5.
These results that are seen are good at this instant. The model can
take the weight of the sheet and if wanted, it can take more. But, this cannot
67. 67
be taken as the final word. The process in which the robotic arm is going to
be used is a cyclic process. The same kind of loading is applied on the
robotic arm repeatedly for a long period. We must also check for the
approximate number of cycles it can work before it fails. This leads us to
the Fatigue Analysis of the Robotic arm.
7.2 Life Cycles Calculation
Fatigue is the weakening of a material caused by repeatedly applied
loads. It is the progressive and localized structural damage that occurs when
a material is subjected to cyclic loading. The nominal maximum stress
values that cause such damage may be much less than the strength of the
material typically quoted as the ultimate tensile stress limit, or the yield
stress limit. When cyclic stresses are applied to a material, even though the
stresses do not cause plastic deformation, the material may fail due to
fatigue. Fatigue failure is typically modeled by decomposing cyclic stresses
into mean and alternating components. Mean stress is the time average of
the principal stress. The definition of alternating stress varies between
different sources. It is either defined as the difference between the
minimum and the maximum stress, or the difference between the mean and
maximum stress. Engineers try to design mechanisms whose parts are
subjected to a single type (bending, axial, or torsional) of cyclic stress
because this more closely matches experiments used to characterize fatigue
failure in different materials. For this, we need to have an approximate
period where we will be able to asses that the material or design fails after
these many number of cycles.
Fatigue failures are typically characterized as either low-cycle (1,000
cycles). The threshold value dividing low- and high-cycle fatigue is
somewhat arbitrary, but is generally based on the raw materials behaviour
at the microstructural level in response to the applied stresses. Lowcycle
failures typically involve significant plastic deformation. Most metals with
a body centered cubic crystal structure have a characteristic response to
cyclic stresses. These materials have a threshold stress limit below which
fatigue cracks will not initiate. This threshold stress value is often referred
to as the endurance limit. In steels, the life associated with this behaviour is
generally accepted to be 2x10⁶
cycles. In other words, if a given stress state
does not induce a fatigue failure within the first 2x10⁶
cycles, future failure
of the component is considered unlikely. For spring applications, a more
68. 68
realistic threshold life value would be 2x10⁷
cycles. Metals with a face
center cubic crystal structure (e.g. aluminium, austenitic stainless steels,
copper, etc.) do not typically have an endurance limit. For these materials,
fatigue life continues to increase as stress levels decrease; however, a
threshold limit is not typically reached below which infinite life can be
expected. The behaviour of these materials explained above can be
exhibited with the help of S-N diagram, also known as a Wohler curve.
This is a graph of the magnitude of a cyclic stress (S) against the
logarithmic scale of cycles to failure (N). The progression of the S-N curve
can be influenced by many factors such as corrosion, temperature, residual
stresses, and the presence of notches. The Goodman-Line[14] is a method
used to estimate the influence of the mean stress on the fatigue strength.
Goodman relation is mathematically represented as
Where is alternating stress,
is mean stress,
is ultimate stress and
is effective alternating stress.
Let us find the number of cycles to the failure one of the parts in the robotic
arm, for example Part 2. From the table (), we have
Maximum stress, = 4.521 MPa
= 20.408 MPa
From these values we now have,
Stress range =
alternating stress =
mean stress =
69. 69
The material used for this part is Aluminum. The data needed for the
calculation of Number of Cycles is shown below.
The Ultimate tensile strength = 446 MPa
The Material Strength at 103
cycles = 0.95
Since the load acting on the part is bending load the constant value is taken
as 0.95. If it is an axial loading, the constant value is taken as 0.75.
Aluminum has no endurance limit. Some structural metals such as
aluminum and copper, do not have a distinct limit and will eventually fail
even from small stress amplitudes. In these cases, a number of cycles
(usually 107) is chosen to represent the fatigue life of the material.
Endurance Limit for this part =
Where is the experimental value of endurance limit R. R. Moore [15]
experiment?
= ;
= ;
is the surface factor
= where is the surface finish factor [16] which is 4.51
is the exponent which is -0.265
=0.023
is the size factor
= -1.51 ; (51 ) [16]
is generally referred to the diameter of the body. Since non-circular
bodies have no particular diameter, we have to calculate an effective
diameter to formulate the above equation. Considering our part as a
rectangular part, the effective diameter is calculated as shown here.
=0.808 [16]
70. 70
Where = 0.153 mm and = 0.08 mm
= 7.45
is the Loading Factor
=
is the Temperature factor
Where is the tensile stress at the T temperature and
is the tensile stress at the room temperature.
Since, our machine is placed at the working conditions in the room
temperature,
is the Reliability Factor;
is the Miscellaneous-Effects Factor.
Though the factor is intended to account for the reduction in endurance
limit due to all other effects, it is really intended as a reminder that these
must be accounted for. The actual values of are not available.
Now, the endurance limit = 3.825
71. 71
If we take as the stress at number of cycles, the equation to calculate
will be
Where =
=
Z=
The boundary conditions for the materials without endurance limit
(example Aluminum)
Now, considering the Goodman equation,
But we have another equation
N=
Where N is the number of cycles which in case the calculation 4.3 (1017
)
72. 72
7.3 Stress-Cycle (S-N Diagram)
In high-cycle fatigue situations, materials performance is commonly
characterized by an S-N curve. This is a graph of the magnitude of an
Alternating Stress Amplitude ( ) against the logarithmic scale of cycles
to failure (N). We have plot them on the S-N diagram using the above data
in Matlab. The plot obtained is shown below figure 7.3.
Figure 7.3.1: The graph between Time (sec) vs Stress (Mpa).
As we can see the plot above, the blue colored curve shows the
stresses over the time. The red line is the line where we can see the stress
amplitude or fatigue strength of the part which is calculated from the
simulation. Theoretically speaking, the point where these 2 curves meet is
the failure point of the material. But, as we can see that they do not meet,
there is no scope of failure for this part theoretically. The life of the part
ends before 103
cycles, it is the Low Cycle Fatigue. If it lasts till 108
cycles,
it is the High Cycle Fatigue. If the part lasts or more than 108
cycles where
73. 73
the stress curve and endurance limit or fatigue strength become parallel to
each other, then we say it has infinite life. This shows that this part is going
to withstand for a good period of time.
Table 7.3-1: The Table of Number of Cycles to Failure for each part.
Part Number of
Cycles to
Failure
1 5.8 x 10¹⁸
2 4.3 x 10¹⁷
3 3.1 x 10¹⁸
4 1.29 x 10¹⁸
5 6.28 x 10¹⁷
74. 74
8 Summary &Conclusions
8.1 Validation
For any design to be judged as a good design, it has to be proven
that it is useful for the purpose it is made for. In our case, we have analysed
our model by creating the simulation environment which is mostly close to
the actual working conditions and we have obtained some results. Now to
check whether these results are satisfactory, we have to take the Factor of
Safety concept. Factor of safety is generally the ratio of Yield Stress of the
design to the allowable stress. But Inventor has an option to set the ratio
between Ultimate Tensile Stress to the allowable stress. A yield strength or
yield point is the material property defined as the stress at which a material
begins to deform plastically. Prior to the yield point the material will
deform elastically and will return to its original shape when the applied
stress is removed. Ultimate tensile strength is the capacity of a material or
structure to withstand loads tending to elongate, as opposed to compressive
strength, which withstands loads tending to reduce size. In other words,
tensile strength resists tension (being pulled apart), whereas compressive
strength resists compression (being pushed together). Ultimate tensile
strength is measured by the maximum stress that a material can withstand
while being stretched or pulled before breaking. If we observe the Stress-
Strain curve, we can see that the Ultimate tensile strength always comes
after the yield point. This point serves a very important observation.
75. 75
Figure 8.1.1: The Factor of Safety for Part 2.
If the Factor of safety of the parts in robotic arm is more than 3
when the ratio is yield stress to working stress, it will definitely be much
more than 3 if the ratio is Ultimate tensile strength to working stress. This
means, the robotic arm far away from failure even its weight is increased by
unavoidable accessories like servo motors, protective covers and probably a
different and denser end effector. Our study shows that the robotic arm is
not only strong enough for the required use but also strong enough to work
for a long time without failure. Here, the factor of safety simulation figure
8.1 is shown above. All the parts of this robotic arm are having the
minimum factor of safety more than 3 in those areas where the stresses are
more. The table 8.1 below showing the factors of safety along with their
stresses and materials assigned.
76. 76
Table 8.1-1: The Table of Factors of Safety of all Parts
Part Material Minimum Safety
Factor
1 Aluminium 6061,
welded
3.89
2 Aluminium 6061,
welded
3.29
3 Aluminium 6061,
welded
3.5
4 Aluminium 6061,
welded
3.1
5 CFRP 3.38
8.2 Conclusion
The main reason to make the choice of designing a robotic arm,
firstly is the transport of the sheet from the stack to the shearing machine.
Second, there is a space constraint we have in the industry. The stack of the
sheets and the shearing machine are really close to each other. They are so
close that any other kind of transport such as a linear robot (conveyor)
cannot be used. That leaves us with the only choice to build a robotic arm
which can work in small and congested environments. The figure below
shows the location and position of stack and shearing machine and we have
to design a robot arm that fits in this environment. As we observe the
document, we can see that we have tested the robotic arm in all possible
ways such as its load bearing capacity, motion ranges, joints etc. The
motion demonstration of the robotic arm can be seen through the link given
in the appendix. The main task was to design a machine which fits in the
environment and serves the purpose which has been achieved. But this is
not the ultimate design. We tried to cover all the aspects of design and
structural analysis in our work. But there is still a large chance of upgrading
the machine.
77. 77
As far as the current study is concerned, we are successful in
determining the areas in which the stresses occur the most and able to show
that those stresses are in limit also do not cause any considerable damage to
the robot arm. The stress analysis that was performed was the non-linear
stress analysis and all the geometric non-linearity is considered in the
simulation. This shows that the stresses and deformation obtained are very
close to the reality. The duration of the half cycle of the robotic arm in our
simulation is 7.5 seconds, it means the sheet will be picked, transported and
placed at its destination in 7.5 seconds which is really a quick process This
speed might not be compatible in the real life use in the industry. We might
have to slow down the process a bit. This 7.5 seconds time limit isn’t pout
out of blue. After many adjustments, trials, redesigns we have come to this
time from 18 seconds to 7.5 seconds. Our motive to simulate it in such
speed is that, if this machine can with stand motion loads in high speeds
and still be safe, it can definitely be a good machine at lower speeds. The
speeds can always be adjusted by the user.
Figure 8.2.1: The position of Shearing Machine in Industry.
78. 78
8.3 Future Works
Although a good effort is put in building and analysing this system,
this cannot be taken for granted. There are many other parameters on which
the quality of a model is dependent on. The easiest way to design and
analyse a robotic arm is described and explained in this document. We
cannot say it is perfect. In fact, no design is perfect. It is all about how close
you can get to perfection. This model is needed to be optimized. We must
have a detail explanation on what effect could take place on what area of
the robotic arm if a parameter is changed especially design parameters like
volume, thickness, material. Also the cost study is needed to be performed
in a more detail way. After all, a good machine is also judged on how
affordable it can be.
There is always more room for innovation in any study. During this
project, we came across many modern innovative automation techniques
today’s world has developed. If given a chance to do this project again, we
are very much interested in applying those techniques. One such technique
is application of fluidic muscles. A fluidic muscle is artificial version of
human muscle. Not only this, many other techniques are applicable for this
kind of machine. With all these additions, the machine gets upgraded into a
super machine with ultimate application of automation.