Outcome Assessment Study of KCh Television Education for the Advancement of Muslim Mindanao
•
0 likes•107 views

Outcome Assessment Study of KCh Television Education for the Advancement of Muslim Mindanao, Knowledge Channel Impact Studies

Recommended
Recommended
More Related Content
What's hot
Similar to Outcome Assessment Study of KCh Television Education for the Advancement of Muslim Mindanao
Similar to Outcome Assessment Study of KCh Television Education for the Advancement of Muslim Mindanao (20)
More from KnowledgeChannel5
More from KnowledgeChannel5 (11)
Recently uploaded
Recently uploaded (20)
Outcome Assessment Study of KCh Television Education for the Advancement of Muslim Mindanao
- 1. OUTCOME ASSESSMENT STUDY OF KNOWLEDGE CHANNEL’S TELEVISION EDUCATION FOR THE ADVANCEMENT OF MUSLIM MINDANAO (TEAM-M) PROJECT FINAL REPORT MARCH 2008 DENNIS S. MAPA KRISTINE JOY S. BRIONES ALBERT KIRBY A. TARDEO UP Statistical Center Research Foundation, Inc. School of Statistics University of the Philippines, Diliman Quezon City, Philippines All persons have the right to education. However, poverty, ignorance, and corruption are depriving millions of Filipinos the ability to improve their quality of life. Knowledge Channel Foundation, Inc. improves the quality of education through Knowledge Channel. --Knowledge Channel Foundation, Inc. Mission Statement
- 2. Table of Contents I. INTRODUCTION 6 1.1. The Performance of the Philippine Education in an East Asian Context ............ 6 1.2. Effects of School Inputs on Student Achievement ........................................... 10 1.3. Effects of the Knowledge Channel Intervention on Students’ Performance .... 11 1.4. Television Education for the Advancement of Muslim Mindanao (TEAM-M)13 II. RESEARCH DESIGN and OBJECTIVES 14 2.1. Objectives of the Study..................................................................................... 15 2.2 Data Gathering and Survey Operations ............................................................ 17 2.3. Focus Group and Square Table Discussions..................................................... 21 III. PROFILE OF THE RESPONDENTS 22 3.1. School Characteristics....................................................................................... 22 3.2 Improvement in the Retention, Completion and Survival Rates (2005-2007) . 24 3.3. Profile and Perceptions ETV Coordinators and Subject Teachers ................... 28 3.4. Perceptions of the Students............................................................................... 30 IV. FOCUS GROUP DISCUSSIONS (FGD) RESULTS 35 4.1. Zamboanga Sibugay FGD (parents, teachers, and principals).......................... 36 4.1.1. Perceived Effects from Watching Programs of the Knowledge Channel. 38 4.1.2. Problems Encountered and Addressing Them.......................................... 40 4.2. Zamboanga Sibugay FGD (students)................................................................ 43 4.2.1 Viewing at home....................................................................................... 43 4.2.2. Frequency of Knowledge Channel viewing.............................................. 44 4.2.3. Reason and importance............................................................................. 45 4.2.4. Specific Benefits....................................................................................... 46 4.2.5. Knowledge Channel and Subjects ............................................................ 48 4.2.6. Parents and Siblings on Knowledge Channel........................................... 48 4.2.7. Suggestions ............................................................................................... 49 4.3. Square table discussions (Maguindanao, Shariff Kabunsuan, Zamboanga del Sur, Sulu, and Tawi Tawi)............................................................................................ 49 4.3.1. What went right with the Knowledge Channel being introduced in the school (as reported by 4 groups)............................................................................... 50 4.3.2. What went wrong with the Knowledge Channel being introduced in the school (as reported by 3 groups)............................................................................... 51 2
- 3. 4.3.3. Lessons learned from using technology-based educational intervention (as reported by 1 group; Shariff Kabunsuan) ................................................................. 52 4.3.4. Sustainability of the Knowledge Channel (as reported by 3 groups; Shariff Kabunsuan, Sulu, and Zamboanga del Sur).............................................................. 53 4.4. Conclusions....................................................................................................... 54 V. ECONOMETRIC MODEL EXPLAINING THE IMPROVEMENT IN THE NATIONAL ACHIEVEMENT TEST (NAT) SCORES (2005 to 2007) 55 5.1. Comparison of Improvement in the NAT scores: Knowledge Channel vs. Non- Knowledge Channel Schools (2005 to 2007) ............................................................... 56 5.2. Results of the Econometric Models.................................................................. 60 VI. CONCLUSIONS and RECOMMENDATIONS 64 REFERENCES 65 Appendix 1. List of Knowledge Channel and Control Schools Visited 66 Appendix 2. Questionnaires 70 2.1.a. Questionnaire for Principal- Knowledge Channel.............................................. 70 2.1.b. Questionnaire for Principal- Control .................................................................. 72 2.2. Questionnaire for ETV Coordinator- Knowledge Channel school only................ 74 2.3.a. Questionnaire for Subject Teacher- Knowledge Channel................................... 78 2.3.b. Questionnaire for Subject Teacher- Control....................................................... 81 2.4. Questionnaire for Parents....................................................................................... 82 2.5. Questionnaire for Barangay Officials.................................................................... 85 2.6.a Questionnaire for Students- Knowledge Channel................................................ 86 2.6.b. Questionnaire for Students- Control................................................................... 90 Appendix 3. Focus group discussion (FGD) guides 91 3.1. FGD for Principals................................................................................................. 91 3.2. FGD for ETV Coordinators ................................................................................... 92 3.3. FGD for Parents..................................................................................................... 93 3.4. FGD for Students................................................................................................... 94 Appendix 4. Improvement in Academic Scores 97 4.A. Improvement in the MATHEMATICS scores (2005 to 2007) of KCH and Non- KCH Schools (by Province).......................................................................................... 97 4.B. Improvement in the SCIENCE scores (2005 to 2007) of KCH and Non-KCH Schools (by Province)................................................................................................... 98 3
- 4. 4.C. Improvement in the ENGLISH scores (2005 to 2007) of KCH and Non-KCH Schools (by Province)................................................................................................... 98 List of Tables Table 1. Educational Attainment of the Adult Population of Selected countries by Age Group* ........................................................................................................................ 8 Table 2. Math and Science Scores/Ranks in the Trends in International Mathematics and Science Study (TIMSS) of Selected Countries *........................................................ 8 Table 3. Schools Included in the Impact Study by Province............................................ 16 Table 4. Number of Principal who Participated in the Impact Study by Province........... 18 Table 5. Number of ETV Coordinators who Participated in the Impact Study by Province ................................................................................................................................... 18 Table 6. Number of Subject Teachers who Participated in the Impact Study by Province ................................................................................................................................... 19 Table 7. Number of Subject Teachers who Participated in the Impact Study by Province ................................................................................................................................... 19 Table 8. Number of Subject Teachers who Participated in the Impact Study by Province ................................................................................................................................... 20 Table 9. Number of Students who Participated in the Impact Study by Province............ 20 Table 10. Student Population of Elementary Schools ...................................................... 22 Table 11. Number of Students Per School (Average for the Province)............................ 23 Table 12. Average Number of Students for Every Teacher.............................................. 24 Table 13. Average Number of Students per Section......................................................... 24 Table 14. Percentage of Teachers who Attended Training of KCH................................. 28 Table 15. Number of seminars attended as ETV Coordinator.......................................... 29 Table 16. How much the viewing plan is achieved ......................................................... 30 Table 17. How students go to school................................................................................ 30 Table 18. Travel time in going to school......................................................................... 31 Table 19. Frequency of viewing KCh programs in school.............................................. 31 Table 20. How much of is program is viewed................................................................. 32 Table 21. Teacher presence during viewing .................................................................... 33 Table 22. Teacher discussion after viewing..................................................................... 34 Table 23. Gaano kahalaga at nakakatulong ang mga sumusunod na programa ng Knowledge Channel? (ELEMENTARY) ................................................................. 35 Table 24. Improvement in the NAT scores and its Sub-Components (2005 to 2007) of Knowledge Channel and Non-Knowledge Channel Schools ................................... 57 Table 25. Improvement in the NAT scores and its Sub-Components (2005 to 2007) of KCH and Non-KCH Schools (Non-ARMM elementary schools)............................ 58 Table 26. Improvement in the NAT scores and its Sub-Components (2005 to 2007) of KCH and non-KCH Schools (ARMM elementary schools)..................................... 59 Table 27. Improvement in the NAT scores (2005 to 2007) of KCH and Non-KCH Schools (by Province)............................................................................................... 59 4
- 5. Table 28. Regression Models for the Determinants of the Improvement in NAT and Science Scores (2005 to 2007).................................................................................. 60 Table 29. Regression Models for the Determinants of the Improvement in NAT Scores (2005 to 2007)........................................................................................................... 62 Table 30. Comparison of the Proportion of Poor Households in the ARMM and Non- ARMM Municipalities in 2003) ............................................................................... 63 List of Figures Figure 1. Retention Rates of Knowledge Channel and Non-Knowledge Channel Schools (2005 to 2007)........................................................................................................... 26 Figure 2. Completion Rates of Knowledge Channel and Non-Knowledge Channel Schools (2005 to 2007)............................................................................................. 27 Figure 3. Survival Rates of Knowledge Channel and Non-Knowledge Channel Schools (2005 to 2007)........................................................................................................... 27 Figure 4. Framework of the Econometric Model.............................................................. 56 OUTCOME ASSESSMENT STUDY OF KNOWLEDGE CHANNEL’S TEAM MINDANAO PROJECT 5
- 6. I. INTRODUCTION The Philippines has been laggard with respect to economic performance compared to its East Asian neighbors. In fact the Philippines is one of the few countries (if not the only one) that missed the so-called “East Asian Miracle” – the several decades of economic growth and poverty reduction experienced by most countries in East and Southeast Asia, beginning in the 1960s. This is due to a number of factors, a major part being the onslaught of political turmoil (past and present) and the debt crisis during the mid-1980s, which the country never fully recovered from. The country’s rapid population growth and the slow investment in the needed infrastructure which made the country less attractive to foreign direct investments (FDI) are among the reasons why the economy has been left behind.. Aside from the factors mentioned above, human capital, in the form of education of the country’s citizens, has also an important direct effect on the country’s economic well being. Several studies, using cross-country and intra-country (provincial) data, have shown the importance of education of the people on the growth of the economy. Barro and Xala-i-Martin (2004), have shown that the level of schooling (measured as number of years of schooling) of males raises the rate at which the economy grows. The cross-country study of Mapa and Balisacan (2004) has also shown that functional literacy rate (a proxy for human capital) has a positive and significant impact on the income growth of a country. More recently Mapa, Balisacan and Briones (2007), using Philippine provincial data from 1985 to 2003, showed that a one year increase in schooling of the household head increases provincial per capita income by about 0.28 percentage points per year. 1.1. The Performance of the Philippine Education in an East Asian Context 6
- 7. While empirical evidence supports the significant linkage between education and growth the country’s performance in the education sector has been dismal. Data from the Department of Education (DepEd) and the National Statistical Coordination Board (NSCB) show that the cohort survival rate (CSR) for elementary schools has gone down from 69.47% in school year 2002-2003 to 63.57% in SY 2003-2004 and 64.87% in SY 2004-2005. For secondary schools, the figures are even more disturbing – CSR decreased from 63.88% in SY 2002-2003, to 60.41% in SY 2003-2004 and 61.33% in SY 2004- 2005. This means that out of 100 pupils who begin in the elementary level, 35 fail to finish; in secondary schools, out of the 100 students who start their first year in high school, 39 do not finish and won’t have a high school diploma. . Moreover, the data on net participation rate (NPR) show a depressing picture. From 83.30% in SY 2002-2003, the NPR for elementary schools went down to 81.72% in SY 2003-2004 and further down to 76.06% in SY 2004-2005. The figures for the secondary schools are even bothersome with NPRs of 45.56% in SY 2002-2003, 47.03% in SY 2003-2004 and 42.50% in SY 2004-2005. This means more than half of the youth who should be in high school are actually out of school. This will surely create problems in the future since more than half of the Filipinos who will be joining the labor force in the future would be without the necessary tools to drive the Philippine economy forward (Virola, 2006). The country’s performance in educating its youth pales in comparison with our East Asian neighbors. According to Virola (2007), using data from the UNESCO’s Institute of Statistics, “in terms of educational attainment, the overall standing of the country is quite good but the emerging trend portends of a bleak future.” One reason for this is shown in table 1. The proportion of Filipinos among those aged 15 to 34 years who completed at least primary education is at 88-91%. This is lower than that in three ASEAN countries (namely Indonesia, Malaysia, and Thailand) participating in the World Economic Indicators (WEI) program at 92- 99%. Moreover, when it comes to the completion in lower secondary education, 7
- 8. while the country is still ahead of Indonesia and Thailand, it lagged behind Malaysia by 13%. Table 1. Educational Attainment of the Adult Population of Selected countries by Age Group* Age Group Year 25-64 15-19 20-24 25-34 35-44 45-54 55-64 At least completed primary education Indonesia 2003/04 81 97 93 93 84 73 48 Malaysia 2003 93 99 98 98 95 90 76 Philippines 2003/04 82 90 91 88 84 78 67 Thailand 2004/05 55 97 95 92 54 25 16 WEI Average of selected countries 2004 78 96 94 93 79 67 52 WEI Average of all countries 2004 81 95 94 91 84 76 63 At least completed lower secondary education Indonesia 2003/04 42 60 63 55 42 31 17 Malaysia 2003 65 93 88 83 71 49 26 Philippines 2003/04 64 80 82 74 66 55 40 Thailand 2004/05 33 73 74 50 33 20 13 WEI Average of selected countries 2004 50 77 77 66 53 39 24 WEI Average of all countries 2004 57 73 76 69 60 51 36 Sources: UNESCO/UIS WEI (www.uis.unesco.org/publications/wei2006) OECD countries (www.oecd.org/edu/eag2006) Notes: … data are not available; n. – magnitude is negligible; * Table 1 was taken from Virola (2007) When it comes to the quality of education being delivered, the Philippines is also behind its neighboring countries. The results of the 2003 Trends in International Mathematics and Science Study (TIMSS), shown in table 2, tell us that among the 45 countries that participated in the TIMSS for eighth-grade students, the Philippines ranked 41st in Math and 42nd in Science. The country is scrapping the bottom of the barrel when it comes to Science and Mathematics performance. Moreover, the country’s average score was more than 100 points lower than Malaysia and more than 200 points lower than the first ranked country, Singapore. Virola (2007) also noted that among the 25 countries that joined the study among fourth-grade students, the Philippines ranked 23rd in both Mathematics and Science, with the country’s average score being more than 200 points lower than the first- ranked country, Singapore. Table 2. Math and Science Scores/Ranks in the Trends in International Mathematics and Science Study (TIMSS) of Selected Countries * 8
- 9. Scores and Ranks for Eighth-Grade Students, 2003 Country Math Score Math Rank Science Score Science Rank International Average 466 473 Philippines 378 41 377 42 Indonesia 411 34 420 36 Malaysia 508 10 510 20 Singapore 605 1 578 1 Japan 570 5 552 6 USA 504 15 527 9 Scores and Ranks for Fourth-Grade Students, 2003 International Average 495 489 Philippines 358 23 332 23 Chinese Taipei 564 4 551 2 Hongkong SAR 575 2 542 4 Singapore 594 1 565 1 Japan 565 3 543 3 USA 518 12 536 6 Source: International Association for the Evaluation of Educational Achievement; * Table 2 was taken from Virola (2007) With this seemingly insurmountable task of improving the quality of education of the youth in the country and with the hope of contributing to the vision of a community of educated, empowered, and responsible citizens working relentlessly for better Philippines, the Knowledge Channel Foundation, Inc., originally under the name Sky Foundation, Inc., was incorporated in 1999 with the Philippine Securities and Exchange Commission. A non-profit foundation, the channel went on air on November 6, 1999 providing curriculum- and non-curriculum-based programs on cable television that supplemented the Department of Education’s (DepEd) curriculum. In 2000, KCFI entered into a 10-year MOA with DepEd, with the DepEd proclaiming the channel as mandatory viewing in all public schools. Today, the Knowledge Channel is available to over 2.67 million public school students in 1,528 public elementary and high schools in 40 provinces in all regions of the country, and has an expanded household viewer-ship in 58 provinces. However, this figure is still small since out of almost 42,000 public schools throughout the country, only 3.6% have access to Knowledge Channel. With the use of an intervention, the use of television programs to augment the curriculum 9
- 10. in the public schools, Knowledge Channel hopes contribute to improving the quality of education in the country. While television viewing might improve the learning process of the students thereby improving their performance, there are other factors that contribute to the student’s achievement and these factors, together with the empirical evidences, are reviewed next. 1.2. Effects of School Inputs on Student Achievement Numerous studies have been done in trying to identify the relationship existing between student achievement, usually measured by achievement tests, and school inputs the students’ receive. School inputs usually identified in various studies include class size, characteristics of teachers including teacher education and teacher experience, teacher salaries, and school expenditure. While smaller class sizes are shown to provide short-term and long-term benefits (Mosteller, 1999), investing in school resources, such as learning materials and school hardware, improves student performance, boosts promotion rates, and lowers grade repetition (Harbison and Hanushek, 1992). On the other hand, Angrist and Lavy (1998) estimated the effect of in-service teacher training on children’s reading and mathematics achievement and found out that the training received by teachers led to an improvement in their students’ test scores. The estimates suggest that teacher training provided a less costly means of increasing test scores than reducing class size or adding school hours. A study by Quimbo (2003) explained Math and Science achievement of public school children in the Philippines using survey data. The results show that younger children post higher scores in all grade levels1 while the male indicator variable is statistically significant and negatively correlated with both Math and Science scores in all grade levels. This means that male students tend to get lower average scores than female pupils, all things being the same. From the joint tests of significance still from the study of Quimbo (2003), it was proven that the presence of school and home learning materials, 1 This supports the hypothesis that older students in each cohort tend to be those who repeated or dropped out from a previous grade level. 10
- 11. regardless of type and combinations, as well as the “effective” presence of teacher (not being absent or being present but not teaching) generally have an impact on scores in all grade levels. On the other hand, however, individual tests of significance show that the specific impacts of combinations of school and home inputs as well as teacher types vary widely across subjects and grade levels. Specifically, television, as a part of school inputs, was found to help improve Math and Science scores for older children. Kobayashi (2005) studied the effectiveness of school inputs on students’ performance, measured as the difference in the National Sample-Based Assessment (NSBA) test scores in 1999 and 2003, in public elementary schools in 23 provinces in the Philippines. The paper explored the effectiveness of school inputs through an investigation of the achievements of an educational project currently being implemented in the Philippines with external financing from the World Bank and the Japan Bank for International Cooperation (JBIC). The study focused on the Third Elementary Education Project (TEEP), a nine-year public investment program which aims to improve the quality of elementary education in the country’s 23 poor provinces by providing multiple school inputs such as classroom rehabilitation, textbooks, teacher training, and school management enhancement. Using data from National Sample-Based Assessment (NSBA) test scores in 1999 and 2003, the study showed that student achievement of TEEP schools improved at a significantly higher rate than that of non-TEEP schools. A further statistical analysis revealed that the variation in score gains is associated with two project components: teacher training, the number of teachers who participated in In-Service Training (INSET) program through TEEP between 1999 and 2003, and school facilities measured as the amount of loan disbursed under School Building Project (the data are in thousands of Filipino Pesos standardized by number of students and used as the school facility variable in the model). The results also indicate that the project inputs are more effective in large schools than in small schools. 1.3. Effects of the Knowledge Channel Intervention on Students’ Performance 11
- 12. Knowledge Channel commissioned studies to evaluate the impact of its programs on the students. Liwag (2000) studied 119 students from 2 pilot schools during the third quarter of SY 1999-2000. Experimental classes (those who viewed Knowledge Channel programs) filled out the Student Appear Questionnaire (SAQ) which comprehensively assessed students’ perceptions and opinions of the Knowledge Channel’s programming, schedule, delivery appeal, and impact on their learning. From the questionnaires, it was found out that in terms of viewing frequency and conditions, 72% of the students were able to view between 2-5 programs on the KC during the evaluation period while Science students view the most number of shows (6 or more). Two-thirds of the students were able to see the programs in their entirety and classrooms were the usual venues for viewing while 89% had to move from their usual classroom to view the programs. In almost all cases, their teachers accompanied them in watching the shows. When it comes to integration of Knowledge Channel with classroom lessons, 89% of the students reported that their teachers facilitated a class discussion about the KC programs (but only 66% in Math). While 56% said they were given KC related seatwork or homework, 2/3 claimed that their teachers assessed them on their learning from the TV programs. 89% agreed with the statement that the programs on the KC were relevant and related to their classroom lessons. On average, students found the programs highly interesting, just right in length, and a source of a lot of learning. They expressed the desire for their teachers to continue using the KC in teaching Math, Science, and English. But on the other hand, students had some difficulty comprehending the hosts of the programs and felt that they could follow the lessons better if they were not in English (for Math and Science) and students claimed that often times, they actually understood their teachers’ explanations better than the explanations in the videos. Based on the study, some improvements for the channel were suggested. These include the medium of instruction used, the comprehensibility of narration, and the length of the videos (longer if possible). Students said that physical viewing conditions should be improved and that more episodes be added. 12
- 13. In 2006, Knowledge Channel commissioned a study entitled “Impact Evaluation of the Programs of Knowledge Channel on the Performance of the Schools in the National Achievement Test (NAT)” to examined the impact of the programs of Knowledge Channel on school-average student performance, measured in terms of the National Achievement Test (NAT) results. The study was conducted by a group of researchers from the University of the Philippines Diliman, headed by Dennis S. Mapa. In the study an econometric model that explains the determinants of student performance was constructed. The set of determinants include an intervention variable which is the presence of the Knowledge Channel in the schools. The other determinants of school- average student performance identified include: School Facility, School Population, Location, Textbook-to-Pupil ratio, Percentage of Teachers with graduate studies, Measure of Infrastructure of the City/Municipality where the school is located and City/Municipality Income to proxy for capital spending. The study covered 101 Knowledge Channel elementary schools and 32 non-Knowledge Channel elementary schools. The results of the study showed that there is a positive and significant relationship between the presence of Knowledge Channel and in the improvement of NAT scores and its sub-components (particularly Mathematics and Science) from 2004 to 2006, conditioned on the fact that the Knowledge Channel facilities are being utilized regularly by the students. In the Knowledge Channel schools with high level of utilization, NAT scores and the sub-components (Science, Math and English) increase by an average of at least 2 percentage points per year, all things being the same. Moreover, the presence of Knowledge Channel created a lot of excitement on the part of the students. This excitement and interest shown by the students have motivated teachers to make use of the programs of Knowledge Channel into the classroom discussions. 1.4. Television Education for the Advancement of Muslim Mindanao (TEAM-M) The Television Education for the Advancement of Muslim Mindanao (TEAM-Mindanao) is a 3-year United States Agency for International Development (USAID)-funded project that seeks to improve the quality of basic public education in the Autonomous Region in 13
- 14. Muslim Mindanao (ARMM), Regions IX and XII through communications technology. The major component of the project involves the provision of the Knowledge Channel (KCh) with its curriculum-based programs to public schools. Through educational television (ETV), the academic performance of grade and high school students watching KCh in these schools is expected to improve in English, Math, and Science. With better education, it is believed, they stand a greater chance to make a better life for themselves and their families. While initial indicators (such as the principals’ observations of increase attendance rate, teachers’ observations of increasing level of interest among students watching Knowledge Channel), suggest that the intervention (presence of Knowledge Channel) has increased the level of awareness of the students watching it, there is a need to assess the impact of the project quantitatively. The purpose of the assessment study is to measure the impact of the programs of Knowledge Channel on the average performance of the students watching these programs. The measures of academic performance are identified as any of the following: (a) National Achievement Test (NAT) scores (b) Regional Achievement Test (RAT) scores – if available (c) Division Achievement Test (DAT) scores – if available (d) School’s Retention Rate The performance of the students will be measured using data from the one hundred fifty (150) schools with Knowledge Channel programs in the three (3) regions in Mindanao. This will be done by constructing an econometric model that will capture the determinants of student’s performance and incorporating into the model an intervention variable – presence of knowledge channel. II. RESEARCH DESIGN and OBJECTIVES 14
- 15. 2.1. Objectives of the Study The study shall determine the impact of the Knowledge Channel programs on the performance of the students (averaged for the school) viewing it, using existing data from about 150 elementary and secondary schools where Knowledge Channel has intervened. Students’ performance is measured through the National Achievement Test (NAT) results for the period 2005 to 2007. The variable of interest is the improvement in the NAT scores, measured as, 2005 2007 2007 2005 NAT NAT NAT − = Δ − This study uses 2005 as the starting year because it was in this year that Knowledge Channel started with the intervention for the TEAM-M project. There were 146 Knowledge Channel schools and 46 Non-Knowledge Channel schools that were covered by the study. The schools classified according to provinces are given in table 3 below. While the schools covered by the TEAM-M project includes both public elementary and high schools, the econometric model will only include elementary schools and not high schools since majority of the schools covered by the project are elementary schools, numbering to about 134 schools. Specifically, the study aims to: a. Carry out a comparative evaluation between KCh-supplied schools (experimental group) versus schools without KCh (control group) to determine if having Educational Television (ETV) makes a difference in the quantitative academic performance of students (improvement in the NAT scores). Aside from the quantitative comparison, a qualitative portion of the evaluation will be made. It seeks to find out if there has been an attitudinal and/or behavioral change (absenteeism, rise/drop in enrollment, and renewed/lessened sense of teaching/learning) amongst the students and the teachers of KCh schools. 15
- 16. b. Carry out a comparative evaluation between KCh-supplied schools with low KCh usage rates and those with high usage rates; the reasons behind the acceptance or rejection of the educational intervention by the school. c. Make recommendations on how KCh can be more effectively utilized in public schools. The study shall take into consideration the relationship between key variables (capacity of the viewing room, school environment, teachers’ competencies, teachers’ training on ETV as an instructional tool, PTCA involvement in school activities etc.) that affect the level of the effectiveness of the project. Table 3. Schools Included in the Impact Study by Province TYPE OF SCHOOL PROVINCE With KCH Without KCH Elementary Basilan 7 2 CotabatoCity 1 0 Maguindanao 23 9 North Cotabato 19 9 Sharif Kabunsuan 20 11 Sulu 16 5 Tawi-Tawi 20 4 Zamboanga del Sur 15 3 Zamboanga Sibugay 13 3 TOTAL 134 46 High School Basilan 1 0 Maguindanao 2 0 Sharif Kabunsuan 4 0 Tawi-Tawi 1 0 Zamboanga Sibugay 1 0 TOTAL 9 0 Primary Maguindanao 1 0 GRAND TOTAL 144 46 Data collection was done through school visits to the different cities and municipalities. These schools, where Knowledge Channel is present, will be referred to as the experimental schools. In addition to the experimental group, the research team also collected data on schools that will serve as the “control group.” The control group consists of schools without Knowledge Channel facilities. These schools (46 public elementary schools) were selected in such a way that the schools’ profile (students 16
- 17. population, teacher-student ratio, etc,) are the similar with the schools included in the experimental sample to ensure that the only difference between the experimental group and the control group is the presence of the Knowledge Channel. The information obtained from 134 experimental schools and 46 control schools will be used to build the econometric model. The list of experimental and control schools are provided in appendix 1. 2.2 Data Gathering and Survey Operations The survey operations for the Impact Evaluation Study of TEAMM Schools were conducted from October 15 to November 30, 2007. Six (6) groups of respondents were interviewed for the study, namely: (1) School Principals (for both TEAMM and Non-TEAMM schools); (2) Subject Teachers (for both TEAMM and Non-TEAMM schools); (3) Barangay Officials (TEAMM schools); (4) PTCA Officers (TEAMM schools); (5) ETV Coordinators (TEAMM schools); and (6) Students (TEAMM and Non-TEAMM schools). Data from the different respondents were collected using structured questionnaires (please refer appendix 2 for the questionnaires used in the survey). At the end of the survey operations, the following number of respondents participated in the Impact Evaluation Study of TEAMM: Type of Respondent Number of Respondents 1. Principal 193 a. TEAMM schools 146 17
- 18. b. Non-TEAMM schools 47 2. Subject Teachers 370 a. TEAMM Schools 295 b. Non-TEAMM 75 3. Barangay Officials (TEAMM Schools) 102 4. PTCA Officers (TEAMM Schools) 165 5. ETV Coordinators 146 6. Students 8855 a. TEAMM Schools 6620 b. Non-TEAMM Schools 2235 Table 4. Number of Principal who Participated in the Impact Study by Province TYPE OF SCHOOL PROVINCE With KCH Without KCH Elementary Basilan 7 2 CotabatoCity 1 0 Maguindanao 23 9 North Cotabato 19 9 Sharif Kabunsuan 20 11 Sulu 16 5 Tawi-Tawi 20 4 Zamboanga del Sur 15 3 Zamboanga Sibugay 13 3 TOTAL 134 46 High School Basilan 1 0 Maguindanao 2 0 Sharif Kabunsuan 4 0 Tawi-Tawi 1 0 Zamboanga Sibugay 1 0 TOTAL 9 0 Primary Maguindanao 1 0 GRAND TOTAL 144 46 Table 5. Number of ETV Coordinators who Participated in the Impact Study by Province TYPE PROVINCE Frequency Percent Elementary Basilan 7 5.22 CotabatoCity 1 0.75 18
- 19. Maguindanao 21 15.67 North Cotabato 19 14.18 Sharif Kabunsuan 21 15.67 Sulu 16 11.94 Tawi-Tawi 20 14.93 Zamboanga del Sur 16 11.94 Zamboanga Sibugay 13 9.70 TOTAL 134 100.00 High School Basilan 1 12.50 Maguindanao 2 25.00 Sharif Kabunsuan 3 37.50 Tawi-Tawi 1 12.50 Zamboanga Sibugay 1 12.50 TOTAL 8 100.00 Primary Maguindanao 1 100.00 GRAND TOTAL 143 Table 6. Number of Subject Teachers who Participated in the Impact Study by Province TYPE PROVINCE Frequency Percent Elementary Basilan 21 7.66 CotabatoCity 2 0.73 Maguindanao 23 8.39 North Cotabato 27 9.85 Sharif Kabunsuan 30 10.95 Sulu 48 17.52 Tawi-Tawi 60 21.90 Zamboanga del Sur 24 8.76 Zamboanga Sibugay 39 14.23 TOTAL 274 100.00 High School Basilan 3 15.79 Maguindanao 6 31.58 Sharif Kabunsuan 5 26.32 Tawi-Tawi 2 10.53 Zamboanga Sibugay 3 15.79 TOTAL 19 100.00 Primary Maguindanao 2 100.00 GRAND TOTAL 295 Table 7. Number of Subject Teachers who Participated in the Impact Study by Province Province Frequency Percent Basilan 8 7.84 CotabatoCity 6 5.88 19
- 20. Maguindanao 5 4.90 North Cotabato 7 6.86 Sharif Kabunsuan 16 15.69 Sulu 16 15.69 Tawi-Tawi 18 17.65 Zamboanga del Sur 11 10.78 Zamboanga Sibugay 15 14.71 TOTAL 102 100.00 Table 8. Number of Subject Teachers who Participated in the Impact Study by Province Province Frequency Percent Elementary Schools Basilan 7 4.46 Cotabato 3 1.91 Maguindanao 12 7.64 North Cotabato 37 23.57 Sharif Kabunsuan 27 17.20 Sulu 16 10.19 Tawi-Tawi 20 12.74 Zamboanga del Sur 21 13.38 Zamboanga Sibugay 14 8.92 TOTAL 157 100.00 High Schools BASILAN 1 12.50 SHARIF KABUNSUAN 5 62.50 TAWI-TAWI 1 12.50 ZAMBOANGA SIBUGAY 1 12.50 TOTAL 8 100.00 Table 9. Number of Students who Participated in the Impact Study by Province Type of School Province With KCH Without KCH Elementary BASILAN 99 350 20
- 21. COTABATO CITY 50 0 MAGUINDANAO 1015 473 NORTH COTABATO 936 349 SHARIF KABUNSUAN 1004 519 SULU 802 254 TAWI-TAWI 1003 202 ZAMBOANGA DEL SUR 701 139 ZAMBOANGA SIBUGAY 699 200 TOTAL 6309 2486 High school BASILAN 50 0 MAGUINDANAO 93 0 SHARIF KABUNSUAN 148 0 TAWI-TAWI 50 0 ZAMBOANGA SIBUGAY 49 0 TOTAL 390 0 GRAND TOTAL 6699 2486 2.3. Focus Group and Square Table Discussions. In addition to the survey conducted for the impact study, focus group discussions (FGDs) and square table discussions were also conducted with the various stakeholders (students, parents, teachers and principals) in different provinces. FGDs were conducted in Zamboanga Sibugay last November 16, 2007 where representatives (principals, ETV coordinators, subject teachers, parents and students) from 10 schools in the district participated in the whole day activity. In addition to the FGDs, square table discussion with five different groups of stakeholders were held in Maguindanao, Shariff Kabunsuan, Zamboanga del Sur, Sulu, and Tawi Tawi last December 10 to 23, 2007. Participants of the workshop are the supervisors and principals, ETV coordinators, and PTCA officials, specifically the presidents. The forums’ main objective is to gather information on the impact of the Knowledge Channel intervention in their respective schools that may have been missed ut in the survey operations. The forums also tackled the positive and negative effects of the introduction of the Knowledge Channel in the schools covered by the TEAM-M project. 21
- 22. The guide questionnaires used in the focus group discussions held in Zamboanga Sigubay is found in appendix 3. III. PROFILE OF THE RESPONDENTS 3.1. School Characteristics Majority of the schools covered by the study can be classified as “small schools” in terms of student population. About 70% of the elementary schools have population of less than 500 students (about 2 sections per grade level) and 92% of the schools have population less than 1000 students. Tables 10 and 11 provide the summary of the over-all student population (for elementary schools) and student population per province visited by the research team. Table 10. Student Population of Elementary Schools Students Population Number of Schools Percent less than 500 124 70.06 500 to 999 38 21.47 1000 to 1499 11 6.21 1500 to 1999 3 1.69 2000 to 2500 1 0.56 Total 177 100 The school’s student population plays an important role whether the school is able to maximize its utilization rate (that is, if all students are able to watch all the required programs of the Knowledge Channel). In the previous study by the research team for schools in Luzon and the Visayas, it was found out that having a large student population creates hindrance on the schools’ utilization or viewing rate. Given a limited resources such as television set (usually 1 per school) and viewing room (usually 1 room that can accommodate 1 section), that study showed that as student population increases, the opportunity of viewing the programs of Knowledge Channel by the students decreases. The level of maximum (full) utilization based on the actual programs of Knowledge Channel shown per week, is achieved for schools with a maximum of 900 students (about 22
- 23. 3 sections per grade level). In other words, the school with one television set can accommodate only a maximum of 900 students that are able to watch all the weekly programs of the Knowledge Channel. If the student population is higher than 900 (say greater than 3 sections), then there will be some students who will be not given an opportunity to watch all the programs of the Knowledge Channel. Thus, we can say that a small student population is a necessary condition for maximum utilization. Table 11. Number of Students Per School (Average for the Province) School Level Province Type of School No. of Schools Min Max Mean Elementary BASILAN WITHOUT KCH 2 360 849 605 WITH KCH 7 174 414 309 COTABATO CITY WITH KCH 1 709 709 709 MAGUINDANAO WITHOUT KCH 8 297 2310 685 WITH KCH 22 145 1202 510 NORTH COTABATO WITHOUT KCH 9 162 435 294 WITH KCH 19 180 752 325 SHARIF KABUNSUAN WITHOUT KCH 11 215 669 356 WITH KCH 20 249 1785 669 SULU WITHOUT KCH 5 194 463 325 WITH KCH 16 203 1363 469 TAWI-TAWI WITHOUT KCH 4 364 1090 582 WITH KCH 20 226 1169 550 ZAMBOANGA DEL SUR WITHOUT KCH 3 192 211 203 WITH KCH 15 179 1466 441 ZAMBOANGA SIBUGAY WITHOUT KCH 3 327 577 447 WITH KCH 13 187 1709 674 High School BASILAN WITH KCH 1 323 323 323 MAGUINDANAO WITH KCH 2 359 1670 1015 SHARIF KABUNSUAN WITH KCH 3 278 1601 818 TAWI-TAWI WITH KCH 1 243 243 243 ZAMBOANGA SIBUGAY WITH KCH 1 853 853 853 Primary MAGUINDANAO WITH KCH 1 173 173 173 The other factors that also play important roles on the students’ performance are the class size and the students-teacher ratio. It has been shown that smaller class sizes have shown to provide short-term and long-term benefits in improving student performance (Mosteller, 1999). Tables 12 and 13 below show that average students-teacher ratio and 23
- 24. the average class size for the schools covered by the study for both KCh and Non-KCh schools. Table 12. Average Number of Students for Every Teacher School Level Type of School No. of Schools Min Max Mean Std. Dev. Elementary WITHOUT KCH 45 27.50 109.00 52.14 18.51 WITH KCH 132 24.17 215.50 54.99 32.90 High School WITH KCH 8 22.15 55.67 33.80 12.17 Primary WITH KCH 1 57.67 57.67 57.67 The average number of students per one teacher in the elementary level for Knowledge Channel schools is about 55 students per teacher which is slightly higher than the average in the Non-Knowledge Channel schools, about 52, albeit not significantly different from each other. What is noticeable is the fact that there are schools, particularly in the Autonomous Region of Muslim Mindanao (ARMM) where the average number of students per a single teacher is more that 200! The reason being is that not all teaching positions have been filled up, thereby increasing the student-teacher ratio. The average class size is around 45 students per section for both the Knowledge Channel and Non- Knowledge Channel schools. However, there are schools that can be considered as “outliers” with more that 70 students per section. Table 13. Average Number of Students per Section School Level Type of School No. of Schools Min Max Mean Std. Dev. Elementary WITHOUT KCH 45 16.50 74.17 45.21 13.05 WITH KCH 132 24.17 89.57 45.78 12.40 High School WITH KCH 8 35.89 72.61 48.85 13.86 Primary WITH KCH 1 57.67 57.67 57.67 3.2 Improvement in the Retention, Completion and Survival Rates (2005-2007) 24
- 25. The research team looked into the performance of the Knowledge Channel schools on the three (3) commonly used school indicators, namely: retention, completion and survival rates, vis-à-vis the performance of schools without Knowledge Channel. The schools indicators are defined by the Department of Education (DepEd) as follows: 1. Retention Rate - the proportion of the enrollment in any school year that continues to be in school the following year. 2. Completion Rate - the percentage of first year entrants in a cycle of education surviving to the end of the cycle. 3. Survival Rate (Cohort) - the population of enrollees in the beginning grade or year who reach the final grade or year at the end of the required number of years of study. Figure 1 below shows the retention rates of the two groups of elementary schools (KCH and Non-KCH) from 2005 to 2007. On one hand, the average retention rate of elementary schools with Knowledge Channel at the start of the TEAM Mindanao project (2005) is about 83.48 percent and increasing to 84.23 percent at the end of the project (2007). The slight increase is not significantly different from zero. On the other hand, the retention rates for Non-Knowledge Channel elementary schools is more volatile, starting with 79.45 percent in 2005 and increasing to 83.62 percent in 2006 and decreasing to 81.95 percent in 2007. Just as in the Knowledge Channel schools, the incremental yearly increase in the retention rate for Non-Knowledge Channel schools is not significantly different from zero. In other words, the retention rates in 2007 for both groups are not significantly different when compared to the 2005 figures. 25
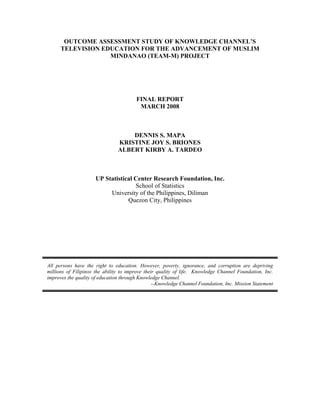
- 26. Figure 1. Retention Rates of Knowledge Channel and Non-Knowledge Channel Schools (2005 to 2007) Retention Rates for Years 2005 to 2007 83.48 83.23 79.45 83.62 81.95 84.23 75 77 79 81 83 85 2005 2006 2007 Year Retention Rate (in%) KCH Non_KCH The completion rates for Knowledge Channel and Non-Knowledge Channel schools are shown in figure 2 below. The average completion rate for Knowledge Channel schools in 2007 (75.42%) is significantly higher compared to the 2006 figure (72.56%). On the other hand, the completion rate for non-Knowledge Channel schools has been decreasing since 2005. In fact, the completion rate of 62.09% in 2007 for non-KCh schools is significantly lower when compared to the 2006 figure of 65.42%. The increase in completion rate was also observed by the principals during the square table discussions where they cited as the positive effects of presence of Knowledge Channel include an increase in enrollment while at the same time a decrease in the absences of students. ETV coordinators also observed a decrease in drop-out rates since it encourages students to go to school. Moreover, the PTCA presidents said that with the introduction of Knowledge Channel, their children are encouraged to go to school. 26
- 27. Figure 2. Completion Rates of Knowledge Channel and Non-Knowledge Channel Schools (2005 to 2007) 75.01 65.42 72.56 75.42 62.09 67.23 30 35 40 45 50 55 60 65 70 75 80 2005 2006 2007 Year Completion Rate KCH Non_KCH The survival rates for the period 2005 to 2007 of Knowledge Channel and non- Knowledge Channel elementary schools are given in figure 3 below. While the effect of any intervention of the survival rate takes longer period (at least six years for elementary schools), we are cautious in making any conclusion that the improvement in the survival rate is attributable to the ETV intervention. Given that caveat, the data shows that the survival rate for Knowledge Channel schools in 2007, recorded at 72.40% is significantly higher than the 2006 figure of 69.55%. On the other hand, the survival rates for non- Knowledge Channel schools have been on a downward trend for the same period, starting with 69.84% in 2005, 68.51% in 2006 and 66.42% in 2007. The decreases, however, are not significantly different from zero. Figure 3. Survival Rates of Knowledge Channel and Non-Knowledge Channel Schools (2005 to 2007) 70.11 69.65 69.84 68.51 66.42 72.40 40.00 45.00 50.00 55.00 60.00 65.00 70.00 75.00 80.00 2005 2006 2007 Year Survival Rate (in %) KCH Non-KCH 27
- 28. 3.3. Profile and Perceptions ETV Coordinators and Subject Teachers The percentage of school teachers that attended the Knowledge Channel training is given in table 14 below. The figures tell us that majority of the elementary schools, 78 out of 134 (58%), sent more than half of the teachers to the Knowledge Channel seminars. Attendance in a seminar for majority of the teachers, and not just for a few, is a very important exercise to make sure that continuity of the programs is maintained whenever subject teachers are transferred to other schools (teachers turn-over is quite common in the public elementary schools). Knowledge Channel now requires that majority, if not all subject teachers, must attend the trainings conducted by the Knowledge Channel staff, an important innovation from the previous practice where only representative teachers are asked to attend the training seminar. The training is now conducted in every school or schools that are near each other, compared to the previous district or division-wide training. This new practice makes the training process relatively slower (only few schools are covered at a time), but having the advantage of increased coverage of the target participants – ETV coordinators and subject teachers. Table 14. Percentage of Teachers who Attended Training of KCH Type of School Level of Attendance Percentage Elementary 1 to 25 percent 15.30 25.01 to 50 percent 26.50 50.01 to 75 percent 21.40 75.01 to 90 percent 10.20 90.01 to 100 percent 26.50 Total 100.00 High School 1 to 25 percent 60.00 25.01 to 50 percent 40.00 Primary 50.01 to 75 percent 100.00 The ETV coordinator, being the person-in-charge of all activities related to the use of the Knowledge Channel facilities, plays a very important role in the success or failure of the 28
- 29. intervention. For a school with a dynamic ETV coordinator - one who makes sure that the program guide is being followed by the subject teachers and the students – the probability of having a successful intervention increases, all things being the same. Engaging the ETV coordinators more frequently through more training sessions is important step to achieve the status of having a “proactive” ETV coordinator. The figures in table 15 show the percentage of ETV coordinators that attended the training seminars conducted by Knowledge Channel. All ETV coordinators were able to attend at least one seminar, with a few that were able to attend two training sessions. % within TYPE 98.2% 100.0% 98.3% 1.8% 1.7% 100.0% 100.0% 100.0% 1 2 number of seminars attended Total Elementary High School TYPE Total Table 15. Number of seminars attended as ETV Coordinator As important factor that must be present, before any impact of the Knowledge Channel on the performance of the students is realized, is that the students are viewing the programs. To achieve this objective, the ETV coordinator develops a weekly viewing plan based on the program guide released by the Knowledge Channel every year. The viewing plan serves as the viewing schedule for the schools to follow. The viewing plan identifies the specific grade level and section that will watch the program of the Knowledge Channel at a specific time. The ETV coordinator were asked for their perceptions whether or not the viewing plan is being followed and the results in table 16 show that 94% of the ETV coordinators for elementary schools say that at least 75% of the viewing plan is being followed, with 5% saying that 100% of the viewing plan is followed. The figures here suggest a relatively high level of utilization of the programs of Knowledge Channel for schools under the TEAM-Mindanao. The results in table 16 will be validated later from the responses of the students. 29
- 30. % within TYPE 5.2% 100.0% 5.6% 42.6% 25.0% 41.1% 46.1% 25.0% 44.4% 4.3% 12.5% 4.8% 1.7% 37.5% 4.0% 100.0% 100.0% 100.0% 100.0% 100 percent 90 to 99 percent 75 to 89 percent 50 to 74 percent below 50 percent Total Elementary High School Primary TYPE Total Table 16. How much the viewing plan is achieved 3.4. Perceptions of the Students The research team interviewed 6620 students for the impact study. The objectives of the exercise are to gain insights on how the students perceived the programs of the Knowledge Channel, whether the programs are able to help the students in improving their academic performance. When asked the students on the mode of transportation they used in going to school. This variable is one of the variables identified as possible proxy for the family income. The result provided in table 17 below show that a large percentage of the elementary students interviewed (about 90%) walk when going to school. Another 5% are utilizing a public transport (usually tricycle) and 5.3% goes to school using a private vehicle. % within type 89.7% 71.5% 88.7% 5.3% 3.3% 5.2% 4.9% 25.1% 6.1% 100.0% 100.0% 100.0% walking private vehicle public vehicle Total Elementary High school type Total Table 17. How students go to school 30
- 31. About 80 percent of the elementary students interviewed spend at least 30 minutes travel tie going to their respective schools, as shown in table 18 below. Of the remaining 20 percent that spend more than 30 minutes travel time, about one-third spend at least an hour traveling to school. % within type 37.1% 43.7% 37.5% 42.7% 48.6% 43.1% 13.1% 6.2% 12.7% 4.9% 1.3% 4.7% 2.1% .3% 2.0% 100.0% 100.0% 100.0% less than 5 mins 5 to 30 mins 31 mins to 1 hour 1 to 2 hours more than 2 hours Total Elementary High school type Total Table 18. Travel time in going to school When the students were asked how often they watch Knowledge Channel programs in school, most of the elementary students said that they watch at least 2 to 3 times a week (77.50%). Moreover, about one-third of the elementary students watch Knowledge Channel programs everyday (table 19). This shows the high level of utilization rate of elementary schools under the TEAM Mindanao project, compared to schools in Luzon and the Visayas. The utilization rate is more than twice the figure for elementary schools in Luzon and the Visayas. The figures are supported by results of the FGDs where elementary schools in Zamboanga Sibugay normally adjust the class schedules with the schedules of the programs of the Knowledge Channel. % within type 33.7% 10.9% 32.4% 43.8% 42.1% 43.7% 11.5% 24.2% 12.2% 3.7% 3.9% 3.8% 2.4% 8.6% 2.7% 3.5% 6.5% 3.6% 1.4% 3.9% 1.6% 100.0% 100.0% 100.0% everyday 2 to 3 times a week once a week twice a month once a month rarely never Total Elementary High school type Total Table 19. Frequency of viewing KCh programs in school 31
- 32. Whenever the students watch programs of the Knowledge Channel, more than two-thirds (67%) of the elementary students interviewed said that they are able to watch the full episode (20 minutes) of the program. The distribution of viewing time is given in table 20 below. A common reason for not able to watch the entire episode is due to the so-called “transition problem”. Some precious minutes are wasted moving students from their classrooms to the viewing area. This is one area where the role of the ETV coordinator is crucial. In some schools where there are excellent ETV coordinators, the teacher-in- charge is advised (by the ETV coordinator) of the class’ viewing time 10 to 15 minutes before the schedule so that the teacher is able to let his/her students proceed to the viewing area. In this process, the students will have enough travel time to the viewing room, ensuring that the students are able to watch the entire episode. This role of the ETV coordinator is being emphasized during the training conducted by the Knowledge Channel staff, particularly for large schools where there is a considerable distance between the classrooms and the viewing room. % within type 66.9% 54.7% 66.2% 16.5% 24.9% 17.0% 10.4% 15.0% 10.6% 6.2% 5.4% 6.1% .1% .1% 100.0% 100.0% 100.0% 19 to 20 mins 15 to 18 mins 10 to 14 mins 0 to 9 mins (missing) Total Elementary High school type Total Table 20. How much of is program is viewed The subject teacher in charge should be present during the viewing of the Knowledge Channel programs and should be able to discuss the topics viewed by the students. Table 21 shows that more than 75% of the elementary students say that their teachers are always present whenever they are viewing the programs. However, more than 10% of the elementary students say that the teacher is not present most of the time. During the FGD some principals and parents have noticed that there are teachers who became lazy when they started using the Knowledge Channel. According to them, the teachers feel that they can go to school late because students can instead watch the Knowledge Channel while 32
- 33. waiting for them. This is one area that needs improvement. It must be emphasized during the training what are the expectations on the part of the teachers whenever the students are viewing the programs. In addition, a proper monitoring system should also be implemented at the schools to minimized cases where the teachers are shirking on their responsibilities because of the presence of the intervention. % within type 77.2% 79.1% 77.3% 9.4% 8.5% 9.3% 10.4% 11.9% 10.5% 1.6% .3% 1.5% 1.4% .3% 1.3% 100.0% 100.0% 100.0% always most of the time sometimes seldom never Total Elementary High school type Total Table 21. Teacher presence during viewing Integrating the programs viewed into the regular class discussion is an important aspect of the intervention. The teachers, therefore, must be able to discuss the topics to the students after viewing it. However, the results of survey conducted among elementary students show that this area needs to be properly monitored and improved. From table 22 only 68% of the elementary students say that their teachers are always discussing the topics after every viewing. About 20% of the elementary students say that their teachers discussed the topic sometimes or even less. Moreover, the school principals (during the FGD) have observed that some teachers do not conduct pre and post-viewing discussions. Presence of the subject teacher and how to incorporate the programs viewed by the students are two areas of concern that must be address by the Knowledge Channel team in coordination with the school principals. 33
- 34. % within type 68.0% 62.7% 67.7% 11.7% 12.2% 11.7% 15.7% 21.8% 16.1% 1.9% 1.0% 1.8% 2.7% 2.3% 2.7% 100.0% 100.0% 100.0% always most of the time sometimes seldom never Total Elementary High school type Total Table 22. Teacher discussion after viewing When the students were asked to rate the various programs of the Knowledge Channel in terms of whether the programs have been helpful (or not) to their performance in their academic subjects, about 74 percent of the elementary students rated the program SINE’SKWELA as having helped them “very much” with their science subjects. The other programs that were rated highest for having helped very much are: SALAM (66%), BAYANI (61%), MATH-TINIK (57%) and PAHINA (57%). While the results of the programs related to science and mathematics (Sene’skwela and Math-tinik) are expected, the high ratings observed for programs related to value-formation (such as SALAM and BAYANI) are quite surprising. Using data from the elementary students from Luzon and the Visayas, the program SALAM is not rated that high by the students. The results support the observations of principals and teachers that the possible benefits to students watching the programs of the Knowledge Channel are far-reaching, beyond the students’ academic performance. The programs of Knowledge Channel have the potential to mould the students watching them to become better citizens of the country. The principals observed, during the FGDs, that the students especially the Muslim students in their communities are not used to using “Po” and “Opo” when conversing with teachers and the elders. After watching shows like Hiraya Manawari and Salam, you will definitely hear students use “Po” or “Opo” when they talk to their teachers and the elders. 34
- 35. Table 23. Gaano kahalaga at nakakatulong ang mga sumusunod na programa ng Knowledge Channel? (ELEMENTARY) 4723 73.8% 1163 18.2% 412 6.4% 64 1.0% 34 .5% 6396 100.0% 1044 31.0% 1339 39.7% 642 19.1% 198 5.9% 147 4.4% 3370 100.0% 2195 43.5% 1501 29.8% 903 17.9% 299 5.9% 145 2.9% 5043 100.0% 2083 41.0% 1387 27.3% 916 18.0% 447 8.8% 248 4.9% 5081 100.0% 1973 48.5% 1027 25.3% 622 15.3% 262 6.4% 182 4.5% 4066 100.0% 1958 45.5% 1249 29.0% 613 14.2% 275 6.4% 209 4.9% 4304 100.0% 2462 49.2% 1293 25.8% 755 15.1% 327 6.5% 167 3.3% 5004 100.0% 3074 57.3% 1316 24.5% 646 12.0% 222 4.1% 106 2.0% 5364 100.0% 1220 37.6% 1007 31.0% 599 18.4% 256 7.9% 166 5.1% 3248 100.0% 2114 46.7% 1192 26.3% 753 16.6% 275 6.1% 192 4.2% 4526 100.0% 2524 51.4% 1299 26.5% 662 13.5% 287 5.8% 135 2.8% 4907 100.0% 3001 55.5% 1356 25.1% 664 12.3% 226 4.2% 157 2.9% 5404 100.0% 2865 53.6% 1375 25.7% 699 13.1% 264 4.9% 143 2.7% 5346 100.0% 3408 60.8% 1259 22.5% 578 10.3% 234 4.2% 122 2.2% 5601 100.0% 1632 45.1% 945 26.1% 609 16.8% 228 6.3% 201 5.6% 3615 100.0% 1866 44.6% 1109 26.5% 700 16.7% 300 7.2% 207 4.9% 4182 100.0% 1108 40.0% 754 27.2% 489 17.6% 225 8.1% 197 7.1% 2773 100.0% 175 37.2% 115 24.5% 94 20.0% 49 10.4% 37 7.9% 470 100.0% 66 31.3% 53 25.1% 46 21.8% 22 10.4% 24 11.4% 211 100.0% 48 28.6% 45 26.8% 35 20.8% 21 12.5% 19 11.3% 168 100.0% 65 37.1% 43 24.6% 30 17.1% 17 9.7% 20 11.4% 175 100.0% 121 48.4% 59 23.6% 33 13.2% 19 7.6% 18 7.2% 250 100.0% 55 34.6% 34 21.4% 30 18.9% 20 12.6% 20 12.6% 159 100.0% 43 29.3% 38 25.9% 27 18.4% 17 11.6% 22 15.0% 147 100.0% 165 43.0% 99 25.8% 60 15.6% 35 9.1% 25 6.5% 384 100.0% 1185 56.6% 543 25.9% 224 10.7% 92 4.4% 51 2.4% 2095 100.0% 99 36.1% 67 24.5% 57 20.8% 20 7.3% 31 11.3% 274 100.0% 2761 66.3% 800 19.2% 357 8.6% 141 3.4% 103 2.5% 4162 100.0% Sine’skwela Science Primary Science Intermediate Why English Elementary Epol-Apple Karen’s World Math-Tinik Math Primary Math Intermediate Solved Alikabuk Pamana Bayani GMRC Hirayamanawari ATBP Integrated Science Chemistry Physics Biology English Algebra Geometry Kasaysayan TV Pahina Values and Life-skills Salam very much much moderately little not at all Total IV. FOCUS GROUP DISCUSSIONS (FGD) RESULTS The students, being the major stakeholders and beneficiaries of the Knowledge Channel are the focus of this study. However, it is of paramount importance to get information on the views and opinions of other major players and partners – the parents, the teachers and the principals in the molding of the youth. A focus group discussion (FGD) was conducted to elicit information from the various stakeholders. The FGDs were conducted in Zamboanga Sibugay last November 16, 2007. Three separate discussion groups were organized to serve as venue for the exchange of 35
- 36. ideas between the researchers and the major players. One group was organized for the parents, another for the teachers, and the last group was for the principals. Each focus discussion group (FGD) lasted for an approximately more or less than one hour. The FGD was handled by one facilitator and a documenter. In addition, a discussion guide was followed by the facilitator to direct the flow of the discussions and to capture the impacts or effects of the utilization of the Knowledge Channel on the students as viewed by the FGD participants. And as major beneficiaries, the students’ views and opinions of the channel are important so that it can be checked whether or not the Knowledge Channel is meeting their goals. A total of 20 students from 10 schools (2 student-representatives from each school) were invited for the focus group discussion. To better keep track of their answers, the students were given a questionnaire and were guided as they answer every item in the questionnaire. Forums consisting of 5 groups of stakeholders were also held in Maguindanao, Shariff Kabunsuan, Zamboanga del Sur, Sulu, and Tawi Tawi last December 10 to 23, 2007. Participants of the workshop are members of 3 sectors, namely, the supervisors and principals, ETV coordinators, and PTCA officials, specifically the presidents. 4.1. Zamboanga Sibugay FGD (parents, teachers, and principals) The participants of the FGDs were parents, teachers and principals from different barangay and central schools in the Province of Zamboanga Sibugay. Parent-participants are all father of child/children from the primary level (17% are parents whose child/ren is/are in Grade 4, 50% Grade 5, 17% Grade 6, and 17% no child2 ). Meanwhile, 8% of the teacher-participants have Filipino as their subject area, 8% English, 25% Math and majority (58%) are teaching general or all subjects in the their respective grade level. Also, most of these teachers are Knowledge Channels coordinators who handle the aspect 2 This participant does not have any child who is still studying, but is an automatic member of the Parents and Teachers’ Association (PTA) by virtue of his membership in the Barangay Council. 36
- 37. of managing our viewing centers in their respective schools. There were a total of 6 parents, 12 subject teachers and 10 principals who joined the FGDs. The group discussions’ main objective is to collect information as to the impact of the Knowledge Channel to school, community (if there is any), the teachers and most especially to the students. However, what we intended to capture in this exercise is the qualitative impact as described by our parents, teachers and principals. Prior to the introduction of Knowledge Channel in these schools, the most common practice in the educating our youth in school is through the interaction of students with their teachers. Visual aids were prepared by teachers that they use in relation to their classroom discussions so that the students may be able to understand and appreciate the concepts and lessons they talk about in class. Later on, other instructional media were introduced. These include the audio tapes, VHS tapes, and audio and video CDs. Many of these materials were initially given by non-governmental organizations (like Real World, and Equals). In the advent of computers, one of the parents bought CDs (like Encarta Encyclopedia) for his children’s pleasure. However, in the discussion with the three groups, they were unanimous in saying that what these supplemental instructional materials can offer are static pictures. Students can view still pictures of the subject being discussed. Participants in the FGDs can not help but mention and immediately compare their current situation when they are already using the programs in the Knowledge Channel as supplementary instructional materials in their lessons. When they were asked about their initial impression about the programs, many have expressed being affirmative on it. Meanwhile, many of these schools have been utilizing programs from the Knowledge Channel for almost two (2) years now. This time, they were asked about their initial impression or reaction when they were told about the Knowledge Channel. Since one of the parents is a former teacher, he viewed that the utilization of the programs in the 37
- 38. Knowledge Channel would help break the monotony and dominance of the teacher in class discussion. Also, teachers can take a break for at least 20 minutes a day. However, not all impressions that were mentioned were for the Knowledge Channel. There was one negative reaction we noted during the discussion. Initially, some of the teachers and even principals find that the introduction of Knowledge Channel in their curriculum would give additional work load for the teachers especially because teachers would need to plan the viewing session of each class. In addition, they find the swapping of class schedules inconvenient. Later on, they noted though that these inconveniences were temporary and part of the adjustments they have to face in the integration of Knowledge Channel in their classroom activities. Afterwards, all seems to be mechanical and repetitive. 4.1.1. Perceived Effects from Watching Programs of the Knowledge Channel In the assessment of the participants during the discussion, it turned out that it is not always the case that they find pleasing results in their use of Knowledge Channel. Still, majority of the responses solicited are encouraging views to further utilize Knowledge Channel to complement classroom discussions and activities. Below are highlights of the major points raised in the discussion. For the Students As noted earlier, since programs in the Knowledge Channel are presented in a more animated way (e. g., they see the animals, and the body systems in action), students tend to be more appreciative of the lessons tackled in class. From mere looking at still pictures, say of the heart and other parts of the circulatory system, they can now see moving illustrations as to how blood really flows in our blood vessels. Parents noted that their child/ren become more interested in the lessons in class. The teachers and the principals, on the one hand, observed that class performance, in general, improved. They 38
- 39. attribute the improvement in their NAT Scores (5 to 6 percentage points increase) and MPS to viewing of programs from the Knowledge Channel. Also, they noted that students are more attentive in watching shows in the Knowledge Channel as compared with if their teacher is the one doing the discussion. Furthermore, they observed that retention of lessons dramatically improved. The teachers exclaimed that from only about 25% of the lesson retained, students now are able to recall about 100% of what was discussed in class and what they have seen in the programs. In addition, participation in class recitation and students’ scores have improved as well. Absentees are lesser because students do not want to miss any viewing session. For the Teachers It is not only the students who enjoy the benefits of watching Knowledge Channel programs. The teachers too find the programs very useful. Since the launching of Knowledge Channel in their schools, the teachers save more time in producing and preparing visual aids for their lessons. Furthermore, the 20-minute viewing time of the students gives the teacher sufficient time to take some rest from standing in front of the class and from talking. One important contribution noted of Knowledge Channel viewing to teachers is that teachers too learn from the programs. As we know, due to the lack of teachers especially in barangay and rural communities, teachers assigned in these areas are forced to teach majority, if not all of the subjects per grade level. Since the teacher may lack the necessary skill or background on the subject matter, the program guides everyone (both the teacher and the students) in the lesson. Teachers specializing on one subject, on the other hand, find the integration of topics done by programs very amusing. As an example raised by one of the math teachers, they find the episode on fraction and decimals to be very good. In that way, the program was efficient in presenting two concepts that are related to each other. 39
- 40. For the Community In our discussion with the different groups, it is surprising to note that the impact of Knowledge Channel program viewing do not confine the fences of the school. There were a number of impacts brought to the community as well. Among the noticeable impacts include some applications of practices viewed in one of the programs. These cover solid waste management, and health and sanitation among others. Specific examples given were about the prevention of the community from being victims of the dengue-carrying mosquitoes. Students served as reminder to their teachers and parents as to how they should manage their surroundings to promote a healthier environment. The principals noted a decrease in drop out rate from about 8% to only 2% now. Additionally, they observed that values being promoted by the shows seem to be very effective. They have cited that the students, especially the Muslim students in their communities are not used to using “Po” and “Opo” when conversing with teachers and the elders. After watching shows like Hiraya Manawari and Salam, you will definitely hear students use “Po” or “Opo” when they talk to their teachers and the elders. The linkage between the community and the school were further enhanced through the introduction of Knowledge Channel. Barangay Council and the PTA are working together to ensure the safety of the equipments provided by the Knowledge Channel. Also, there were some initiatives as to allowing the other members of the community in watching programs in the Knowledge Channel. This especially for parents who want to improve their lives by engaging in livelihood activities being showcased in the weekend shows of the Knowledge Channel. 4.1.2. Problems Encountered and Addressing Them Despite all the beautiful things shared to us by the participants, there were also a number of complaints and problems that arise from the utilization of the Knowledge Channel. 40
- 41. This discussion provided a venue for the participants to air their grievances and to share what actions were taken by other schools in order to address such inconveniences. 1. Improper use of Knowledge Channel viewing a. Some principals and parents have noticed that there are teachers who became lazy when they started using the Knowledge Channel. According to them teachers feel that they can go to school late because students can instead watch the Knowledge Channel while waiting for them. b. Some principals are still hesitant on using the programs to supplement classroom discussion because teachers fail to conduct pre and post- conference discussions. Though it turned out that many of the principals have foreseen such practice would be feasible, they have doubled their efforts in monitoring teachers. They ensure that the pre and post- conference discussions are strictly practiced by doing inspections and random checks on teachers going and leaving the viewing room. 2. Scheduling In order to put to maximum use the programs in the Knowledge Channel, here are some practices relating to scheduling that were effective for many of the schools. Class viewing schedules are prepared by the coordinators or teacher in charge a week in advance. The schedule is posted in a bulletin board near the viewing room. In addition, some announce the schedule after the morning flag ceremony and provide each teacher with the mentioned viewing schedule. 3. Shows Below are some comments regarding some shows in the Knowledge Channel. They wish the management to address these concerns. a. There are programs in the Knowledge Channel where actors are not Filipino. Although the topics being discussed may be interesting, students 41
- 42. and teachers find it hard to understand as these actors have different accents in speaking the English Language. They unanimously suggested that may be it is possible for the Knowledge Channel to produce and showcase shows where talents are Filipinos speaking English. b. Teachers noted that the 20-minute shows are too short for them. We noticed that this comment is common to relatively bigger campuses with relatively bigger student population. More often than not, in these campuses, they only have one TV set hence it would take time for the students to travel from their classrooms to their viewing room. In address such concern, a number of suggested actions were raised in the FGD. For some schools, through the cooperation of their PTA and local government units, as they have seen the benefits brought about by viewing of programs in the Knowledge Channel, have pledge to raise funds. The funds will be used to buy additional television sets and they have envisioned that in the next few years or so, each classroom should have individual television sets and connection to the Knowledge Channel. c. Apart from those mentioned above, one more concern that teachers would like to be addressed is the flashing of important words in the shows. They wanted that these key words be flashed longer so that students, and the teachers as well, will be able to copy and take note of it. 4. Others concerns a. The shows, despite being synchronized with the Department of Education’s program/curriculum, the program still assumes that the students can immediately take note and understand the concepts being discussed. Sometimes, the pacing of the programs are still too fast for the students to catch up. b. Small and barangay schools encountered some problem in generating funds to cover the electric bill of their school. However, with the help of 42
- 43. the community and the local government unit, they are able to sustain the viewing of Knowledge Channel programs in their school. 4.2. Zamboanga Sibugay FGD (students) As stated earlier, the students are the major stakeholders and beneficiaries of the Knowledge Channel (Knowledge Channel). And as major beneficiaries, the students’ views and opinions of the channel are important so that it can be checked whether or not the Knowledge Channel is meeting their goals. A number of items were answered by the students. They were asked of their viewing habits at home and reactions of their other household members regarding the Knowledge Channel. The students were also asked of the benefits the watching Knowledge Channel programs bring to themselves, their family, their schooling, and also the community. And finally, the students were given a chance to give suggestions they think will be of great help to them in regards to Knowledge Channel viewing. 4.2.1 Viewing at home Since the Knowledge Channel is a media-based learning system, it is important to take note of other media students used to aid their education. And one important venue of the use of media is at home. The household is the smallest unit of society. It is where a child or student first learns his or her skills and is where he or she develops habits. At the same time, it is also important to check how parents respond to the new method of teaching the school gives their child. In this way, the Knowledge Channel can see whether or not the parents are supportive of the use of educational television and viewing of the programs is supplemented and is being continued at home. The students are first asked questions regarding media being used at their respective households. All 20 students watch television at home. 4 out of the 20 watches alone, 3 43
- 44. watch with friends, while the remaining 65 percent watches with a family member (includes parents, siblings, cousins, grandparent, and aunts). 90 percent of the students said that their parents set rules in television use. Rules set by parents include ‘watching television only after homework is done’ (5 out of 18) and ‘watching television only during weekends and when there are no classes’ (5 out of 18). When asked what shows do they watch at home, 40 percent said they watch at least 1 program shown in cable. Also, 40 percent of the students interviewed watches Knowledge Channel programs at home. Knowledge Channel programs watched at home include Sine’skwela, Math-Tinik, Science Intermediate, Math Intermediate, and Why. 4.2.2. Frequency of Knowledge Channel viewing When it comes to viewing of Knowledge Channel (Knowledge Channel) programs, the students were asked how frequent they view programs of the Knowledge Channel at home and in school.3 Of the 20 students, only 1 doesn’t watch programs of the Knowledge Channel at home. When asked on how frequent they watch at home, 5 of the 19 (around 26 percent) students watch Knowledge Channel programs most of time to always. In school, all of the students watch Knowledge Channel programs and 80 percent watches most of the time to always. On the other hand, the students were also asked if they watch Knowledge Channel programs in other locations besides in their household and in school. 4 of them answered ‘yes’ (other location stated were relative’s and neighbor’s house) but their frequency of viewing in these locations ranges from seldom (2 out of 4) to sometimes (2 out of 4). The students were also asked on the average time spent per day in watching Knowledge Channel programs at home and in school combined. 50 percent of the students said that they watch for more than an hour (this can be approximated as watching more than 3 shows of the Knowledge Channel while 40 percent watches from 30 minutes to an hour 3 Choices on frequency include never, seldom, sometimes, most of the time, and always. 44
- 45. (2 to 3 Knowledge Channel programs) and 10 percent watches in less than 30 minutes (only 1 show). The results show that the major viewing location of Knowledge Channel programs is in school. And even if students were capable of watching programs of the Knowledge Channel at home (in this case 19 out of 20), more can be done to increase the frequency of their viewing at home. 4.2.3. Reason and importance The students were then asked of the reasons they watch Knowledge Channel programs. 12 out of the 20 stated reasons with respect to school work. 11 out of the 20 students said they get additional knowledge when they watch and 1 out of the 20 students said he enjoys watching the programs. Below is a list of a few of the actual responses of the students. - Because it help me understand my lessons easily. - To add knowledge and information about the world. - Nanonood ako ng mga programa ng Knowledge Channel dahil mas nakakabuti ito sa aking pag-aaral. Masmarami akong nakukuhang leksyon kumpara sa panonood ng mga cartoons. The students were also asked of the importance of watching Knowledge Channel programs. All of the students mentioned the significance of watching Knowledge Channel programs in understanding their lessons more. Below is a list of a few of the actual responses of the students in regards to this question. - Importante para sa akin ang panunood ng mga programa ng Knowledge Channel dahil noong hindi pa ako nanunood ng Knowledge Channel mahina ako sa recitation kumpara ngayon ngayon kaya lagi na akong nanunood. - It is very important because I can learn much more than what the teacher teaches. - Very important because I not only enjoy watching but I also learn. 45
- 46. 4.2.4. Specific Benefits The students were also asked of the specific benefits they get from watching programs of the Knowledge Channel. All of the students said that watching Knowledge Channel programs help them in their schooling. 65 percent said that the programs have benefits in their household. 65 percent also said that it helps the community. While all of them said that watching Knowledge Channel programs have positive effects for themselves. Of the 65 percent who said that Knowledge Channel programs have benefits in the household, 3 (out of 13) included that they apply lessons learned from watching GMRC. They specifically stated that quarrels with their siblings are lessened. One student, on the other hand, said that with Knowledge Channel he can now help in doing household chores because he doesn’t have to study anymore since he already understood the lesson when watching Knowledge Channel. Below is some benefits in the household students cited. - … my brothers and I are now very fluent in English. - Huwag magtapon ng basura sa mga gilid ng bahay… - Nakakatulong ito ssa mga gawaing pambahay… - …kung noon nag-aaway kami ng mga kapatid ko ngayon hindi na… In regards to the benefits the Knowledge Channel brings to the community, the students cited benefits to the environment and to other people. 5 students (out of the 13 who said that watching Knowledge Channel has benefits for the community) said that in watching Knowledge Channel programs they learn how to take care of the environment. On the other hand, 4 (out of 13) said that because of Knowledge Channel they learn how to deal and get along with other people in the community. One student specifically said that people in the community are now more knowledgeable (the student’s term is ‘intelligent’) while another said that Knowledge Channel help by identifying ways on how the community can improve. Here are a few of the benefits the students enumerated: - Para matuto ang iba …at mas may alam sila ng mga bagay na ikabubuhay. - Ang hindi pagkalat ng mga basura sa kapaligiran. 46
- 47. - Kailangan maging mabait ka sa kapitbahay mo para mabait din sila sa iyo. - Mas maraming natututunan ang mga mamamayan lalo na ang mga estudyante. All the students said that programs of the Knowledge Channel help them as individuals. 13 students said that watching Knowledge Channel helps them in studying their lessons. Some mentioned improvement in their grades since they watched Knowledge Channel programs. 4 students, on the other hand, said that Knowledge Channel programs help them beyond their school work. They cited they became more disciplined, they learn how to take care of themselves, and they became more cooperative after watching Knowledge Channel programs. Moreover, 2 students said that they watch Knowledge Channel programs for leisure since they enjoy watching the shows. Below are some of the actual responses of the students. - …it is a big improvement for me… it helps me in my assignments and projects… - It can improve my grades in class… I also learn how to be cooperative… - Keeping myself clean and healthy. - …dahil sa panunood ng Knowledge Channel mas na-iimprove ko yung learning skills ko. - Now I can answer my teachers’ questions because of the Knowledge Channel that I watch at home and school. - Tumutulong ang Knowledge Channel upang mapaunlad ang aking kaalaman. The students were also asked if the programs of Knowledge Channel changed how they look at things. All students answered ‘yes’. They were then asked how Knowledge Channel programs changed them. Majority of the students (13 out of 20) said that because of Knowledge Channel shows they now understand lessons more and their knowledge is increased. 3 specifically stated an improvement in grades because of watching Knowledge Channel. An important result is that the students reported a change in their attitudes. 5 students said that because of Knowledge Channel they became of more studious, changed their attitudes and they now have more friends. 47
- 48. 4.2.5. Knowledge Channel and Subjects It is also important to see how Knowledge Channel viewing help the students in particular subjects. The students were asked how watching Knowledge Channel programs helped them in their lessons in Mathematics, English, and Science. When it comes to Math, the students said that Math programs of the Knowledge Channel help them in learning the techniques and how to solve problems (as reported by 6 students). 2 students specifically said the program discussing decimals as helpful to them. In English, on the other hand, the students remember programs with topics such as grammar, idioms, adverbs, and rules of a meeting. One student said he now participates during class recitations. Another student said he can now communicate better with their priest who doesn’t understand Filipino. In Science, topics students remember are energy, molecules, human body, the earth and the other planets. 4.2.6. Parents and Siblings on Knowledge Channel 15 of the 20 students reported that they discuss programs of the Knowledge Channel with their parents. They were then asked what their parents say and thought of the Knowledge Channel. Parents told their children that Knowledge Channel is good (as reported by 6 students) and they also learn from the shows of Knowledge Channel (as reported by 2 students). The parents also saw an improvement of the child’s grades (as reported by 2 students) so they encourage their child to watch more of Knowledge Channel programs (as reported by 1 student). When it comes to the student’s siblings, 14 students said that they discuss programs of the Knowledge Channel with their siblings. 5 students reported that their siblings enjoy watching programs of the Knowledge Channel and they are ‘amazed’ on what they see. 48
- 49. While 4 students said that their siblings told them that is a good way of learning new things. The students were also asked if they discuss Knowledge Channel programs with their friends. 15 out of the 20 students said that they do discuss the programs with their friends. According to their friends, Knowledge Channel makes them interested to go to school (as reported by 1 student), the programs are easy to understand (as reported by 1 student), and the programs help them in their studies (as reported by 4 students). 4.2.7. Suggestions Finally, the students were also asked if the have some suggestion to better improve the services of the channel. Their suggestions include increasing the frequency of their viewing, if possible, watching everyday (from 1 student), increasing showing time per show (from 6 students), increasing programs (6 students) with one student suggesting a program for MSEP, using Filipino characters and not foreigners (1 student), having television sets in the classroom (from 2 students), and 2 students even suggested that they have quizzes every after viewing. 4.3. Square table discussions (Maguindanao, Shariff Kabunsuan, Zamboanga del Sur, Sulu, and Tawi Tawi) Forums consisting of 5 groups of stakeholders were held in Maguindanao, Shariff Kabunsuan, Zamboanga del Sur, Sulu, and Tawi Tawi last December 10 to 23, 2007. Participants of the workshop are members of 3 sectors, namely, the supervisors and principals, ETV coordinators, and PTCA officials, specifically the presidents. The forums’ main objective is to gather information on the impact of the Knowledge Channel intervention in their respective schools. The workshop not only intends to get hold of information as to the direct impact to the students of the information. That is, whether or not watching the programs of the Knowledge Channel have an impact to the 49
- 50. education (and to an extent, the grades) of the students. As what can be seen from the results of the forums below, Knowledge Channel intervention also has and indirect effect to the school such as a decrease in drop-out rates and increase in enrollment, among others. The workshop specifically tackled both positive and negative effects of the introduction of the Knowledge Channel in their schools. It also became a venue where educators shared the lessons they learned in using technology-based education intervention. And finally, the forum became a place where the participants provided their thoughts and suggestions on how to sustain the use of the Knowledge Channel. 4.3.1. What went right with the Knowledge Channel being introduced in the school (as reported by 4 groups) With the introduction of Knowledge Channel in their schools, the principal cited a number of positive effects to the students. These positive effects include an increase in enrollment while at the same time a decrease in the absences of students. Academic proficiency and performance is increased. Also, the students’ communication skills and participation is increased. According to the ETV coordinators, the Knowledge Channel became a substitute for teachers’ lectures. It lessens the work and burden of the teachers since the programs become substitutes to the usual visual aids being used. The intervention makes lessons interesting while making both teachers and students aware of new concepts and innovations. The Knowledge Channel also stimulates, encourages, and increases the eagerness of the students to study. As stated by the principals, the ETV coordinators also observed a decrease in drop-out rates since it encourages students to go to school. Overall, the viewing of the Knowledge Channel programs increases the performance of the students. 50
- 51. The positive effect of the intervention can be checked through the changes the parents themselves see in their child. The PTCA presidents said that with the introduction of Knowledge Channel, their children are encouraged to go to school. The students showed an improvement of skills like learning how to read and the students now easily understand their lessons. This is shown and proven through the improvement of their children’s grades. Also, students are able to share freely with their parents what they see in the programs of the Knowledge Channel. 4.3.2. What went wrong with the Knowledge Channel being introduced in the school (as reported by 3 groups) Besides the positive effects of the intervention introduced to the schools, the groups were also able to identify the limitations of the project as well as the problems they have encountered while using the Knowledge Channel. The principals, ETV coordinators, and PTCA presidents were one in saying that electricity (and its absence) is a major hindrance in utilizing the Knowledge Channel. And in connection with their problem of the absence of electricity is the problem of lack of funds for payment of electric bills. Principals of Zamboanga del Sur schools particularly cited that during heavy rains, there is no signal. The groups also said that one television is insufficient for a school with a large number of students. And it does not help that in some schools, the viewing room is rather far from the classrooms. Another problem that they face is with regards to security in the schools. In Zamboanga del Sur, there was an attempt in stealing the television set. While in Tawi Tawi, they solved this problem by employing security guards paid by parents. The ETV coordinators expressed their concern in the lack of follow up from the teachers after viewing. They also said that teachers are too dependent on the ETV coordinator. 51
- 52. And that it is difficult for them to do the additional tasks of being an ETV coordinator because they already have a lot of load because teachers are few. The principals also expressed concern with peace and order (i.e. terrorist attacks) which hampers viewing of the programs. They also said that there are some activities they, at times, have to prioritize so viewing is impeded. One concern that the principals also said is that students at times are not able to understand well the language and vocabulary being used in the programs. 4.3.3. Lessons learned from using technology-based educational intervention (as reported by 1 group; Shariff Kabunsuan) The forum held at Shariff Kabunsuan shared the lessons they have learned after Knowledge Channel was introduced to them in their schools and they while they were utilizing the new intervention. The Knowledge Channel was able to expose the pupils not only by providing new learning experiences on things the students have not seen before and relating these things to their lessons but also by becoming an agent for understanding other cultures and how to live harmoniously with others. The principals also cited that they should value the new opportunity given to their school. To do this they should grab every chance to participate in activities where the school is invited. They should also integrate as much as possible the modules provided by the Knowledge Channel in their lessons. They also noted that they should be aware of time allotments so that as much as possible every student will have a chance in viewing Knowledge Channel programs. However, the principals stated their concern with the problem with electricity. They pointed out that this big opportunity as provided to them by the Knowledge Channel will be useless if there is no electricity. 52
- 53. 4.3.4. Sustainability of the Knowledge Channel (as reported by 3 groups; Shariff Kabunsuan, Sulu, and Zamboanga del Sur) Lastly, the participants were asked of their plans on how to sustain and continue viewing of the programs of the Knowledge Channel. Their plans can be grouped into 3. First, plans of the school, which includes maintenance of the equipment and dedication to the programs. Second, soliciting help to the community, specifically the parents and the barangay officials. And lastly, with work from the Knowledge Channel team. The school’s participation in the sustainability of the Knowledge Channel can be further divided into 2 goals—first, physical maintenance and improvement and, second, diligence and dedication of the principals and ETV coordinators. Physical maintenance and improvement includes acquisition of additional television sets, improvement of the viewing area so that students will be motivated to watch, and taking care of the current equipment given to them. Principals further said that they should be responsible for regular monitoring and close supervision of the ETV coordinators and for giving updates through regular meetings with the community. The ETV coordinators, on the other hand, should take the initiative to see to it that utilization of the technology be maximized. Principals of the forum held at Zamboanga del Sur specifically suggested that can collect monthly dues from the pupils worth one to two pesos. They added that will require the teachers to provide additional television sets that will later on be shoulder by the parents. The PTCA presidents showed their support in the principal’s goal of maintaining the Knowledge Channel intervention in the school. They said that there should be teamwork between the PTCA and the barangay officials regarding problems faced by the school when it comes to payment of bills, maintenance of equipment, and security of the school. They are also willing to search for funds in order to increase the number of television sets 53
- 54. in the school. They also expressed willingness to monitor utilization of the technology in the schools. The PTCA added and reminded the principals and ETV coordinators that ETV equipment provided to the schools should be used only for their intended purpose and that the equipment should be handled carefully and kept properly. And lastly, the stakeholders said that it will be of great help if there is continuous innovation with regards to the programs of the Knowledge Channel. 4.4. Conclusions The stories, experiences and views shared to us by the participants (the parents, the teachers and the principals) are overwhelming. We have noted, as one of the teachers told us, that Knowledge Channel changed how students look after television viewing. “Knowledge Channel viewing has become a personal experience for the students.” In addition, the participants have noted that through Knowledge Channel, classroom discussions and lesson learned are now being “standardized”. Learning is now more “centralized”. Knowledge Channel provides opportunities in learning for the students in the rural communities to catch up with those in Metro Manila schools. They were glad to note that “now, the pupils in our communities and even in the remotest area wherever in the country, as long as they have Knowledge Channel, have access to quality instructional media.” The improvement of scores and grades of the students and the way they perform in class may seem to be an important impact of Knowledge Channel but more than that, there might also be other benefits – molding better citizens of this country, as cited by our participants. The Knowledge Channel has fostered community unity and interaction among community organizations towards self-improvement. 54