Burlington & Ross in Stockton, CA
•
1 like•343 views

Offering more than 800 feet of street front retail visibility and easy access from Holman Road and Hammer Lane, the Hammer Crossings Shopping Center offers investors an opportunity to purchase a retail investment property in the retail epicenter of Stockton, California.

Recommended
More Related Content
What's hot
Similar to Burlington & Ross in Stockton, CA
Similar to Burlington & Ross in Stockton, CA (20)
More from Kevin Boeve
More from Kevin Boeve (20)
Recently uploaded
Recently uploaded (20)
Burlington & Ross in Stockton, CA
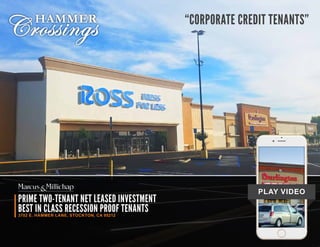
- 1. PRIME TWO-TENANT NET LEASED INVESTMENT BEST IN CLASS RECESSION PROOF TENANTS3702 E. HAMMER LANE, STOCKTON, CA 95212 PLAY VIDEO HAMMER Crossings “CORPORATE CREDIT TENANTS”
- 2. The information contained in the following offering memorandum is proprietary and strictly confidential. It is intended to be reviewed only by the party receiving it from Marcus & Millichap and it should not be made available to any other person or entity without the written consent of Marcus & Millichap. By taking possession of and reviewing the information contained herein the recipient agrees to hold and treat all such information in the strictest confidence. The recipient further agrees that recipient will not photocopy or duplicate any part of the offering memorandum. If you have no interest in the subject property at this time, please return this offering memorandum to Marcus & Millichap. This offering memorandum has been prepared to provide summary, unverified financial and physical information to prospective purchasers, and to establish only a preliminary level of interest in the subject property. The information contained herein is not a substitute for a thorough due diligence investigation. Marcus & Millichap has not made any investigation, and makes no warranty or representation with respect to the income or expenses for the subject property, the future projected financial performance of the property, the size and square footage of the property and improvements, the presence or absence of contaminating substances, PCBs or asbestos, the compliance with local, state and federal regulations, the physical condition of the improvements thereon, or the financial condition or business prospects of any tenant, or any tenant’s plans or intentions to continue its occupancy of the subject property. The information contained in this offering memorandum has been obtained from sources we believe to be reliable;however,Marcus&Millichaphasnotverified,andwillnotverify,anyoftheinformationcontainedherein,norhasMarcus&Millichapconductedanyinvestigationregardingthesemattersandmakesnowarrantyorrepresentationwhatsoeverregardingtheaccuracyor completeness of the information provided. All potential buyers must take appropriate measures to verify all of the information set forth herein. Prospective buyers shall be responsible for their costs and expenses of investigating the subject property. ALL PROPERTY SHOWINGS ARE BY APPOINTMENT ONLY. PLEASE CONTACT THE MARCUS & MILLICHAP AGENT FOR MORE DETAILS. Confidentiality Agreement
- 3. PRESENTED BY Kevin Boeve Senior Vice President Investments ONTARIO OFFICE Tel: (909) 456-3450 kevin.boeve@marcusmillichap.com CA License: 01247016 Joshua Rey Associate ONTARIO OFFICE Tel: (909) 456-7015 joshua.rey@marcusmillichap.com CA License: 1776485 HAMMER Crossings
- 5. financial overview pricing Property Name Hammer Crossings Shopping Center Property Address 3702 East Hammer Lane Stockton, CA 95212 Price $15,973,000 Down Payment $5,989,000 Price/SF $158 Cap Rate 6.25% Year 1 Net Operating Income $998,335 10 Year Leveraged IRR 8.5% Gross Leasable Area 101,201 SF Lot Size 12.43 Acres (Entire Center) Year Built/ Renovated 1991/ 2016 This information has been secured from sources we believe to be reliable, but we make no representations or warranties, expressed or implied, as to the accuracy of the information. References to square footage or age are approximate. Buyer must verify the information and bears all risk for any inaccuracies. Any projections, opinions, assumptions or estimates used herein are for example purposes only and do not represent the current or future performance of the property. Marcus & Millichap Real Estate Investment Services is a service mark of Marcus & Millichap Real Estate Investment Services, Inc. © 2011 Marcus & Millichap ACT ID Y0080439 2 financing New Loan Amount $9,984,000 Loan to Value 60.0% Interest Rate 4.50% Fixed Loan Term 10 Years Amortization Term 30 Years Loan Fee 0.5% Note: Please contact listing agents to discuss financing terms and options. expenses Year 1 Potential Gross Revenue Base Rental Revenue $1,140,732 Expense Reimbursement Revenue $198,384 Effective Gross Revenue $1,339,116 Operating Expenses Electricity $24,061 Water - Irrigation $2,988 Sewer $4,908 Janitorial Day Porter & Supplies $8,426 Sweeping $7,978 Electrical Repairs & Supplies $1,604 Landscape Maintenance & Repairs $10,062 Landscape Repairs $2,666 Landscape - Tree Trimming $3,086 Lighting SVC $2,617 R&M - Miscellaneous $8,582 R&M - Plumbing $561 Pressure Wash $3,916 Property Management Fee $26,810 Building - Sewer $550 Building - Telephone & Fire $1,203 Building - Fire System Monitoring $722 Building - R&M Fire System $2,037 Trash Service $1,540 Building - Water $1,010 Insurance - Liability $4,058 Insurance - Building $17,856 Property Taxes $204,019 Total Operating Expenses $342,160 Net Operating Income $996,956
- 6. rent roll 3 This information has been secured from sources we believe to be reliable, but we make no representations or warranties, expressed or implied, as to the accuracy of the information. References to square footage or age are approximate. Buyer must verify the information and bears all risk for any inaccuracies. Any projections, opinions, assumptions or estimates used herein are for example purposes only and do not represent the current or future performance of the property. Marcus & Millichap Real Estate Investment Services is a service mark of Marcus & Millichap Real Estate Investment Services, Inc. © 2011 Marcus & Millichap ACT ID Y0080439 Suite Tenant GLA % of GLA Lease Commence Lease Expire Annual Rent Rent/SF Options Increases 3702-A Burlington 75,197 SF 74.3% 10/01/07 01/31/26 $939,200 $12.49 Three, Five-Year Option 2/23: $1.06 Option 1: $1.07 Option 2: $1.10 Option 3: $1.12 3702-B Ross Dress for Less 26,004 SF 25.7% 02/01/17 01/31/27 $201,531 $7.80 Four, Five-Year Options 2/22: $0.73 Option 1: $0.81 Option 2: $0.90 Option 3: $1.06 Option 4: $0.81 Total Vacant 0 SF 0.00% Total Occupied 101,201 SF 100.0% Total 101,201 SF 100.00%
- 7. For the Years Ending In Place 4/1/17 Year 1 $ / SF Year 1 2018 Year 2 2019 Year 3 2020 Year 4 2021 Year 5 2022 Year 6 2023 Year 7 2024 Year 8 2025 Year 9 2026 Year 10 2027 Potential Gross Revenue Base Rental Revenue $1,140,732 $11.27 $1,140,735 $1,140,735 $1,140,735 $1,140,735 $1,140,735 $1,140,735 $1,140,735 $1,140,735 $1,140,735 $1,140,735 Expense Reimbursement Revenue $198,384 $1.97 $199.760 $206,357 $215,366 $222,318 $229,422 $236,683 $244,101 $251,682 $259,423 $267,337 Effective Gross Revenue $1,339,116 $13.25 $1,340,495 $1,347,092 $1,256,101 $1,363,053 $1,374,491 $1,406,682 $1,430,398 $1,437,979 $1,448,853 $1,476,768 Operating Expenses Electricity $24,061 $0.24 $24,061 $24,542 $25,033 $25,033 $26,044 $26,565 $27,096 $27,638 $28,191 $28,755 Water - Irrigation $2,988 $0.03 $2,988 $3,047 $3,108 $3,170 $3,234 $3,298 $3,364 $3,432 $3,500 $3,570 Sewer $4,908 $0.05 $4,908 $5,007 $5,107 $5,209 $5,313 $5,419 $5,528 $6,638 $5,751 $5,866 Janitorial Day Porter & Supplies $8,426 $0.08 $8,426 $8,595 $8,766 $8,942 $9,121 $9,303 $9,489 $9,679 $9,872 $10,070 Sweeping $7,978 $0.08 $7,978 $8,138 $8,301 $8,467 $8,636 $8,809 $8,985 $9,165 $9,348 $9,535 Electrical Repairs & Supplies $1,604 $0.02 $1,604 $1,636 $1,669 $1,702 $1,736 $1,771 $1,806 $1,843 $1,879 $1,917 Landscape Maintenance & Repairs $10,062 $0.10 $10,062 $10,263 $10,468 $10,677 $10,891 $11,109 $11,331 $11,558 $11,789 $12,025 Landscape Repairs $2,666 $0.03 $2,666 $2,720 $2,774 $2,829 $2,886 $2,944 $3,003 $3,063 $3,124 $3,186 Landscape - Tree Trimming $3,086 $0.03 $3,086 $3,148 $3,211 $3,275 $3,341 $3,407 $3,476 $3,545 $3,616 $3,688 Lighting SVC $2,617 $0.03 $2,617 $2,669 $2,723 $2,777 $2,833 $2,889 $2,947 $3,006 $3,066 $3,128 R&M - Miscellaneous $8,582 $0.08 $8,582 $8,753 $8,928 $9,01 $9,289 $9,475 $9,664 $9,858 $10,055 $10,256 R&M - Plumbing $561 $0.01 $561 $573 $584 $596 $608 $620 $632 $645 $658 $671 Pressure Wash $3,916 $0.04 $4,916 $3,994 $4,074 $4,155 $4,238 $4,323 $4,410 $4,498 $4,588 $4,680 Property Management Fee $26,810 $0.26 $26,810 $26,942 $27,122 $27,261 $27,490 $28,134 $28,608 $28,760 $28,977 $29,535 Building - Sewer $550 $0.01 $550 $561 $573 $584 $596 $608 $620 $632 $645 $658 Building - Telephone & Fire $1,203 $0.01 $550 $561 $573 $584 $596 $608 $620 $632 $645 $658 Building - Fire System Monitoring $722 $0.01 $722 $736 $751 $766 $781 $797 $813 $829 $846 $863 Building - R&M Fire System $2,037 $0.02 $2,037 $2,078 $2,119 $2,162 $2,205 $2,249 $2,294 $2,340 $2,387 $2,435 Trash Service $1,540 $0.02 $1,540 $1,571 $1,602 $1,634 $1,667 $1,700 $1,734 $1,769 $1,804 $1,840 Building - Water $1,010 $0.01 $1,010 $1,031 $1,051 $1,072 $1,094 $1,116 $1,138 $1,161 $1,184 $1,208 Insurance - Liability $4,058 $0.04 $4,058 $4,139 $4,222 $4,306 $4,393 $4,480 $4,570 $4,661 $4,755 $4,850 Insurance - Building $17,856 $0.18 $17,856 $18,213 $18,577 $18,949 $19,328 $19,714 $20,109 $20,511 $20,921 $21,340 Property Taxes $204,019 $2.02 $204,919 $209,017 $213,197 $217,461 $221,812 $226,248 $230,773 $235,387 $240,095 $244,898 Total Operating Expenses $342,160 $3.38 $342,160 $348,600 $355,212 $361,911 $368,838 $376,306 $383,745 $391,000 $398,461 $406,412 Net Operating Income $996,956 $9.86 $998,335 $998,492 $1,000,889 $1,001,142 $1,005,653 $1,030,376 $1,046,653 $1,046,979 $1,050,392 $1,070,356 Income Yield 6.16% 6.00% 6.00% 6.01% 6.02% 6.04% 6.19% 6.29% 6.29% 6.31% 6.43% Cash Flow After Debt Service $406,276 $381,165 $381,018 $383,103 $383,033 $387,213 $411,594 $427,519 $427,483 $430,522 $450,102 Levraged Cash on Cash Yield 6.06% 5.68% 5.68% 5.71% 5.71% 5.77% 6.14% 6.38% 6.37% 6.42% 6.71% schedule of prospective cash flow This information has been secured from sources we believe to be reliable, but we make no representations or warranties, expressed or implied, as to the accuracy of the information. References to square footage or age are approximate. Buyer must verify the information and bears all risk for any inaccuracies. Any projections, opinions, assumptions or estimates used herein are for example purposes only and do not represent the current or future performance of the property. Marcus & Millichap Real Estate Investment Services is a service mark of Marcus & Millichap Real Estate Investment Services, Inc. © 2011 Marcus & Millichap ACT ID Y0080439 4 growth rates CPI 3% Annually Operating Expenses 2% Annually Real Estate Tax 2% Annually Market Rent Growth 3% Annually
- 9. This information has been secured from sources we believe to be reliable, but we make no representations or warranties, expressed or implied, as to the accuracy of the information. References to square footage or age are approximate. Buyer must verify the information and bears all risk for any inaccuracies. Any projections, opinions, assumptions or estimates used herein are for example purposes only and do not represent the current or future performance of the property. Marcus & Millichap Real Estate Investment Services is a service mark of Marcus & Millichap Real Estate Investment Services, Inc. © 2011 Marcus & Millichap ACT ID Y0080439 6 Offering more than 800 feet of street front retail visibility and easy access from Holman Road and Hammer Lane, the Hammer Crossings Shopping Center offers investors an opportunity to purchase a retail investment property in the retail ep- icenter of Stockton, California. The offering of Hammer Crossings is 100 percent leased to Burlington Coat Factory and Ross Dress for Less, two nationally recognized credit tenants with long-term year leases. Ross is a new 10-year lease. Burlington Coat Factory has been a tenant for over 10 years, and just renewed for 10 more years. Both tenants are publicly traded and combined have over 1,900 stores and a market cap of approximately $32 billion. Stockton is home to the University of Pacific College. A world renown college with nine separate specialty schools. Founded in 1851, the small specialty college has approximately 6,000 attendees and faculty. ·· Net Leased “Bulls-Eye” Investment | Secure Passive Cash Flow ·· Corporate Credit Tenants ·· Offered Below Replacement Cost | Low Replacement Rents ·· Two “Best in Class Industry Dominating Tenants” ·· Low Rent Per Square Foot Affords Modest Tenant Operational Cost Assisting in Increased Location Profitability ·· Tenant “Sweet-Spot” Location For Customer Base, Traffic, and Future Growth ·· Adjacent to Regional Auto Mall | 150,000 Annual Visitors ·· Perfect Net Leased Investment l Great Addition to a Portfolio, Desirable 1031 Opportunity l Exceptional “First Time” Acquisition Asset investment highlights executive overview1 MILE 3 MILES 5 MILES 2016 Population 4,410 41,700 71,291 2016 Households 2,169 20,445 35,879 2016 Average Household Size 2.16 2.03 2.01 2016 Daytime Population 5,967 28,186 43,955 2016 Owner Occupied Housing Units 51.20% 64.22% 70.16% 2016 Renter Occupied Housing Units 48.80% 35.78% 29.87% 2016 Average Household Income $72,751 $88,088 $96,548 Stockton Immediate Trade Area Fresno Sacramento California National Annual Population Growth Rate 1.45% 0.85% 0.89% 0.87% 0.84% Household Growth Rate 1.19% 0.71% 0.77% 0.79% 0.79% Housing Unit Growth Rate 1.0% 0.6% 0.5% 0.5% 0.7% Average Household Income $71,673 $63,852 $69,352 $90,812 $77,008
- 10. 7 This information has been secured from sources we believe to be reliable, but we make no representations or warranties, expressed or implied, as to the accuracy of the information. References to square footage or age are approximate. Buyer must verify the information and bears all risk for any inaccuracies. Any projections, opinions, assumptions or estimates used herein are for example purposes only and do not represent the current or future performance of the property. Marcus & Millichap Real Estate Investment Services is a service mark of Marcus & Millichap Real Estate Investment Services, Inc. © 2011 Marcus & Millichap ACT ID Y0080439 ross overview Financial Position Ross’ 2016 second quarter same store stores rose 4 percent on top off a 4 percent increase in 2015. Ross’ financial structure remains healthy; debt was essentially flat year-over-year and is more covered by cash balances of $928.9 million, up 47 percent year-over-year. Off-Price Concept Off-price stores such as TJX Companies and Ross have been able to perform better than department stores, even during difficult eco- nomic times, due to the bargain deals that they offer consumers. So how do off-price retailers like Ross make profits? Ross acquires the majority of its merchandise through opportunistic purchas- es arising from manufacturer overruns and canceled orders both during and at the end of a fashion season. The company refers to these purchases as “close-out” and “packaway” purchases. General- ly, close-out purchases can be shipped to stores in-season, allowing Ross to obtain in-season merchandise at lower prices. The purchase of packaway merchandise helps Ross to increase the proportion of popular national brands in its merchandise at competitive savings. Ross, like its other off-price counterparts, keeps its stores simple and has no window displays, mannequins, fancy fixtures, or decora- tions. This ensures that the company can pass more savings on to its customers. About Ross Dress For Less A leading off-price apparel retailer (behind TJX Cos. and Kohl’s), Ross op- erates more than 1,340 Ross Dress for Less and 170-plus dd’s DISCOUNTS stores that sell closeout merchandise, including men’s, women’s, and children’s clothing, at prices well below those of department and specialty stores. While apparel accounts for more than half of sales, it also sells small furnishings, toys and games, luggage, and jewel- ry. Featuring the Ross “Dress for Less” trademark, the chain targets 18- to 54-year-old white-collar shoppers from primarily middle-income households. Ross and dd’s stores are located in strip malls in nearly 35 states, mostly in the western US, and Guam. Key Data Type Public Traded As NASDAQ: ROST Industry Retail Founded 1950 Founder Bill Isackson Headquarters Dublin, California Key People Barbara Rentler, CEO Revenue $12.87 Billion (2016) Number of Locations 1,342 (2016) Number of Employees 77,800 (January 2016) Subsidaries dd’s Discounts Website www.rossstores.com
- 11. This information has been secured from sources we believe to be reliable, but we make no representations or warranties, expressed or implied, as to the accuracy of the information. References to square footage or age are approximate. Buyer must verify the information and bears all risk for any inaccuracies. Any projections, opinions, assumptions or estimates used herein are for example purposes only and do not represent the current or future performance of the property. Marcus & Millichap Real Estate Investment Services is a service mark of Marcus & Millichap Real Estate Investment Services, Inc. © 2011 Marcus & Millichap ACT ID Y0080439 8 burlington coat factory overview Financial Position Burlington has demostrated a solid financial position on the stock exchange with impressive average earnings of 25.6 percent for the trailing four quarters and a long- term earnings growth rate of 19.9 percent. The stock more than doubled in 2016. In June 2016, it was an- nounced that Burlington Stores had joined the Fortune 500 for the first time. Burlington Stores’ 2016 third quarter same store sales rose 3.7 percent, its 15th consecutive quarter of positive comps. Store traffic has increased in eight out of the last nine quarters bucking industry trends. Baby Depot was one of the top performing businesses during the quarter. The company completed its fiscal store opening pro- gram with 25 new locations. Its store pipeline is on track to pen approximately 30 new stores in fiscal 2017. Management also remains confident it can reach 1,000 stores over the long-term. About Burlington Coat Factory Founded in Burlington, New Jersey, Burlington is a leading off-price apparel and home product re- tailer. The retail chain operates 567 stores in 45 states and Puerto Rico, offering a large assort- ment of current, high-quality, designer and name- brand merchandise at up to 65 percent off other retailers’ prices. Burlington Coat Factory operates under the mission of being “a convenient one- stop shopping experience with the labels you love, at prices you’ll love even more.” The company also operates MJM Designers Shoes, Cohoes Fashions, and the Super Baby De- pot. In 2006, Bain Capital acquired the company and took it private. Key Data Type Public Traded As NYSE: BURL Industry Retail Founded 1972 Founder Monroe Milstein Headquarters Florence, New Jersey Key People Tom Kingsbury, President Revenue $4.7 Billion (2013) Number of Locations 591 Number of Employees 28,000 Website burlingtoncoatfactory.com
- 13. This information has been secured from sources we believe to be reliable, but we make no representations or warranties, expressed or implied, as to the accuracy of the information. References to square footage or age are approximate. Buyer must verify the information and bears all risk for any inaccuracies. Any projections, opinions, assumptions or estimates used herein are for example purposes only and do not represent the current or future performance of the property. Marcus & Millichap Real Estate Investment Services is a service mark of Marcus & Millichap Real Estate Investment Services, Inc. © 2011 Marcus & Millichap ACT ID Y0080439 10 parcel overview location 3702 East Hammer Lane Stockton, California 95212 site The subject property has frontage along East Telstar Place, Holan Road, and East Hammer Lane. square footage The building square footage is 101,201-square feet and the lot size of the entire cen- ter is 12.43 acres. year built The property was built in 1991. It was completely renovated in 2016. traffic counts Holman Road boasts traffic counts of over 16,700 cars per day. East Hammer Lane has traffic counts of more than 43,000 cars per day.
- 14. E Telstar Place Auto Center Circle E Hammer Lane - 43,000 Cars Per Day HolmanRoad-16,700CarsPerDay 11 This information has been secured from sources we believe to be reliable, but we make no representations or warranties, expressed or implied, as to the accuracy of the information. References to square footage or age are approximate. Buyer must verify the information and bears all risk for any inaccuracies. Any projections, opinions, assumptions or estimates used herein are for example purposes only and do not represent the current or future performance of the property. Marcus & Millichap Real Estate Investment Services is a service mark of Marcus & Millichap Real Estate Investment Services, Inc. © 2011 Marcus & Millichap ACT ID Y0080439
- 15. 12 HAMMER Crossings This information has been secured from sources we believe to be reliable, but we make no representations or warranties, expressed or implied, as to the accuracy of the information. References to square footage or age are approximate. Buyer must verify the information and bears all risk for any inaccuracies. Any projections, opinions, assumptions or estimates used herein are for example purposes only and do not represent the current or future performance of the property. Marcus & Millichap Real Estate Investment Services is a service mark of Marcus & Millichap Real Estate Investment Services, Inc. © 2011 Marcus & Millichap ACT ID Y0080439 HolmanRoad-16,700CPD E Hammer Lane - 43,000 Cars Per Day StateRoute99-100,100CarsPerDay Cesar Chavez High School
- 16. HAMMER Crossings The Stockton Auto Mall Cesar Chavez High School George W. Bush Elementary School Saint Mary’s High School Calaveras Square Shopping Center Maxine Hong Kingston Elementary School Humphreys University 1,159 Students 13 This information has been secured from sources we believe to be reliable, but we make no representations or warranties, expressed or implied, as to the accuracy of the information. References to square footage or age are approximate. Buyer must verify the information and bears all risk for any inaccuracies. Any projections, opinions, assumptions or estimates used herein are for example purposes only and do not represent the current or future performance of the property. Marcus & Millichap Real Estate Investment Services is a service mark of Marcus & Millichap Real Estate Investment Services, Inc. © 2011 Marcus & Millichap ACT ID Y0080439 Ronald E. McNair High School Westwood Elementary School Rio Las Palmas E Hammer Lane - 43,000 CPD Holman Road - 16,700 Cars Per Day - 8 Separate Dealerships - Over 150,000 Annual Visitors
- 18. Kevin Boeve Senior Vice President Investments ONTARIO OFFICE Tel: (909) 456-3450 kevin.boeve@marcusmillichap.com CA License: 01247016 Joshua Rey Associate ONTARIO OFFICE Tel: (909) 456-7015 joshua.rey@marcusmillichap.com CA License: 1776485 PRESENTED BY HAMMER Crossings