Tech Startup Growth Hacking 101 - Basics on Growth Marketing
BRELF II Fund Factsheet and Loan Portfolio Details
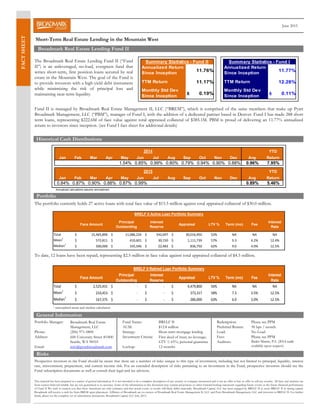
1. The portfolio currently holds 27 active loans with total face value of $15.5 million against total appraised collateral of $30.0 million.
To date, 12 loans have been repaid, representing $2.5 million in face value against total appraised collateral of $4.5 million.
Portfolio Manager: Fund Name: BRELF II Redemption: Please see PPM
AUM: $12.8 million Preferred Return: 50 bps / month
Phone: (206) 971-0800 Strategy: Short-term mortgage lending Load: No Load
Address: Investment Criteria: Fees: Please see PPM
Auditors:
Email: info@pyattbroadmark.com Lockup: 12 months
The Broadmark Real Estate Lending Fund II (“Fund
II”) is an unleveraged, no-load, evergreen fund that
writes short-term, first position loans secured by real
estate in the Mountain West. The goal of the Fund is
to provide investors with a high-yield debt instrument
while minimizing the risk of principal loss and
maintaining near-term liquidity.
Fund II is managed by Broadmark Real Estate Management II, LLC (“BREM”), which is comprised of the same members that make up Pyatt
Broadmark Management, LLC (“PBM”), manager of Fund I, with the addition of a dedicated partner based in Denver. Fund I has made 288 short
term loans, representing $222.6M of face value against total appraised collateral of $385.1M. PBM is proud of delivering an 11.77% annualized
return to investors since inception. (see Fund I fact sheet for additional details)
FACTSHEET
Prospective investors in the Fund should be aware that there are a number of risks unique to this type of investment, including but not limited to principal, liquidity, interest
rate, reinvestment, prepayment, and current income risk. For an extended description of risks pertaining to an investment in the Fund, prospective investors should see the
Fund subscription documents as well as consult their legal and tax advisors.
Broadmark Real Estate
Management, LLC
600 University Street #1800
Seattle, WA 98101
First deed of trust; no leverage;
LTV ≤ 65%; personal guarantee Bader Martin, P.S. (2014 audit
available upon request)
This material has been prepared as a matter of general information. It is not intended to be a complete description of any security or company mentioned and is not an offer to buy or offer to sell any security. All facts and statistics are
from sources believed reliable, but are not guaranteed as to accuracy. Some of the information in this document may contain projections or other forward-looking statements regarding future events or the future financial performance
of Fund II We wish to caution you that these statements are only estimates and that actual events or results will likely differ materially. Broadmark Capital, LLC has been engaged by BRELF II to assist BRELF II in raising capital.
Broadmark will receive a cash fee from BREM upon placement. Affiliates of Broadmark are co-owners of Broadmark Real Estate Management II, LLC and Pyatt Broadmark Management, LLC and investors in BRELF II. For further
detail, please see the complete set of subscription documents. Broadmark Capital, LLC July, 2015.
June 2015 June 2015
Broadmark Real Estate Lending Fund II
Short-Term Real Estate Lending in the Mountain West
Historical Cash Distributions
Portfolio
General Information
Risks
1 unweighted mean and median calculation
Annualized calculations assume reinvestment.
Face Amount
Principal
Outstanding
Interest
Reserve
Appraisal LTV % Term (mo) Fee
Interest
Rate
Total 2,525,431$ ‐$ ‐$ 4,479,800$ 56% NA NA NA
Mean
1
210,453$ ‐$ ‐$ 373,317$ 58% 7.3 3.5% 12.5%
Median
1
167,375$ ‐$ ‐$ 280,000$ 63% 6.0 3.0% 12.5%
BRELF II Retired Loan Portfolio Summary
Face Amount
Principal
Outstanding
Interest
Reserve
Appraisal LTV % Term (mo) Fee
Interest
Rate
Total 15,465,890$ 11,086,224$ 542,697$ 30,016,950$ 52% NA NA NA
Mean1
572,811$ 410,601$ 30,150$ 1,111,739$ 57% 9.3 4.2% 12.4%
Median1
500,000$ 335,546$ 22,483$ 836,750$ 62% 9.0 4.0% 12.5%
BRELF II Active Loan Portfolio Summary
YTD
Jan Feb Mar Apr May Jun Jul Aug Sep Oct Nov Dec Avg Return
1.54% 0.85% 0.99% 0.80% 0.79% 0.94% 0.90% 0.88% 0.96% 7.95%
YTD
Jan Feb Mar Apr May Jun Jul Aug Sep Oct Nov Dec Avg Return
0.84% 0.87% 0.90% 0.88% 0.87% 0.99% 0.89% 5.46%
2014
2015
0.19%
Annualized Return
Since Inception
11.76%
TTM Return 11.17%
Monthly Std Dev
Since Inception
±
Summary Statistics - Fund II
Monthly Std Dev
Since Inception
± 0.11%
Summary Statistics - Fund I
Annualized Return
Since Inception
11.77%
TTM Return 12.28%
2. 1
unweighted mean and median calculation
Prospective investors in the Fund should be aware that there are a number of risks unique to this type of investment, including but not limited to principal, liquidity, interest rate,
reinvestment, prepayment, and current income risk. For an extended description of risks pertaining to an investment in the Fund, prospective investors should see the Fund subscription
documents as well as consult their legal and tax advisors.
June 2015
This material has been prepared as a matter of general information. It is not intended to be a complete description of any security or company mentioned and is not an offer to buy or offer to sell any security. All facts and statistics are
from sources believed reliable, but are not guaranteed as to accuracy. Some of the information in this document may contain projections or other forward-looking statements regarding future events or the future financial performance
of Fund II We wish to caution you that these statements are only estimates and that actual events or results will likely differ materially. Broadmark Capital, LLC has been engaged by BRELF II to assist BRELF II in raising capital.
Broadmark will receive a cash fee from BREM upon placement. Affiliates of Broadmark are co-owners of Broadmark Real Estate Management II, LLC and Pyatt Broadmark Management, LLC and investors in BRELF II. For further
detail, please see the complete set of subscription documents. Broadmark Capital, LLC July, 2015.
Risks
Loan #
Face
Amount
Principal
Outstanding
Interest
Reserve
Appraisal LTV % Loan Type Location
Date
Funded
Original
Term (mo)
Due Fee
Interest
Rate
C2014-002 780,000$ 727,680$ 15,195$ 1,200,000$ 65% Construction Denver, CO 6/13/14 9 9/1/15 5.0% 12.5%
C2014-003 240,000$ 241,125$ -$ 451,000$ 53% Construction Denver, CO 7/10/14 12 8/1/15 5.0% 12.5%
C2014-007 506,850$ 466,473$ -$ 787,000$ 64% Construction Grantsville, UT 8/29/14 6 8/1/15 3.0% 12.5%
C2014-011 863,738$ 401,407$ 55,817$ 1,350,000$ 64% Construction Denver, CO 10/28/14 12 11/1/15 4.0% 12.5%
C2014-014 629,104$ 580,619$ 29,185$ 968,000$ 65% Construction Denver, CO 11/26/14 9 9/1/15 4.0% 12.5%
C2014-015 100,000$ 100,000$ -$ 208,000$ 48% Investment property Granby, CO 11/28/14 12 12/1/15 10.0% 12.5%
C2014-016 500,000$ 420,992$ 8,008$ 2,300,000$ 22% Investment property Gunlock, UT 12/4/14 12 1/1/16 5.0% 12.5%
C2014-017 552,151$ 250,015$ 17,965$ 850,000$ 65% Construction Denver, CO 12/12/14 9 10/1/15 4.0% 12.5%
C2014-018 382,241$ 330,749$ 1,053$ 614,200$ 62% Construction Denver, CO 12/26/14 9 10/1/15 3.5% 12.5%
C2015-001 335,536$ 335,536$ -$ 620,000$ 54% Investment property Aurora, CO 1/28/15 12 2/1/16 5.0% 12.5%
C2015-002 260,650$ 92,019$ 6,831$ 401,000$ 65% Construction Saratoga Springs, UT 2/11/15 9 12/1/15 3.5% 12.5%
C2015-003 543,000$ 498,934$ 10,266$ 836,750$ 65% Construction Colorado Springs, CO 2/20/15 6 9/1/15 3.5% 12.5%
C2015-004 1,000,000$ 894,294$ 57,932$ 1,750,000$ 57% Construction Aurora, CO 2/27/15 9 1/1/16 3.0% 12.5%
C2015-006 282,396$ 241,563$ 17,665$ 435,000$ 65% Construction Aurora, CO 3/13/15 9 1/1/16 4.0% 12.5%
C2015-007 1,000,000$ 430,000$ -$ 1,950,000$ 51% Construction Sandy, UT 3/26/15 12 4/1/16 5.0% 12.5%
C2015-008 980,000$ 1,086,000$ -$ 2,040,000$ 48% Investment property Salt Lake City, UT 4/1/15 12 5/1/16 5.0% 12.0%
C2015-010 243,500$ 42,566$ 8,292$ 375,000$ 65% Construction Lyons, CO 4/9/15 9 2/1/16 3.5% 12.5%
C2015-012 307,810$ 274,668$ 13,642$ 555,000$ 55% Construction Denver, CO 4/28/15 6 11/1/15 3.0% 12.0%
C2015-013 308,750$ 308,750$ -$ 475,000$ 65% Investment property Pueblo, CO 4/28/15 6 11/1/15 3.0% 12.0%
C2015-014 488,000$ 382,649$ 39,601$ 980,000$ 50% construction Denver, CO 5/7/15 9 3/1/16 4.0% 12.5%
C2015-015 988,000$ 335,546$ 58,954$ 1,520,000$ 65% Construction Colorado Springs, CO 5/15/15 8 2/1/16 3.5% 12.5%
C2015-017 402,000$ 368,171$ 33,829$ 760,000$ 53% Investment property Brighton, CO 5/28/15 9 3/1/16 4.0% 12.5%
C2015-018 1,200,000$ 617,172$ 86,040$ 1,850,000$ 65% Construction Salt Lake City, UT 5/29/15 10 4/1/16 3.4% 12.0%
C2015-020 189,750$ 164,615$ 27,000$ 345,000$ 55% Investment property Nederland, CO 5/28/15 12 6/1/16 5.0% 12.5%
C2015-021 1,200,000$ 1,090,000$ -$ 4,506,000$ 27% Construction Biedseye, UT 6/3/15 12 7/1/16 5.0% 12.5%
C2015-022 240,500$ 240,500$ -$ 370,000$ 65% Investment property Denver, CO 6/3/15 6 1/1/16 3.0% 12.5%
C2015-023 941,914$ 164,181$ 55,421$ 1,520,000$ 62% Construction El Paso, CO 6/10/15 6 1/1/16 3.5% 12.5%
Total 15,465,890$ 11,086,224$ 542,697$ 30,016,950$ 52%
Mean1
572,811$ 410,601$ 30,150$ 1,111,739$ 57% 9.3 4.2% 12.4%
Median
1
500,000$ 335,546$ 22,483$ 836,750$ 62% 9.0 4.0% 12.5%
BRELF II Active Loan Portfolio Summary (27 Loans)
Loan #
Face
Amount
Principal
Outstanding
Interest
Reserve Appraisal LTV % Loan Type Location
Date
Funded
Original
Term (mo) Paid Fee
Interest
Rate
C2014-005 260,000$ -$ -$ 750,000$ 35% Bridge Fraser, CO 7/18/14 6 10/16/14 3.0% 12.5%
C2014-006 111,000$ -$ -$ 175,000$ 63% Development Denver, CO 7/25/14 6 11/26/14 3.0% 12.5%
C2014-009 152,750$ -$ -$ 235,000$ 65% Investment property Denver, CO 9/5/14 12 12/18/14 5.0% 12.5%
C2014-008 266,275$ -$ -$ 410,000$ 65% Construction Milliken, CO 8/29/14 6 3/12/15 3.0% 12.5%
C2014-012 144,800$ -$ -$ 270,800$ 53% Investment property Denver, CO 11/4/14 6 3/20/15 2.5% 12.5%
C2015-005 260,206$ -$ -$ 450,000$ 58% Construction Sandy, UT 2/27/15 6 3/31/15 3.0% 12.5%
C2014-010 182,000$ -$ -$ 280,000$ 65% Construction Aurora, CO 10/8/14 9 4/18/15 4.0% 12.5%
C2015-009 104,500$ -$ -$ 224,000$ 47% Investment property Lafayett, CO 4/8/15 6 5/4/15 4.8% 12.5%
C2014-001 282,000$ -$ -$ 455,000$ 62% Investment property Denver, CO 5/9/14 12 6/3/15 5.0% 12.5%
C2015-011 143,000$ -$ -$ 280,000$ 51% Investment property Sandy, UT 4/14/15 6 6/11/15 3.5% 12.5%
C2014-013 149,500$ -$ -$ 230,000$ 65% Construction Kanab, UT 11/24/14 6 6/25/15 2.8% 12.5%
C2014-004 469,400$ -$ -$ 720,000$ 65% Construction Colorado Springs, CO 7/15/14 6 6/30/15 3.0% 12.5%
Total 2,525,431$ -$ -$ 4,479,800$ 56%
Mean
1
210,453$ -$ -$ 373,317$ 58% 7.3 3.5% 12.5%
Median
1
167,375$ -$ -$ 280,000$ 63% 6.0 3.0% 12.5%
BRELF I Retired Loan Portfolio Summary (12 Loans)