SlideShare a Scribd company logo
1 of 15
Download to read offline
Refinance Valuation Analysis
Prepared for: Pennix & Penix Trusts
May 25, 2016
7888 Othello Avenue
San Diego CA 92111
Commercial / Industrial
Morning Star Real Estate Services
Brokerage, Asset Mgmt.,
Land Use Planning & Development
P.O. Box 60506
San Diego, CA 92166
Suhail Khalil, CCIM, GRI
(619) 224-1527
over 25 years experience
"working for you to build a better future"
MorningStar.RESVC@cox.net
Property Summary
7888 Othello Avenue
San Diego CA 92111
Commercial / Industrial
Operating Statement
Gross Scheduled Income $129,982.70
- Vacancy Loss $649.91
= Gross Effective Income $129,332.79
+ Other Income $1,200.00
= Gross Operating Income $130,532.79
- Total Operating Expenses $16,985.70
= Net Operating Income (NOI) $113,547.09
Financial Statistics
Occupancy Percent 99.5%
Vacancy Percent 0.5%
Monthly Income Per Unit $10,831.89
Monthly Income Per Sq Ft $1.72
Annual Expenses Per Unit $16,985.70
Annual Expenses per Sq Ft $2.70
Gross Rent Multiplier 16.93
Cap Rate 5.16%
Existing Owner's Property Data
Current Value $2,200,000.00
Number of Units 1
Number Occupied 1
Number Vacant
Price Per Unit $2,200,000.00
Rentable Sq Ft 6,283
Price Per Sq Ft $350.15
Taxes $11,375.04
Insurance $1,500.00
Year Built 1968
Land Area 29,620
Buildings 1
Stories 1
Electric Meters 1
Gas Meters 1
Parking Spaces 16
Roof Flat Slurry
Zoning M / IL-3-1
Amenities and Features
$650 Loan Scenario = $540,000 Chase loan pay-off + $105,000+ cash out net proceeds after close of escrow
Wells Fargo Bank rates without "cash-out"
5/25: 3.45%
7/25: 3.85%
10/25: 4.10%
Closing Costs: All programs
Loan Fee $0
Misc. Lender Fees $200
Appraisal Fee $3,000 +/- (by bid)
Title Market ($1,000 est.)
Escrow Market ($500 est.)
Recording Fees Normal, usually less than $200
After Close of Escrow we will rebate .50% of the appraisal cost
Prepared By
Suhail Khalil, CCIM, GRI, Morning Star Real Estate Services, Brokerage, Asset Mgmt.
Land Use Planning & Development, P.O. Box 60506, San Diego, CA 92166, (619) 224-1527, over 25 years experience
"working for you to build a better future", MorningStar.RESVC@cox.net
This report has been prepared based on information furnished by sources deemed reliable, however no representation or
warranty, either express or implied, is made to its accuracy.
Amortization Schedule
7888 Othello Avenue
San Diego CA 92111
Commercial / Industrial
1st MTG - Fxd, Fully Amortized
Loan Amount $560,000.00
Loan to Value (LTV) 0.00%
Interest Rate 4.100%
Term (Due Date) 0.0 Years
Points 0.0%
Extra Monthly Payment 0.0%
Amortization Table with Annual Values
Year Payment Principal Interest Total Paid Loan Balance
1 $2,986.89 $1,093.97 $1,892.92 $35,842.68 $546,872.40
2 $2,986.89 $1,139.67 $1,847.22 $71,685.36 $533,196.34
3 $2,986.89 $1,187.29 $1,799.60 $107,528.04 $518,948.90
4 $2,986.89 $1,236.89 $1,750.00 $143,370.72 $504,106.21
5 $2,986.89 $1,288.57 $1,698.32 $179,213.40 $488,643.41
6 $2,986.89 $1,342.40 $1,644.49 $215,056.08 $472,534.58
7 $2,986.89 $1,398.49 $1,588.40 $250,898.76 $455,752.74
8 $2,986.89 $1,456.91 $1,529.98 $286,741.44 $438,269.76
9 $2,986.89 $1,517.78 $1,469.11 $322,584.12 $420,056.36
10 $36,410.39 $35,004.70 $1,405.69 $759,508.81 $0.00
Prepared By
Suhail Khalil, CCIM, GRI, Morning Star Real Estate Services, Brokerage, Asset Mgmt.
Land Use Planning & Development, P.O. Box 60506, San Diego, CA 92166, (619) 224-1527, over 25 years experience
"working for you to build a better future", MorningStar.RESVC@cox.net
This report has been prepared based on information furnished by sources deemed reliable, however no representation or
warranty, either express or implied, is made to its accuracy.
Existing Owner's Annual Property Operating DataYear 1
7888 Othello Avenue
San Diego CA 92111
Commercial / Industrial
Annual Income
Gross Scheduled Income $129,982.70
- Vacancy $649.91
= Effective Rental Income $129,332.79
+ Other Income $1,200.00
= Gross Operating Income $130,532.79
Annual Operating Expenses
Taxes $11,375.04
+ Insurance $1,500.00
+ Property Management $2,610.66
+ Maintenance & Repair $600.00
+ Utilities $0.00
+ Services $0.00
+ Other Expenses $900.00
= Annual Operating Expenses $16,985.70
Net Operating Income
Gross Operating Income $130,532.79
- Annual Operating Expenses $16,985.70
= Net Operating Income $113,547.09
Annual Debt Service
1st Mortgage Debt Service $35,842.68
Annual Cash Flow Before Tax
Net Operating Income $113,547.09
- Annual Debt Service $35,842.68
- Capital Additions $0.00
= Cash Flow Before Tax $77,704.41
Original Investment
Current Value $2,200,000.00
Purchase Price $580,000.00
Down Payment $290,000.00
+ Closing Costs $11,600.00
+ Loan Points $1,450.00
+ Other Costs $0.00
= Total Investment $303,050.00
Existing Financing
1st Mortgage Loan Balance $560,000.00
Monthly Payment (P&&I) $2,986.90
Interest Rate 4.10%
Remaining Amortization Period 25.0 years
Equity Before Tax
Current Value $2,200,000.00
- 1st Mortgage Loan Balance $560,000.00
+ Replacement Reserve Balance $0.00
= Gross Equity Before Tax $1,640,000.00
- 6.00 % Cost of Sale $136,840.00
= Net Equity Before Tax $1,503,160.00
Indicators
Cap Rate 5.16%
Gross Rent Multiplier 16.93
Cash on Original Cash 25.64%
Debt Coverage Ratio 3.17
Modified DCR 3.17
Default Ratio (Break Even) 40.47
Return on Gross Equity 4.74%
Prepared By
Suhail Khalil, CCIM, GRI, Morning Star Real Estate Services, Brokerage, Asset Mgmt.
Land Use Planning & Development, P.O. Box 60506, San Diego, CA 92166, (619) 224-1527, over 25 years experience
"working for you to build a better future", MorningStar.RESVC@cox.net
This report has been prepared based on information furnished by sources deemed reliable, however no representation or
warranty, either express or implied, is made to its accuracy.
Property Details
7888 Othello Avenue
San Diego CA 92111
Commercial / Industrial
Future Value Escalator
Year 1 Year 2 Year 3 Year 4
Appreciation 4.00% 4.00% 5.00% 5.00%
Vacancy Percent -- C:Calculate or U:Use data until next month
Description Month 1
Vacant 0.5% U
Other Income -- Future years use year 5 data with a % annual escalator
Year 1 Year 2 Year 3 Year 4 Year 5
Tax reimbursement $1,200.00 $1,200.00 $1,200.00 $1,200.00 $1,200.00
Income Escalators
Gross Scheduled Income
Other Income
Expenses: Utilities -- Future years use year 5 data with a % annual escalator
Year 1 Year 2 Year 3 Year 4 Year 5
Expenses: Services -- Future years use year 5 data with a % annual escalator
Year 1 Year 2 Year 3 Year 4 Year 5
Expenses: Other -- Future years use year 5 data with a % annual escalator
Year 1 Year 2 Year 3 Year 4 Year 5
Legal fees $600.00 $600.00 $600.00 $600.00 $600.00
Consulting fees $300.00 $300.00 $300.00 $300.00 $300.00
Expense Escalators
Expenses
Cost Recovery Period
Improvements Years 27.5
Personal Property Years 5.0
Other Assumptions
Tax Bracket 28.00%
Cost to Sell Property 6.00%
NPV Discount Rate 7.00%
Investment Comparisons
Bank CD Rate 2.00%
Mutual Fund 4.00%
Prepared By
Suhail Khalil, CCIM, GRI, Morning Star Real Estate Services, Brokerage, Asset Mgmt.
Land Use Planning & Development, P.O. Box 60506, San Diego, CA 92166, (619) 224-1527, over 25 years experience
"working for you to build a better future", MorningStar.RESVC@cox.net
This report has been prepared based on information furnished by sources deemed reliable, however no representation or
warranty, either express or implied, is made to its accuracy.
Rent Roll at Month 1 Showing Monthly Numbers
7888 Othello Avenue
San Diego CA 92111
Commercial / Industrial
Rent Roll Summary
Total Units 1
Vacant Units
Occupied Units 1
Possible Rent $129,982.70
- Vacancy Rent $649.91
= Occupied Rent $129,332.79
Occupied 99.5%
Vacant 0.5%
Row Tenant SqFt Rent/SqFt CAMS Rent Income
0 CRAM-KM 6,283 $1.724 $0.00 $10,831.89 $10,831.89
Prepared By
Suhail Khalil, CCIM, GRI, Morning Star Real Estate Services, Brokerage, Asset Mgmt.
Land Use Planning & Development, P.O. Box 60506, San Diego, CA 92166, (619) 224-1527, over 25 years experience
"working for you to build a better future", MorningStar.RESVC@cox.net
This report has been prepared based on information furnished by sources deemed reliable, however no representation or
warranty, either express or implied, is made to its accuracy.
Portfolio Financing Spreadsheet
7888 Othello Avenue
San Diego CA 92111
Commercial / Industrial
PRICE Year 1 Year 2 Year 3 Year 4 Year 5
Current Value $2,200,000.00 $2,200,000.00 $2,200,000.00 $2,200,000.00 $2,200,000.00
Escalated Price $2,200,000.00 $2,288,000.00 $2,379,520.00 $2,498,496.00 $2,623,420.80
Price Escalator: Appreciation 4.00 % 4.00 % 5.00 % 5.00 % 5.00 %
INITIAL INVEST. AT ACQUISITION
Down Payment $290,000.00 $290,000.00 $290,000.00 $290,000.00 $290,000.00
+ Closing Costs +$11,600.00 +$11,600.00 +$11,600.00 +$11,600.00 +$11,600.00
+ Loan Points +$1,450.00 +$1,450.00 +$1,450.00 +$1,450.00 +$1,450.00
+ Other Costs +$0.00 +$0.00 +$0.00 +$0.00 +$0.00
= Total Investment =$303,050.00 =$303,050.00 =$303,050.00 =$303,050.00 =$303,050.00
1st MTG - Fxd, Fully Amortized
Remaining Amort. Period 25.0 24.0 23.0 22.0 21.0
Annual Principal $13,127.61 $13,676.06 $14,247.44 $14,842.70 $15,462.81
+ Annual Interest +$22,715.07 +$22,166.62 +$21,595.24 +$20,999.98 +$20,379.87
= Annual Debt Service =$35,842.68 =$35,842.68 =$35,842.68 =$35,842.68 =$35,842.68
Loan Balance (BOY) $560,000.00 $546,872.40 $533,196.34 $518,948.90 $504,106.21
= Annual Principal =$13,127.61 =$13,676.06 =$14,247.44 =$14,842.70 =$15,462.81
= Loan Balance (EOY) =$546,872.40 =$533,196.34 =$518,948.90 =$504,106.21 =$488,643.41
1st MTG - Fxd, Fully Amortized LOAN HISTORY
Date Loan Obtained Jun 30, 2016 Jun 30, 2016 Jun 30, 2016 Jun 30, 2016 Jun 30, 2016
Loan Amount $560,000.00 $560,000.00 $560,000.00 $560,000.00 $560,000.00
Term (Due Date) 10.0 Yrs 10.0 Yrs 10.0 Yrs 10.0 Yrs 10.0 Yrs
Points Paid $3,500.00 $3,500.00 $3,500.00 $3,500.00 $3,500.00
Prepared By
Suhail Khalil, CCIM, GRI, Morning Star Real Estate Services, Brokerage, Asset Mgmt.
Land Use Planning & Development, P.O. Box 60506, San Diego, CA 92166, (619) 224-1527, over 25 years experience
"working for you to build a better future", MorningStar.RESVC@cox.net
This report has been prepared based on information furnished by sources deemed reliable, however no representation or
warranty, either express or implied, is made to its accuracy.
Portfolio Before-Tax Cash Flow Spreadsheet
7888 Othello Avenue
San Diego CA 92111
Commercial / Industrial
ANNUAL INCOME Year 1 Year 2 Year 3 Year 4 Year 5
Gross Scheduled Income $129,982.70 $129,982.70 $129,982.70 $129,982.70 $129,982.70
- Vacancy -$649.91 -$649.91 -$649.91 -$649.91 -$649.91
= Effective Rental Income =$129,332.79 =$129,332.79 =$129,332.79 =$129,332.79 =$129,332.79
+ Other Income +$1,200.00 +$1,200.00 +$1,200.00 +$1,200.00 +$1,200.00
= Gross Operating Income =$130,532.79 =$130,532.79 =$130,532.79 =$130,532.79 =$130,532.79
ANNUAL OPERATING EXPENSES
Taxes $11,375.04 $11,375.04 $11,375.04 $11,375.04 $11,375.04
+ Insurance +$1,500.00 +$1,500.00 +$1,500.00 +$1,500.00 +$1,500.00
+ Property Management +$2,610.66 +$2,610.66 +$2,610.66 +$2,610.66 +$2,610.66
+ Maintenance & Repair +$600.00 +$600.00 +$600.00 +$600.00 +$600.00
+ Utilities +$0.00 +$0.00 +$0.00 +$0.00 +$0.00
+ Services +$0.00 +$0.00 +$0.00 +$0.00 +$0.00
+ Other Expenses +$900.00 +$900.00 +$900.00 +$900.00 +$900.00
= Annual Operating Expenses =$16,985.70 =$16,985.70 =$16,985.70 =$16,985.70 =$16,985.70
NET OPERATING INCOME
Gross Operating Income $130,532.79 $130,532.79 $130,532.79 $130,532.79 $130,532.79
- Annual Operating Expenses -$16,985.70 -$16,985.70 -$16,985.70 -$16,985.70 -$16,985.70
= Net Operating Income =$113,547.09 =$113,547.09 =$113,547.09 =$113,547.09 =$113,547.09
ANNUAL DEBT SERVICE
1st Mortgage $35,842.68 $35,842.68 $35,842.68 $35,842.68 $35,842.68
+ 2nd Mortgage +$0.00 +$0.00 +$0.00 +$0.00 +$0.00
+ 3rd Mortgage +$0.00 +$0.00 +$0.00 +$0.00 +$0.00
= Annual Debt Service =$35,842.68 =$35,842.68 =$35,842.68 =$35,842.68 =$35,842.68
ANNUAL CASH FLOW BEFORE TAX
Net Operating Income $113,547.09 $113,547.09 $113,547.09 $113,547.09 $113,547.09
- Annual Debt Service -$35,842.68 -$35,842.68 -$35,842.68 -$35,842.68 -$35,842.68
- Capital Additions -$0.00 -$0.00 -$0.00 -$0.00 -$0.00
= Annual Cash Flow Before Tax =$77,704.41 =$77,704.41 =$77,704.41 =$77,704.41 =$77,704.41
Prepared By
Suhail Khalil, CCIM, GRI, Morning Star Real Estate Services, Brokerage, Asset Mgmt.
Land Use Planning & Development, P.O. Box 60506, San Diego, CA 92166, (619) 224-1527, over 25 years experience
"working for you to build a better future", MorningStar.RESVC@cox.net
This report has been prepared based on information furnished by sources deemed reliable, however no representation or
warranty, either express or implied, is made to its accuracy.
Portfolio After-Tax Cash Flow Spreadsheet
7888 Othello Avenue
San Diego CA 92111
Commercial / Industrial
ANNUAL CASH FLOW BEFORE TAX Year 1 Year 2 Year 3 Year 4 Year 5
Gross Scheduled Income $129,982.70 $129,982.70 $129,982.70 $129,982.70 $129,982.70
- Vacancy -$649.91 -$649.91 -$649.91 -$649.91 -$649.91
= Effective Rental Income =$129,332.79 =$129,332.79 =$129,332.79 =$129,332.79 =$129,332.79
+ Other Income +$1,200.00 +$1,200.00 +$1,200.00 +$1,200.00 +$1,200.00
= Gross Operating Income =$130,532.79 =$130,532.79 =$130,532.79 =$130,532.79 =$130,532.79
- Annual Operating Expenses -$16,985.70 -$16,985.70 -$16,985.70 -$16,985.70 -$16,985.70
= Net Operating Income =$113,547.09 =$113,547.09 =$113,547.09 =$113,547.09 =$113,547.09
- Annual Debt Service -$35,842.68 -$35,842.68 -$35,842.68 -$35,842.68 -$35,842.68
- Capital Additions -$0.00 -$0.00 -$0.00 -$0.00 -$0.00
= Annual Cash Flow Before Tax =$77,704.41 =$77,704.41 =$77,704.41 =$77,704.41 =$77,704.41
REAL ESTATE TAXABLE INCOME
Net Operating Income $113,547.09 $113,547.09 $113,547.09 $113,547.09 $113,547.09
- Interest 1st Mortgage -$22,715.07 -$22,166.62 -$21,595.24 -$20,999.98 -$20,379.87
- Interest 2nd Mortgage -$0.00 -$0.00 -$0.00 -$0.00 -$0.00
- Interest 3rd Mortgage -$0.00 -$0.00 -$0.00 -$0.00 -$0.00
- Points Amortization -$350.00 -$350.00 -$350.00 -$350.00 -$350.00
- Cost Recovery (Improvements) -$0.00 -$0.00 -$0.00 -$0.00 -$0.00
- Cost Recovery (Personal) -$0.00 -$0.00 -$0.00 -$0.00 -$0.00
- Cost Recovery (Cap. Add.) -$0.00 -$0.00 -$0.00 -$0.00 -$0.00
- Historical CR (Cap. Add.) -$0.00 -$0.00 -$0.00 -$0.00 -$0.00
= R.E. Taxable Income (Loss) =$90,482.02 =$91,030.47 =$91,601.85 =$92,197.11 =$92,817.22
PASSIVE LOSS EXEMPTION
Passive Loss Exemption Available $0.00 $0.00 $0.00 $0.00 $0.00
Passive Losses Allowed $0.00 $0.00 $0.00 $0.00 $0.00
ANNUAL SUSPENDED LOSSES
R.E. Taxable Income (Loss) $90,482.02 $91,030.47 $91,601.85 $92,197.11 $92,817.22
Passive Losses Allowed $0.00 $0.00 $0.00 $0.00 $0.00
Annual Suspended Losses $0.00 $0.00 $0.00 $0.00 $0.00
TAX LIABILITY (SAVINGS)
R.E. Taxable Income (Min 0) $90,482.02 $91,030.47 $91,601.85 $92,197.11 $92,817.22
- Suspended Losses Allowed -$0.00 -$0.00 -$0.00 -$0.00 -$0.00
= Adjusted R.E. Taxable Income =$90,482.02 =$91,030.47 =$91,601.85 =$92,197.11 =$92,817.22
Tax Liability (Savings) @ 28.00% $25,334.97 $25,488.53 $25,648.52 $25,815.19 $25,988.82
ANNUAL CASH FLOW AFTER TAX
Annual Cash Flow Before Tax $77,704.41 $77,704.41 $77,704.41 $77,704.41 $77,704.41
- Tax Liability (Savings) @ 28 % -$25,334.97 -$25,488.53 -$25,648.52 -$25,815.19 -$25,988.82
Prepared By
Suhail Khalil, CCIM, GRI, Morning Star Real Estate Services, Brokerage, Asset Mgmt.
Land Use Planning & Development, P.O. Box 60506, San Diego, CA 92166, (619) 224-1527, over 25 years experience
"working for you to build a better future", MorningStar.RESVC@cox.net
This report has been prepared based on information furnished by sources deemed reliable, however no representation or
warranty, either express or implied, is made to its accuracy.
Portfolio After-Tax Cash Flow Spreadsheet
7888 Othello Avenue
San Diego CA 92111
Commercial / Industrial
Continued Year 1 Year 2 Year 3 Year 4 Year 5
ANNUAL CASH FLOW AFTER TAX
= Cash Flow After Tax =$52,369.44 =$52,215.88 =$52,055.89 =$51,889.22 =$51,715.59
Prepared By
Suhail Khalil, CCIM, GRI, Morning Star Real Estate Services, Brokerage, Asset Mgmt.
Land Use Planning & Development, P.O. Box 60506, San Diego, CA 92166, (619) 224-1527, over 25 years experience
"working for you to build a better future", MorningStar.RESVC@cox.net
This report has been prepared based on information furnished by sources deemed reliable, however no representation or
warranty, either express or implied, is made to its accuracy.
Portfolio After-Tax Proceeds from Sale Spreadsheet
7888 Othello Avenue
San Diego CA 92111
Commercial / Industrial
SALES PROCEEDS BEFORE TAX Year 1 Year 2 Year 3 Year 4 Year 5
Sale Price (EOY) $2,288,000.00 $2,379,520.00 $2,498,496.00 $2,623,420.80 $2,754,591.84
- Cost of Sale @ 6.00% -$137,280.00 -$142,771.20 -$149,909.76 -$157,405.25 -$165,275.51
- 1st Mortgage Loan Balance -$546,872.40 -$533,196.34 -$518,948.90 -$504,106.21 -$488,643.41
- 2nd Mortgage Loan Balance -$0.00 -$0.00 -$0.00 -$0.00 -$0.00
- 3rd Mortgage Loan Balance -$0.00 -$0.00 -$0.00 -$0.00 -$0.00
= Sale Proceeds before Tax =$1,603,847.60 =$1,703,552.46 =$1,829,637.34 =$1,961,909.34 =$2,100,672.92
BASIS AT ACQUISITION
Current Value $580,000.00 $580,000.00 $580,000.00 $580,000.00 $580,000.00
+ Capitalized Closing Costs +$11,600.00 +$11,600.00 +$11,600.00 +$11,600.00 +$11,600.00
+ Basis Adjustments +$0.00 +$0.00 +$0.00 +$0.00 +$0.00
= Basis at Acquisition =$591,600.00 =$591,600.00 =$591,600.00 =$591,600.00 =$591,600.00
HISTORICAL COST RECOVERY (CR)
Historical CR (Improvements) $353,929.18 $0.00 $0.00 $0.00 $0.00
+ Historical CR (Personal) +$0.00 +$0.00 +$0.00 +$0.00 +$0.00
+ Historical CR (Cap. Add.) +$0.00 +$0.00 +$0.00 +$0.00 +$0.00
= Historical Cost Recovery Taken =$353,929.18 =$0.00 =$0.00 =$0.00 =$0.00
COST RECOVERY (CR)
Annual CR (Improvements) $0.00 $0.00 $0.00 $0.00 $0.00
+ Annual CR (Personal) +$0.00 +$0.00 +$0.00 +$0.00 +$0.00
+ Annual CR (Cap. Add.) +$0.00 +$0.00 +$0.00 +$0.00 +$0.00
= Annual Cost Recovery Taken =$0.00 =$0.00 =$0.00 =$0.00 =$0.00
Total Cost Recovery Taken $0.00 $0.00 $0.00 $0.00 $0.00
ADJUSTED BASIS AT SALE
Basis at Beginning of Year $591,600.00 $237,670.82 $237,670.82 $237,670.82 $237,670.82
+ Historical Capital Additions +$0.00 +$0.00 +$0.00 +$0.00 +$0.00
+ Annual Capital Additions +$0.00 +$0.00 +$0.00 +$0.00 +$0.00
- Historical Cost Recovery Taken -$353,929.18 -$0.00 -$0.00 -$0.00 -$0.00
- Annual Cost Recovery Taken -$0.00 -$0.00 -$0.00 -$0.00 -$0.00
= Adjusted Basis at Sale =$237,670.82 =$237,670.82 =$237,670.82 =$237,670.82 =$237,670.82
GAIN (LOSS) ON SALE
Sale Price (EOY) $2,288,000.00 $2,379,520.00 $2,498,496.00 $2,623,420.80 $2,754,591.84
- Cost of Sale @ 6.00% -$137,280.00 -$142,771.20 -$149,909.76 -$157,405.25 -$165,275.51
- Adjusted Basis at Sale -$237,670.82 -$237,670.82 -$237,670.82 -$237,670.82 -$237,670.82
= Total Gain (Loss) =$1,913,049.18 =$1,999,077.98 =$2,110,915.42 =$2,228,344.73 =$2,351,645.51
- Total Cost Recovery Taken (LTG) -$0.00 -$0.00 -$0.00 -$0.00 -$0.00
Prepared By
Suhail Khalil, CCIM, GRI, Morning Star Real Estate Services, Brokerage, Asset Mgmt.
Land Use Planning & Development, P.O. Box 60506, San Diego, CA 92166, (619) 224-1527, over 25 years experience
"working for you to build a better future", MorningStar.RESVC@cox.net
This report has been prepared based on information furnished by sources deemed reliable, however no representation or
warranty, either express or implied, is made to its accuracy.
Portfolio After-Tax Proceeds from Sale Spreadsheet
7888 Othello Avenue
San Diego CA 92111
Commercial / Industrial
Continued Year 1 Year 2 Year 3 Year 4 Year 5
GAIN (LOSS) ON SALE
= Capital Gain from Apprec. (Min 0) =$1,913,049.18 =$1,999,077.98 =$2,110,915.42 =$2,228,344.73 =$2,351,645.51
TAXED AS ORDINARY INCOME
Unamortized Loan Points ($1,100.00) ($750.00) ($400.00) ($50.00) $300.00
+ Suspended Losses (from ATCF) +$0.00 +$0.00 +$0.00 +$0.00 +$0.00
+ Loss at Disposition +$0.00 +$0.00 +$0.00 +$0.00 +$0.00
= Taxed as Ordinary Income =($1,100.00) =($750.00) =($400.00) =($50.00) =$300.00
SALES PROCEEDS AFTER TAX
Sale Proceeds before Tax $1,603,847.60 $1,703,552.46 $1,829,637.34 $1,961,909.34 $2,100,672.92
- Tax (Savings) Ord. Inc. @ 28.00% -($308.00) -($210.00) -($112.00) -($14.00) -$84.00
- Cost Recovery Recapture @ 25.00% -$0.00 -$0.00 -$0.00 -$0.00 -$0.00
- Federal Tax on Gain @ 15.00% -$286,957.38 -$299,861.70 -$316,637.31 -$334,251.71 -$352,746.83
- State Tax on Gain @ 12.00% -$229,565.90 -$239,889.36 -$253,309.85 -$267,401.37 -$282,197.46
= Sale Proceeds after Tax =$1,087,632.32 =$1,164,011.41 =$1,259,802.18 =$1,360,270.26 =$1,465,644.63
Prepared By
Suhail Khalil, CCIM, GRI, Morning Star Real Estate Services, Brokerage, Asset Mgmt.
Land Use Planning & Development, P.O. Box 60506, San Diego, CA 92166, (619) 224-1527, over 25 years experience
"working for you to build a better future", MorningStar.RESVC@cox.net
This report has been prepared based on information furnished by sources deemed reliable, however no representation or
warranty, either express or implied, is made to its accuracy.
Portfolio Equity Spreadsheet
7888 Othello Avenue
San Diego CA 92111
Commercial / Industrial
SALES PROCEEDS BEFORE TAX Year 1 Year 2 Year 3 Year 4 Year 5
Sale Price (EOY) $2,288,000.00 $2,379,520.00 $2,498,496.00 $2,623,420.80 $2,754,591.84
- Cost of Sale @ 6.00% -$137,280.00 -$142,771.20 -$149,909.76 -$157,405.25 -$165,275.51
- 1st Mortgage Loan Balance -$546,872.40 -$533,196.34 -$518,948.90 -$504,106.21 -$488,643.41
- 2nd Mortgage Loan Balance -$0.00 -$0.00 -$0.00 -$0.00 -$0.00
- 3rd Mortgage Loan Balance -$0.00 -$0.00 -$0.00 -$0.00 -$0.00
= Sale Proceeds before Tax =$1,603,847.60 =$1,703,552.46 =$1,829,637.34 =$1,961,909.34 =$2,100,672.92
GROSS EQUITY AT PURCHASE
Down Payment $290,000.00 $290,000.00 $290,000.00 $290,000.00 $290,000.00
= Gross Equity at Purchase =$290,000.00 =$290,000.00 =$290,000.00 =$290,000.00 =$290,000.00
GROSS EQUITY (EOY)
Gross Equity (BOY) $1,640,000.00 $1,741,127.61 $1,846,030.34 $1,976,965.78 $2,116,237.54
+ Appreciation Equity +$88,000.00 +$91,226.67 +$116,688.00 +$124,429.07 +$130,650.52
+ Principal Paydown Equity +$13,127.61 +$13,676.06 +$14,247.44 +$14,842.70 +$15,462.81
= Gross Equity (EOY) =$1,741,127.61 =$1,846,030.34 =$1,976,965.78 =$2,116,237.54 =$2,262,350.87
GROSS EQUITY PLUS RESERVES
Gross Equity (EOY) $1,741,127.61 $1,846,030.34 $1,976,965.78 $2,116,237.54 $2,262,350.87
+ Reserve Balance +$0.00 +$0.00 +$0.00 +$0.00 +$0.00
= Total Gross Equity =$1,741,127.61 =$1,846,030.34 =$1,976,965.78 =$2,116,237.54 =$2,262,350.87
RETURN ON GROSS EQUITY (EOY)
Annual Cash Flow Before Tax $77,704.41 $77,704.41 $77,704.41 $77,704.41 $77,704.41
div Gross Equity (EOY) $1,741,127.61 $1,846,030.34 $1,976,965.78 $2,116,237.54 $2,262,350.87
= Return on Gross Equity =4.46 % =4.21 % =3.93 % =3.67 % =3.43 %
NET EQUITY (EOY)
Gross Equity (EOY) $1,741,127.61 $1,846,030.34 $1,976,965.78 $2,116,237.54 $2,262,350.87
- Cost of Sale @ 6.00% -$137,280.00 -$142,771.20 -$149,909.76 -$157,405.25 -$165,275.51
= Net Equity (EOY) =$1,603,847.61 =$1,703,259.14 =$1,827,056.02 =$1,958,832.30 =$2,097,075.36
INDICATORS
Cap Rate 5.16 % 4.96 % 4.77 % 4.54 % 4.33 %
Gross Rent Multiplier 16.93 17.60 18.31 19.22 20.18
Cash on Original Cash 25.64 % 25.64 % 25.64 % 25.64 % 25.64 %
Debt Coverage Ratio 3.17 3.17 3.17 3.17 3.17
Modified DCR 3.17 3.17 3.17 3.17 3.17
Default Ratio (Break Even) 40.47 40.47 40.47 40.47 40.47
Prepared By
Suhail Khalil, CCIM, GRI, Morning Star Real Estate Services, Brokerage, Asset Mgmt.
Land Use Planning & Development, P.O. Box 60506, San Diego, CA 92166, (619) 224-1527, over 25 years experience
"working for you to build a better future", MorningStar.RESVC@cox.net
This report has been prepared based on information furnished by sources deemed reliable, however no representation or
warranty, either express or implied, is made to its accuracy.
Annual Values Chart
7888 Othello Avenue
San Diego CA 92111
Commercial / Industrial
This chart shows annual values on a $303,050 investment in the property at 7888 Othello Avenue
over a period of 5 years.
The lower chart axis is years.
Future assumptions have been factored in.
See the spreadsheet for raw data.
Prepared By
Suhail Khalil, CCIM, GRI, Morning Star Real Estate Services, Brokerage, Asset Mgmt.
Land Use Planning & Development, P.O. Box 60506, San Diego, CA 92166, (619) 224-1527, over 25 years experience
"working for you to build a better future", MorningStar.RESVC@cox.net
This report has been prepared based on information furnished by sources deemed reliable, however no representation or
warranty, either express or implied, is made to its accuracy.
Equity Values Chart
7888 Othello Avenue
San Diego CA 92111
Commercial / Industrial
This chart shows the Price, Net Equity, and Loan values for the property at 7888 Othello Avenue over
a period of 5 years.
The lower chart axis is years.
Future assumptions have been factored in.
See the spreadsheet for raw data.
Prepared By
Suhail Khalil, CCIM, GRI, Morning Star Real Estate Services, Brokerage, Asset Mgmt.
Land Use Planning & Development, P.O. Box 60506, San Diego, CA 92166, (619) 224-1527, over 25 years experience
"working for you to build a better future", MorningStar.RESVC@cox.net
This report has been prepared based on information furnished by sources deemed reliable, however no representation or
warranty, either express or implied, is made to its accuracy.

More Related Content

What's hot

Investor Relations Site Graphics Placemat
Investor Relations Site Graphics PlacematInvestor Relations Site Graphics Placemat
Investor Relations Site Graphics Placematnelnetir
 
As of June 30, 2017
As of June 30, 2017As of June 30, 2017
As of June 30, 2017nelnetir
 
2015 Research Valley Partnership Compliance Report
2015 Research Valley Partnership Compliance Report2015 Research Valley Partnership Compliance Report
2015 Research Valley Partnership Compliance ReportCity of College Station
 
Spine pain power point 9 19 final
Spine pain power point 9 19 finalSpine pain power point 9 19 final
Spine pain power point 9 19 finallbakerbwa
 
Best Strategic Value to the Organization - ICMI Global CC Award pdf
Best Strategic Value to the Organization - ICMI Global CC Award pdfBest Strategic Value to the Organization - ICMI Global CC Award pdf
Best Strategic Value to the Organization - ICMI Global CC Award pdfAnna Rogowska, SPHR, CCSL
 
Peninsula dec 15 final
Peninsula dec 15 finalPeninsula dec 15 final
Peninsula dec 15 finalkrgc
 
San Angelo City Council November 6, 2012 Refunding Bond Sale
San Angelo City Council November 6, 2012 Refunding Bond SaleSan Angelo City Council November 6, 2012 Refunding Bond Sale
San Angelo City Council November 6, 2012 Refunding Bond SaleCity of San Angelo Texas
 
Uop acc-290-week-2-wiley plus
Uop acc-290-week-2-wiley plusUop acc-290-week-2-wiley plus
Uop acc-290-week-2-wiley plusavengershulk294
 
Strayer university acc 304 final exam part 2 (2 sets) new
Strayer university acc 304 final exam part 2 (2 sets) newStrayer university acc 304 final exam part 2 (2 sets) new
Strayer university acc 304 final exam part 2 (2 sets) newshyaminfotech
 
2016 Community Development Budget and Action Plan
2016 Community Development Budget and Action Plan2016 Community Development Budget and Action Plan
2016 Community Development Budget and Action PlanCity of College Station
 

What's hot (13)

Investor Relations Site Graphics Placemat
Investor Relations Site Graphics PlacematInvestor Relations Site Graphics Placemat
Investor Relations Site Graphics Placemat
 
As of June 30, 2017
As of June 30, 2017As of June 30, 2017
As of June 30, 2017
 
PPT_Feb_21_2016
PPT_Feb_21_2016PPT_Feb_21_2016
PPT_Feb_21_2016
 
Exhibits - Copy
Exhibits - CopyExhibits - Copy
Exhibits - Copy
 
2015 Research Valley Partnership Compliance Report
2015 Research Valley Partnership Compliance Report2015 Research Valley Partnership Compliance Report
2015 Research Valley Partnership Compliance Report
 
Spine pain power point 9 19 final
Spine pain power point 9 19 finalSpine pain power point 9 19 final
Spine pain power point 9 19 final
 
Best Strategic Value to the Organization - ICMI Global CC Award pdf
Best Strategic Value to the Organization - ICMI Global CC Award pdfBest Strategic Value to the Organization - ICMI Global CC Award pdf
Best Strategic Value to the Organization - ICMI Global CC Award pdf
 
Peninsula dec 15 final
Peninsula dec 15 finalPeninsula dec 15 final
Peninsula dec 15 final
 
Travelodge OM
Travelodge OMTravelodge OM
Travelodge OM
 
San Angelo City Council November 6, 2012 Refunding Bond Sale
San Angelo City Council November 6, 2012 Refunding Bond SaleSan Angelo City Council November 6, 2012 Refunding Bond Sale
San Angelo City Council November 6, 2012 Refunding Bond Sale
 
Uop acc-290-week-2-wiley plus
Uop acc-290-week-2-wiley plusUop acc-290-week-2-wiley plus
Uop acc-290-week-2-wiley plus
 
Strayer university acc 304 final exam part 2 (2 sets) new
Strayer university acc 304 final exam part 2 (2 sets) newStrayer university acc 304 final exam part 2 (2 sets) new
Strayer university acc 304 final exam part 2 (2 sets) new
 
2016 Community Development Budget and Action Plan
2016 Community Development Budget and Action Plan2016 Community Development Budget and Action Plan
2016 Community Development Budget and Action Plan
 

Similar to Pennix&Penix_LEASEvaluation_2016

Proforma 15107 woodlawn-dolton-111017
Proforma 15107 woodlawn-dolton-111017Proforma 15107 woodlawn-dolton-111017
Proforma 15107 woodlawn-dolton-111017Mike Fisher
 
Financial analysis for planners 2018 cdrpc spring conf
Financial analysis for planners  2018 cdrpc spring confFinancial analysis for planners  2018 cdrpc spring conf
Financial analysis for planners 2018 cdrpc spring confChrista Ouderkirk Franzi
 
caterpillar Quarterly Releases • 4Q07 Cat Financial Results
caterpillar Quarterly Releases • 4Q07 Cat Financial Resultscaterpillar Quarterly Releases • 4Q07 Cat Financial Results
caterpillar Quarterly Releases • 4Q07 Cat Financial Resultsfinance5
 
Afternoon Sessions
Afternoon SessionsAfternoon Sessions
Afternoon Sessionsgmm0611
 
Powered by ClearbitApple Inc (NMS AAPL)Company Financ.docx
Powered by ClearbitApple Inc (NMS AAPL)Company Financ.docxPowered by ClearbitApple Inc (NMS AAPL)Company Financ.docx
Powered by ClearbitApple Inc (NMS AAPL)Company Financ.docxLacieKlineeb
 
Bootstrapping Entrepeneurs & Their Business Ppt
Bootstrapping Entrepeneurs & Their Business PptBootstrapping Entrepeneurs & Their Business Ppt
Bootstrapping Entrepeneurs & Their Business PptCaroline Cummings
 
IEDC Real Estate Training Course Financial Feasibility - 2018
IEDC Real Estate Training Course Financial Feasibility - 2018IEDC Real Estate Training Course Financial Feasibility - 2018
IEDC Real Estate Training Course Financial Feasibility - 2018Economic Development Navigator
 
Anexo practica-pares
Anexo practica-paresAnexo practica-pares
Anexo practica-paresVictor Campos
 
KPI Dashboard Presentation.pptx
KPI Dashboard Presentation.pptxKPI Dashboard Presentation.pptx
KPI Dashboard Presentation.pptxPaulo0905
 
caterpillar Quarterly Releases • 2Q08 Cat Financial Results
caterpillar Quarterly Releases • 2Q08 Cat Financial Resultscaterpillar Quarterly Releases • 2Q08 Cat Financial Results
caterpillar Quarterly Releases • 2Q08 Cat Financial Resultsfinance5
 
caterpillar Cat Financial Services Corp. Q2 2008
caterpillar  	Cat Financial Services Corp. Q2 2008caterpillar  	Cat Financial Services Corp. Q2 2008
caterpillar Cat Financial Services Corp. Q2 2008finance5
 
Caterpillar Financial Services Corp. Q2 2008
Caterpillar Financial Services Corp. Q2 2008Caterpillar Financial Services Corp. Q2 2008
Caterpillar Financial Services Corp. Q2 2008earningsreport
 
2 q18 earnings presentation 2018-07-26_final
2 q18 earnings presentation 2018-07-26_final2 q18 earnings presentation 2018-07-26_final
2 q18 earnings presentation 2018-07-26_finalinvestorrelationsdiscover
 
Million Dollar Savings Plan Ten Years[1]
Million Dollar Savings Plan   Ten Years[1]Million Dollar Savings Plan   Ten Years[1]
Million Dollar Savings Plan Ten Years[1]tarblood86
 
OwensMinor_1Q2008_Supplemental_Info_4_22_08
OwensMinor_1Q2008_Supplemental_Info_4_22_08OwensMinor_1Q2008_Supplemental_Info_4_22_08
OwensMinor_1Q2008_Supplemental_Info_4_22_08finance33
 
Payoff Your Mortgage Early
Payoff Your Mortgage EarlyPayoff Your Mortgage Early
Payoff Your Mortgage Earlysuzannekwong
 

Similar to Pennix&Penix_LEASEvaluation_2016 (20)

Proforma 15107 woodlawn-dolton-111017
Proforma 15107 woodlawn-dolton-111017Proforma 15107 woodlawn-dolton-111017
Proforma 15107 woodlawn-dolton-111017
 
Financial analysis for planners 2018 cdrpc spring conf
Financial analysis for planners  2018 cdrpc spring confFinancial analysis for planners  2018 cdrpc spring conf
Financial analysis for planners 2018 cdrpc spring conf
 
caterpillar Quarterly Releases • 4Q07 Cat Financial Results
caterpillar Quarterly Releases • 4Q07 Cat Financial Resultscaterpillar Quarterly Releases • 4Q07 Cat Financial Results
caterpillar Quarterly Releases • 4Q07 Cat Financial Results
 
Afternoon Sessions
Afternoon SessionsAfternoon Sessions
Afternoon Sessions
 
Powered by ClearbitApple Inc (NMS AAPL)Company Financ.docx
Powered by ClearbitApple Inc (NMS AAPL)Company Financ.docxPowered by ClearbitApple Inc (NMS AAPL)Company Financ.docx
Powered by ClearbitApple Inc (NMS AAPL)Company Financ.docx
 
Bootstrapping Entrepeneurs & Their Business Ppt
Bootstrapping Entrepeneurs & Their Business PptBootstrapping Entrepeneurs & Their Business Ppt
Bootstrapping Entrepeneurs & Their Business Ppt
 
IEDC Real Estate Training Course Financial Feasibility - 2018
IEDC Real Estate Training Course Financial Feasibility - 2018IEDC Real Estate Training Course Financial Feasibility - 2018
IEDC Real Estate Training Course Financial Feasibility - 2018
 
KMT Sample 7.16
KMT Sample 7.16KMT Sample 7.16
KMT Sample 7.16
 
Anexo practica-pares
Anexo practica-paresAnexo practica-pares
Anexo practica-pares
 
Elevator pitch
Elevator pitchElevator pitch
Elevator pitch
 
KPI Dashboard Presentation.pptx
KPI Dashboard Presentation.pptxKPI Dashboard Presentation.pptx
KPI Dashboard Presentation.pptx
 
caterpillar Quarterly Releases • 2Q08 Cat Financial Results
caterpillar Quarterly Releases • 2Q08 Cat Financial Resultscaterpillar Quarterly Releases • 2Q08 Cat Financial Results
caterpillar Quarterly Releases • 2Q08 Cat Financial Results
 
caterpillar Cat Financial Services Corp. Q2 2008
caterpillar  	Cat Financial Services Corp. Q2 2008caterpillar  	Cat Financial Services Corp. Q2 2008
caterpillar Cat Financial Services Corp. Q2 2008
 
Caterpillar Financial Services Corp. Q2 2008
Caterpillar Financial Services Corp. Q2 2008Caterpillar Financial Services Corp. Q2 2008
Caterpillar Financial Services Corp. Q2 2008
 
2 q18 earnings presentation 2018-07-26_final
2 q18 earnings presentation 2018-07-26_final2 q18 earnings presentation 2018-07-26_final
2 q18 earnings presentation 2018-07-26_final
 
Million Dollar Savings Plan Ten Years[1]
Million Dollar Savings Plan   Ten Years[1]Million Dollar Savings Plan   Ten Years[1]
Million Dollar Savings Plan Ten Years[1]
 
BCAD Building Project
BCAD Building ProjectBCAD Building Project
BCAD Building Project
 
OwensMinor_1Q2008_Supplemental_Info_4_22_08
OwensMinor_1Q2008_Supplemental_Info_4_22_08OwensMinor_1Q2008_Supplemental_Info_4_22_08
OwensMinor_1Q2008_Supplemental_Info_4_22_08
 
Payoff Your Mortgage Early
Payoff Your Mortgage EarlyPayoff Your Mortgage Early
Payoff Your Mortgage Early
 
proforma sample
proforma sampleproforma sample
proforma sample
 

Pennix&Penix_LEASEvaluation_2016

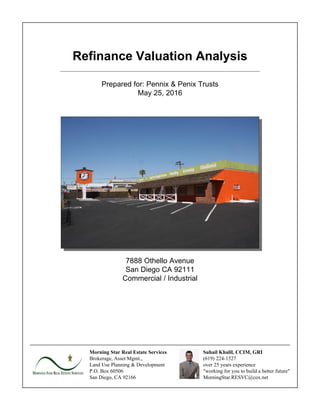
  • 1. Refinance Valuation Analysis Prepared for: Pennix & Penix Trusts May 25, 2016 7888 Othello Avenue San Diego CA 92111 Commercial / Industrial Morning Star Real Estate Services Brokerage, Asset Mgmt., Land Use Planning & Development P.O. Box 60506 San Diego, CA 92166 Suhail Khalil, CCIM, GRI (619) 224-1527 over 25 years experience "working for you to build a better future" MorningStar.RESVC@cox.net
  • 2. Property Summary 7888 Othello Avenue San Diego CA 92111 Commercial / Industrial Operating Statement Gross Scheduled Income $129,982.70 - Vacancy Loss $649.91 = Gross Effective Income $129,332.79 + Other Income $1,200.00 = Gross Operating Income $130,532.79 - Total Operating Expenses $16,985.70 = Net Operating Income (NOI) $113,547.09 Financial Statistics Occupancy Percent 99.5% Vacancy Percent 0.5% Monthly Income Per Unit $10,831.89 Monthly Income Per Sq Ft $1.72 Annual Expenses Per Unit $16,985.70 Annual Expenses per Sq Ft $2.70 Gross Rent Multiplier 16.93 Cap Rate 5.16% Existing Owner's Property Data Current Value $2,200,000.00 Number of Units 1 Number Occupied 1 Number Vacant Price Per Unit $2,200,000.00 Rentable Sq Ft 6,283 Price Per Sq Ft $350.15 Taxes $11,375.04 Insurance $1,500.00 Year Built 1968 Land Area 29,620 Buildings 1 Stories 1 Electric Meters 1 Gas Meters 1 Parking Spaces 16 Roof Flat Slurry Zoning M / IL-3-1 Amenities and Features $650 Loan Scenario = $540,000 Chase loan pay-off + $105,000+ cash out net proceeds after close of escrow Wells Fargo Bank rates without "cash-out" 5/25: 3.45% 7/25: 3.85% 10/25: 4.10% Closing Costs: All programs Loan Fee $0 Misc. Lender Fees $200 Appraisal Fee $3,000 +/- (by bid) Title Market ($1,000 est.) Escrow Market ($500 est.) Recording Fees Normal, usually less than $200 After Close of Escrow we will rebate .50% of the appraisal cost Prepared By Suhail Khalil, CCIM, GRI, Morning Star Real Estate Services, Brokerage, Asset Mgmt. Land Use Planning & Development, P.O. Box 60506, San Diego, CA 92166, (619) 224-1527, over 25 years experience "working for you to build a better future", MorningStar.RESVC@cox.net This report has been prepared based on information furnished by sources deemed reliable, however no representation or warranty, either express or implied, is made to its accuracy.
  • 3. Amortization Schedule 7888 Othello Avenue San Diego CA 92111 Commercial / Industrial 1st MTG - Fxd, Fully Amortized Loan Amount $560,000.00 Loan to Value (LTV) 0.00% Interest Rate 4.100% Term (Due Date) 0.0 Years Points 0.0% Extra Monthly Payment 0.0% Amortization Table with Annual Values Year Payment Principal Interest Total Paid Loan Balance 1 $2,986.89 $1,093.97 $1,892.92 $35,842.68 $546,872.40 2 $2,986.89 $1,139.67 $1,847.22 $71,685.36 $533,196.34 3 $2,986.89 $1,187.29 $1,799.60 $107,528.04 $518,948.90 4 $2,986.89 $1,236.89 $1,750.00 $143,370.72 $504,106.21 5 $2,986.89 $1,288.57 $1,698.32 $179,213.40 $488,643.41 6 $2,986.89 $1,342.40 $1,644.49 $215,056.08 $472,534.58 7 $2,986.89 $1,398.49 $1,588.40 $250,898.76 $455,752.74 8 $2,986.89 $1,456.91 $1,529.98 $286,741.44 $438,269.76 9 $2,986.89 $1,517.78 $1,469.11 $322,584.12 $420,056.36 10 $36,410.39 $35,004.70 $1,405.69 $759,508.81 $0.00 Prepared By Suhail Khalil, CCIM, GRI, Morning Star Real Estate Services, Brokerage, Asset Mgmt. Land Use Planning & Development, P.O. Box 60506, San Diego, CA 92166, (619) 224-1527, over 25 years experience "working for you to build a better future", MorningStar.RESVC@cox.net This report has been prepared based on information furnished by sources deemed reliable, however no representation or warranty, either express or implied, is made to its accuracy.
  • 4. Existing Owner's Annual Property Operating DataYear 1 7888 Othello Avenue San Diego CA 92111 Commercial / Industrial Annual Income Gross Scheduled Income $129,982.70 - Vacancy $649.91 = Effective Rental Income $129,332.79 + Other Income $1,200.00 = Gross Operating Income $130,532.79 Annual Operating Expenses Taxes $11,375.04 + Insurance $1,500.00 + Property Management $2,610.66 + Maintenance & Repair $600.00 + Utilities $0.00 + Services $0.00 + Other Expenses $900.00 = Annual Operating Expenses $16,985.70 Net Operating Income Gross Operating Income $130,532.79 - Annual Operating Expenses $16,985.70 = Net Operating Income $113,547.09 Annual Debt Service 1st Mortgage Debt Service $35,842.68 Annual Cash Flow Before Tax Net Operating Income $113,547.09 - Annual Debt Service $35,842.68 - Capital Additions $0.00 = Cash Flow Before Tax $77,704.41 Original Investment Current Value $2,200,000.00 Purchase Price $580,000.00 Down Payment $290,000.00 + Closing Costs $11,600.00 + Loan Points $1,450.00 + Other Costs $0.00 = Total Investment $303,050.00 Existing Financing 1st Mortgage Loan Balance $560,000.00 Monthly Payment (P&&I) $2,986.90 Interest Rate 4.10% Remaining Amortization Period 25.0 years Equity Before Tax Current Value $2,200,000.00 - 1st Mortgage Loan Balance $560,000.00 + Replacement Reserve Balance $0.00 = Gross Equity Before Tax $1,640,000.00 - 6.00 % Cost of Sale $136,840.00 = Net Equity Before Tax $1,503,160.00 Indicators Cap Rate 5.16% Gross Rent Multiplier 16.93 Cash on Original Cash 25.64% Debt Coverage Ratio 3.17 Modified DCR 3.17 Default Ratio (Break Even) 40.47 Return on Gross Equity 4.74% Prepared By Suhail Khalil, CCIM, GRI, Morning Star Real Estate Services, Brokerage, Asset Mgmt. Land Use Planning & Development, P.O. Box 60506, San Diego, CA 92166, (619) 224-1527, over 25 years experience "working for you to build a better future", MorningStar.RESVC@cox.net This report has been prepared based on information furnished by sources deemed reliable, however no representation or warranty, either express or implied, is made to its accuracy.
  • 5. Property Details 7888 Othello Avenue San Diego CA 92111 Commercial / Industrial Future Value Escalator Year 1 Year 2 Year 3 Year 4 Appreciation 4.00% 4.00% 5.00% 5.00% Vacancy Percent -- C:Calculate or U:Use data until next month Description Month 1 Vacant 0.5% U Other Income -- Future years use year 5 data with a % annual escalator Year 1 Year 2 Year 3 Year 4 Year 5 Tax reimbursement $1,200.00 $1,200.00 $1,200.00 $1,200.00 $1,200.00 Income Escalators Gross Scheduled Income Other Income Expenses: Utilities -- Future years use year 5 data with a % annual escalator Year 1 Year 2 Year 3 Year 4 Year 5 Expenses: Services -- Future years use year 5 data with a % annual escalator Year 1 Year 2 Year 3 Year 4 Year 5 Expenses: Other -- Future years use year 5 data with a % annual escalator Year 1 Year 2 Year 3 Year 4 Year 5 Legal fees $600.00 $600.00 $600.00 $600.00 $600.00 Consulting fees $300.00 $300.00 $300.00 $300.00 $300.00 Expense Escalators Expenses Cost Recovery Period Improvements Years 27.5 Personal Property Years 5.0 Other Assumptions Tax Bracket 28.00% Cost to Sell Property 6.00% NPV Discount Rate 7.00% Investment Comparisons Bank CD Rate 2.00% Mutual Fund 4.00% Prepared By Suhail Khalil, CCIM, GRI, Morning Star Real Estate Services, Brokerage, Asset Mgmt. Land Use Planning & Development, P.O. Box 60506, San Diego, CA 92166, (619) 224-1527, over 25 years experience "working for you to build a better future", MorningStar.RESVC@cox.net This report has been prepared based on information furnished by sources deemed reliable, however no representation or warranty, either express or implied, is made to its accuracy.
  • 6. Rent Roll at Month 1 Showing Monthly Numbers 7888 Othello Avenue San Diego CA 92111 Commercial / Industrial Rent Roll Summary Total Units 1 Vacant Units Occupied Units 1 Possible Rent $129,982.70 - Vacancy Rent $649.91 = Occupied Rent $129,332.79 Occupied 99.5% Vacant 0.5% Row Tenant SqFt Rent/SqFt CAMS Rent Income 0 CRAM-KM 6,283 $1.724 $0.00 $10,831.89 $10,831.89 Prepared By Suhail Khalil, CCIM, GRI, Morning Star Real Estate Services, Brokerage, Asset Mgmt. Land Use Planning & Development, P.O. Box 60506, San Diego, CA 92166, (619) 224-1527, over 25 years experience "working for you to build a better future", MorningStar.RESVC@cox.net This report has been prepared based on information furnished by sources deemed reliable, however no representation or warranty, either express or implied, is made to its accuracy.
  • 7. Portfolio Financing Spreadsheet 7888 Othello Avenue San Diego CA 92111 Commercial / Industrial PRICE Year 1 Year 2 Year 3 Year 4 Year 5 Current Value $2,200,000.00 $2,200,000.00 $2,200,000.00 $2,200,000.00 $2,200,000.00 Escalated Price $2,200,000.00 $2,288,000.00 $2,379,520.00 $2,498,496.00 $2,623,420.80 Price Escalator: Appreciation 4.00 % 4.00 % 5.00 % 5.00 % 5.00 % INITIAL INVEST. AT ACQUISITION Down Payment $290,000.00 $290,000.00 $290,000.00 $290,000.00 $290,000.00 + Closing Costs +$11,600.00 +$11,600.00 +$11,600.00 +$11,600.00 +$11,600.00 + Loan Points +$1,450.00 +$1,450.00 +$1,450.00 +$1,450.00 +$1,450.00 + Other Costs +$0.00 +$0.00 +$0.00 +$0.00 +$0.00 = Total Investment =$303,050.00 =$303,050.00 =$303,050.00 =$303,050.00 =$303,050.00 1st MTG - Fxd, Fully Amortized Remaining Amort. Period 25.0 24.0 23.0 22.0 21.0 Annual Principal $13,127.61 $13,676.06 $14,247.44 $14,842.70 $15,462.81 + Annual Interest +$22,715.07 +$22,166.62 +$21,595.24 +$20,999.98 +$20,379.87 = Annual Debt Service =$35,842.68 =$35,842.68 =$35,842.68 =$35,842.68 =$35,842.68 Loan Balance (BOY) $560,000.00 $546,872.40 $533,196.34 $518,948.90 $504,106.21 = Annual Principal =$13,127.61 =$13,676.06 =$14,247.44 =$14,842.70 =$15,462.81 = Loan Balance (EOY) =$546,872.40 =$533,196.34 =$518,948.90 =$504,106.21 =$488,643.41 1st MTG - Fxd, Fully Amortized LOAN HISTORY Date Loan Obtained Jun 30, 2016 Jun 30, 2016 Jun 30, 2016 Jun 30, 2016 Jun 30, 2016 Loan Amount $560,000.00 $560,000.00 $560,000.00 $560,000.00 $560,000.00 Term (Due Date) 10.0 Yrs 10.0 Yrs 10.0 Yrs 10.0 Yrs 10.0 Yrs Points Paid $3,500.00 $3,500.00 $3,500.00 $3,500.00 $3,500.00 Prepared By Suhail Khalil, CCIM, GRI, Morning Star Real Estate Services, Brokerage, Asset Mgmt. Land Use Planning & Development, P.O. Box 60506, San Diego, CA 92166, (619) 224-1527, over 25 years experience "working for you to build a better future", MorningStar.RESVC@cox.net This report has been prepared based on information furnished by sources deemed reliable, however no representation or warranty, either express or implied, is made to its accuracy.
  • 8. Portfolio Before-Tax Cash Flow Spreadsheet 7888 Othello Avenue San Diego CA 92111 Commercial / Industrial ANNUAL INCOME Year 1 Year 2 Year 3 Year 4 Year 5 Gross Scheduled Income $129,982.70 $129,982.70 $129,982.70 $129,982.70 $129,982.70 - Vacancy -$649.91 -$649.91 -$649.91 -$649.91 -$649.91 = Effective Rental Income =$129,332.79 =$129,332.79 =$129,332.79 =$129,332.79 =$129,332.79 + Other Income +$1,200.00 +$1,200.00 +$1,200.00 +$1,200.00 +$1,200.00 = Gross Operating Income =$130,532.79 =$130,532.79 =$130,532.79 =$130,532.79 =$130,532.79 ANNUAL OPERATING EXPENSES Taxes $11,375.04 $11,375.04 $11,375.04 $11,375.04 $11,375.04 + Insurance +$1,500.00 +$1,500.00 +$1,500.00 +$1,500.00 +$1,500.00 + Property Management +$2,610.66 +$2,610.66 +$2,610.66 +$2,610.66 +$2,610.66 + Maintenance & Repair +$600.00 +$600.00 +$600.00 +$600.00 +$600.00 + Utilities +$0.00 +$0.00 +$0.00 +$0.00 +$0.00 + Services +$0.00 +$0.00 +$0.00 +$0.00 +$0.00 + Other Expenses +$900.00 +$900.00 +$900.00 +$900.00 +$900.00 = Annual Operating Expenses =$16,985.70 =$16,985.70 =$16,985.70 =$16,985.70 =$16,985.70 NET OPERATING INCOME Gross Operating Income $130,532.79 $130,532.79 $130,532.79 $130,532.79 $130,532.79 - Annual Operating Expenses -$16,985.70 -$16,985.70 -$16,985.70 -$16,985.70 -$16,985.70 = Net Operating Income =$113,547.09 =$113,547.09 =$113,547.09 =$113,547.09 =$113,547.09 ANNUAL DEBT SERVICE 1st Mortgage $35,842.68 $35,842.68 $35,842.68 $35,842.68 $35,842.68 + 2nd Mortgage +$0.00 +$0.00 +$0.00 +$0.00 +$0.00 + 3rd Mortgage +$0.00 +$0.00 +$0.00 +$0.00 +$0.00 = Annual Debt Service =$35,842.68 =$35,842.68 =$35,842.68 =$35,842.68 =$35,842.68 ANNUAL CASH FLOW BEFORE TAX Net Operating Income $113,547.09 $113,547.09 $113,547.09 $113,547.09 $113,547.09 - Annual Debt Service -$35,842.68 -$35,842.68 -$35,842.68 -$35,842.68 -$35,842.68 - Capital Additions -$0.00 -$0.00 -$0.00 -$0.00 -$0.00 = Annual Cash Flow Before Tax =$77,704.41 =$77,704.41 =$77,704.41 =$77,704.41 =$77,704.41 Prepared By Suhail Khalil, CCIM, GRI, Morning Star Real Estate Services, Brokerage, Asset Mgmt. Land Use Planning & Development, P.O. Box 60506, San Diego, CA 92166, (619) 224-1527, over 25 years experience "working for you to build a better future", MorningStar.RESVC@cox.net This report has been prepared based on information furnished by sources deemed reliable, however no representation or warranty, either express or implied, is made to its accuracy.
  • 9. Portfolio After-Tax Cash Flow Spreadsheet 7888 Othello Avenue San Diego CA 92111 Commercial / Industrial ANNUAL CASH FLOW BEFORE TAX Year 1 Year 2 Year 3 Year 4 Year 5 Gross Scheduled Income $129,982.70 $129,982.70 $129,982.70 $129,982.70 $129,982.70 - Vacancy -$649.91 -$649.91 -$649.91 -$649.91 -$649.91 = Effective Rental Income =$129,332.79 =$129,332.79 =$129,332.79 =$129,332.79 =$129,332.79 + Other Income +$1,200.00 +$1,200.00 +$1,200.00 +$1,200.00 +$1,200.00 = Gross Operating Income =$130,532.79 =$130,532.79 =$130,532.79 =$130,532.79 =$130,532.79 - Annual Operating Expenses -$16,985.70 -$16,985.70 -$16,985.70 -$16,985.70 -$16,985.70 = Net Operating Income =$113,547.09 =$113,547.09 =$113,547.09 =$113,547.09 =$113,547.09 - Annual Debt Service -$35,842.68 -$35,842.68 -$35,842.68 -$35,842.68 -$35,842.68 - Capital Additions -$0.00 -$0.00 -$0.00 -$0.00 -$0.00 = Annual Cash Flow Before Tax =$77,704.41 =$77,704.41 =$77,704.41 =$77,704.41 =$77,704.41 REAL ESTATE TAXABLE INCOME Net Operating Income $113,547.09 $113,547.09 $113,547.09 $113,547.09 $113,547.09 - Interest 1st Mortgage -$22,715.07 -$22,166.62 -$21,595.24 -$20,999.98 -$20,379.87 - Interest 2nd Mortgage -$0.00 -$0.00 -$0.00 -$0.00 -$0.00 - Interest 3rd Mortgage -$0.00 -$0.00 -$0.00 -$0.00 -$0.00 - Points Amortization -$350.00 -$350.00 -$350.00 -$350.00 -$350.00 - Cost Recovery (Improvements) -$0.00 -$0.00 -$0.00 -$0.00 -$0.00 - Cost Recovery (Personal) -$0.00 -$0.00 -$0.00 -$0.00 -$0.00 - Cost Recovery (Cap. Add.) -$0.00 -$0.00 -$0.00 -$0.00 -$0.00 - Historical CR (Cap. Add.) -$0.00 -$0.00 -$0.00 -$0.00 -$0.00 = R.E. Taxable Income (Loss) =$90,482.02 =$91,030.47 =$91,601.85 =$92,197.11 =$92,817.22 PASSIVE LOSS EXEMPTION Passive Loss Exemption Available $0.00 $0.00 $0.00 $0.00 $0.00 Passive Losses Allowed $0.00 $0.00 $0.00 $0.00 $0.00 ANNUAL SUSPENDED LOSSES R.E. Taxable Income (Loss) $90,482.02 $91,030.47 $91,601.85 $92,197.11 $92,817.22 Passive Losses Allowed $0.00 $0.00 $0.00 $0.00 $0.00 Annual Suspended Losses $0.00 $0.00 $0.00 $0.00 $0.00 TAX LIABILITY (SAVINGS) R.E. Taxable Income (Min 0) $90,482.02 $91,030.47 $91,601.85 $92,197.11 $92,817.22 - Suspended Losses Allowed -$0.00 -$0.00 -$0.00 -$0.00 -$0.00 = Adjusted R.E. Taxable Income =$90,482.02 =$91,030.47 =$91,601.85 =$92,197.11 =$92,817.22 Tax Liability (Savings) @ 28.00% $25,334.97 $25,488.53 $25,648.52 $25,815.19 $25,988.82 ANNUAL CASH FLOW AFTER TAX Annual Cash Flow Before Tax $77,704.41 $77,704.41 $77,704.41 $77,704.41 $77,704.41 - Tax Liability (Savings) @ 28 % -$25,334.97 -$25,488.53 -$25,648.52 -$25,815.19 -$25,988.82 Prepared By Suhail Khalil, CCIM, GRI, Morning Star Real Estate Services, Brokerage, Asset Mgmt. Land Use Planning & Development, P.O. Box 60506, San Diego, CA 92166, (619) 224-1527, over 25 years experience "working for you to build a better future", MorningStar.RESVC@cox.net This report has been prepared based on information furnished by sources deemed reliable, however no representation or warranty, either express or implied, is made to its accuracy.
  • 10. Portfolio After-Tax Cash Flow Spreadsheet 7888 Othello Avenue San Diego CA 92111 Commercial / Industrial Continued Year 1 Year 2 Year 3 Year 4 Year 5 ANNUAL CASH FLOW AFTER TAX = Cash Flow After Tax =$52,369.44 =$52,215.88 =$52,055.89 =$51,889.22 =$51,715.59 Prepared By Suhail Khalil, CCIM, GRI, Morning Star Real Estate Services, Brokerage, Asset Mgmt. Land Use Planning & Development, P.O. Box 60506, San Diego, CA 92166, (619) 224-1527, over 25 years experience "working for you to build a better future", MorningStar.RESVC@cox.net This report has been prepared based on information furnished by sources deemed reliable, however no representation or warranty, either express or implied, is made to its accuracy.
  • 11. Portfolio After-Tax Proceeds from Sale Spreadsheet 7888 Othello Avenue San Diego CA 92111 Commercial / Industrial SALES PROCEEDS BEFORE TAX Year 1 Year 2 Year 3 Year 4 Year 5 Sale Price (EOY) $2,288,000.00 $2,379,520.00 $2,498,496.00 $2,623,420.80 $2,754,591.84 - Cost of Sale @ 6.00% -$137,280.00 -$142,771.20 -$149,909.76 -$157,405.25 -$165,275.51 - 1st Mortgage Loan Balance -$546,872.40 -$533,196.34 -$518,948.90 -$504,106.21 -$488,643.41 - 2nd Mortgage Loan Balance -$0.00 -$0.00 -$0.00 -$0.00 -$0.00 - 3rd Mortgage Loan Balance -$0.00 -$0.00 -$0.00 -$0.00 -$0.00 = Sale Proceeds before Tax =$1,603,847.60 =$1,703,552.46 =$1,829,637.34 =$1,961,909.34 =$2,100,672.92 BASIS AT ACQUISITION Current Value $580,000.00 $580,000.00 $580,000.00 $580,000.00 $580,000.00 + Capitalized Closing Costs +$11,600.00 +$11,600.00 +$11,600.00 +$11,600.00 +$11,600.00 + Basis Adjustments +$0.00 +$0.00 +$0.00 +$0.00 +$0.00 = Basis at Acquisition =$591,600.00 =$591,600.00 =$591,600.00 =$591,600.00 =$591,600.00 HISTORICAL COST RECOVERY (CR) Historical CR (Improvements) $353,929.18 $0.00 $0.00 $0.00 $0.00 + Historical CR (Personal) +$0.00 +$0.00 +$0.00 +$0.00 +$0.00 + Historical CR (Cap. Add.) +$0.00 +$0.00 +$0.00 +$0.00 +$0.00 = Historical Cost Recovery Taken =$353,929.18 =$0.00 =$0.00 =$0.00 =$0.00 COST RECOVERY (CR) Annual CR (Improvements) $0.00 $0.00 $0.00 $0.00 $0.00 + Annual CR (Personal) +$0.00 +$0.00 +$0.00 +$0.00 +$0.00 + Annual CR (Cap. Add.) +$0.00 +$0.00 +$0.00 +$0.00 +$0.00 = Annual Cost Recovery Taken =$0.00 =$0.00 =$0.00 =$0.00 =$0.00 Total Cost Recovery Taken $0.00 $0.00 $0.00 $0.00 $0.00 ADJUSTED BASIS AT SALE Basis at Beginning of Year $591,600.00 $237,670.82 $237,670.82 $237,670.82 $237,670.82 + Historical Capital Additions +$0.00 +$0.00 +$0.00 +$0.00 +$0.00 + Annual Capital Additions +$0.00 +$0.00 +$0.00 +$0.00 +$0.00 - Historical Cost Recovery Taken -$353,929.18 -$0.00 -$0.00 -$0.00 -$0.00 - Annual Cost Recovery Taken -$0.00 -$0.00 -$0.00 -$0.00 -$0.00 = Adjusted Basis at Sale =$237,670.82 =$237,670.82 =$237,670.82 =$237,670.82 =$237,670.82 GAIN (LOSS) ON SALE Sale Price (EOY) $2,288,000.00 $2,379,520.00 $2,498,496.00 $2,623,420.80 $2,754,591.84 - Cost of Sale @ 6.00% -$137,280.00 -$142,771.20 -$149,909.76 -$157,405.25 -$165,275.51 - Adjusted Basis at Sale -$237,670.82 -$237,670.82 -$237,670.82 -$237,670.82 -$237,670.82 = Total Gain (Loss) =$1,913,049.18 =$1,999,077.98 =$2,110,915.42 =$2,228,344.73 =$2,351,645.51 - Total Cost Recovery Taken (LTG) -$0.00 -$0.00 -$0.00 -$0.00 -$0.00 Prepared By Suhail Khalil, CCIM, GRI, Morning Star Real Estate Services, Brokerage, Asset Mgmt. Land Use Planning & Development, P.O. Box 60506, San Diego, CA 92166, (619) 224-1527, over 25 years experience "working for you to build a better future", MorningStar.RESVC@cox.net This report has been prepared based on information furnished by sources deemed reliable, however no representation or warranty, either express or implied, is made to its accuracy.
  • 12. Portfolio After-Tax Proceeds from Sale Spreadsheet 7888 Othello Avenue San Diego CA 92111 Commercial / Industrial Continued Year 1 Year 2 Year 3 Year 4 Year 5 GAIN (LOSS) ON SALE = Capital Gain from Apprec. (Min 0) =$1,913,049.18 =$1,999,077.98 =$2,110,915.42 =$2,228,344.73 =$2,351,645.51 TAXED AS ORDINARY INCOME Unamortized Loan Points ($1,100.00) ($750.00) ($400.00) ($50.00) $300.00 + Suspended Losses (from ATCF) +$0.00 +$0.00 +$0.00 +$0.00 +$0.00 + Loss at Disposition +$0.00 +$0.00 +$0.00 +$0.00 +$0.00 = Taxed as Ordinary Income =($1,100.00) =($750.00) =($400.00) =($50.00) =$300.00 SALES PROCEEDS AFTER TAX Sale Proceeds before Tax $1,603,847.60 $1,703,552.46 $1,829,637.34 $1,961,909.34 $2,100,672.92 - Tax (Savings) Ord. Inc. @ 28.00% -($308.00) -($210.00) -($112.00) -($14.00) -$84.00 - Cost Recovery Recapture @ 25.00% -$0.00 -$0.00 -$0.00 -$0.00 -$0.00 - Federal Tax on Gain @ 15.00% -$286,957.38 -$299,861.70 -$316,637.31 -$334,251.71 -$352,746.83 - State Tax on Gain @ 12.00% -$229,565.90 -$239,889.36 -$253,309.85 -$267,401.37 -$282,197.46 = Sale Proceeds after Tax =$1,087,632.32 =$1,164,011.41 =$1,259,802.18 =$1,360,270.26 =$1,465,644.63 Prepared By Suhail Khalil, CCIM, GRI, Morning Star Real Estate Services, Brokerage, Asset Mgmt. Land Use Planning & Development, P.O. Box 60506, San Diego, CA 92166, (619) 224-1527, over 25 years experience "working for you to build a better future", MorningStar.RESVC@cox.net This report has been prepared based on information furnished by sources deemed reliable, however no representation or warranty, either express or implied, is made to its accuracy.
  • 13. Portfolio Equity Spreadsheet 7888 Othello Avenue San Diego CA 92111 Commercial / Industrial SALES PROCEEDS BEFORE TAX Year 1 Year 2 Year 3 Year 4 Year 5 Sale Price (EOY) $2,288,000.00 $2,379,520.00 $2,498,496.00 $2,623,420.80 $2,754,591.84 - Cost of Sale @ 6.00% -$137,280.00 -$142,771.20 -$149,909.76 -$157,405.25 -$165,275.51 - 1st Mortgage Loan Balance -$546,872.40 -$533,196.34 -$518,948.90 -$504,106.21 -$488,643.41 - 2nd Mortgage Loan Balance -$0.00 -$0.00 -$0.00 -$0.00 -$0.00 - 3rd Mortgage Loan Balance -$0.00 -$0.00 -$0.00 -$0.00 -$0.00 = Sale Proceeds before Tax =$1,603,847.60 =$1,703,552.46 =$1,829,637.34 =$1,961,909.34 =$2,100,672.92 GROSS EQUITY AT PURCHASE Down Payment $290,000.00 $290,000.00 $290,000.00 $290,000.00 $290,000.00 = Gross Equity at Purchase =$290,000.00 =$290,000.00 =$290,000.00 =$290,000.00 =$290,000.00 GROSS EQUITY (EOY) Gross Equity (BOY) $1,640,000.00 $1,741,127.61 $1,846,030.34 $1,976,965.78 $2,116,237.54 + Appreciation Equity +$88,000.00 +$91,226.67 +$116,688.00 +$124,429.07 +$130,650.52 + Principal Paydown Equity +$13,127.61 +$13,676.06 +$14,247.44 +$14,842.70 +$15,462.81 = Gross Equity (EOY) =$1,741,127.61 =$1,846,030.34 =$1,976,965.78 =$2,116,237.54 =$2,262,350.87 GROSS EQUITY PLUS RESERVES Gross Equity (EOY) $1,741,127.61 $1,846,030.34 $1,976,965.78 $2,116,237.54 $2,262,350.87 + Reserve Balance +$0.00 +$0.00 +$0.00 +$0.00 +$0.00 = Total Gross Equity =$1,741,127.61 =$1,846,030.34 =$1,976,965.78 =$2,116,237.54 =$2,262,350.87 RETURN ON GROSS EQUITY (EOY) Annual Cash Flow Before Tax $77,704.41 $77,704.41 $77,704.41 $77,704.41 $77,704.41 div Gross Equity (EOY) $1,741,127.61 $1,846,030.34 $1,976,965.78 $2,116,237.54 $2,262,350.87 = Return on Gross Equity =4.46 % =4.21 % =3.93 % =3.67 % =3.43 % NET EQUITY (EOY) Gross Equity (EOY) $1,741,127.61 $1,846,030.34 $1,976,965.78 $2,116,237.54 $2,262,350.87 - Cost of Sale @ 6.00% -$137,280.00 -$142,771.20 -$149,909.76 -$157,405.25 -$165,275.51 = Net Equity (EOY) =$1,603,847.61 =$1,703,259.14 =$1,827,056.02 =$1,958,832.30 =$2,097,075.36 INDICATORS Cap Rate 5.16 % 4.96 % 4.77 % 4.54 % 4.33 % Gross Rent Multiplier 16.93 17.60 18.31 19.22 20.18 Cash on Original Cash 25.64 % 25.64 % 25.64 % 25.64 % 25.64 % Debt Coverage Ratio 3.17 3.17 3.17 3.17 3.17 Modified DCR 3.17 3.17 3.17 3.17 3.17 Default Ratio (Break Even) 40.47 40.47 40.47 40.47 40.47 Prepared By Suhail Khalil, CCIM, GRI, Morning Star Real Estate Services, Brokerage, Asset Mgmt. Land Use Planning & Development, P.O. Box 60506, San Diego, CA 92166, (619) 224-1527, over 25 years experience "working for you to build a better future", MorningStar.RESVC@cox.net This report has been prepared based on information furnished by sources deemed reliable, however no representation or warranty, either express or implied, is made to its accuracy.
  • 14. Annual Values Chart 7888 Othello Avenue San Diego CA 92111 Commercial / Industrial This chart shows annual values on a $303,050 investment in the property at 7888 Othello Avenue over a period of 5 years. The lower chart axis is years. Future assumptions have been factored in. See the spreadsheet for raw data. Prepared By Suhail Khalil, CCIM, GRI, Morning Star Real Estate Services, Brokerage, Asset Mgmt. Land Use Planning & Development, P.O. Box 60506, San Diego, CA 92166, (619) 224-1527, over 25 years experience "working for you to build a better future", MorningStar.RESVC@cox.net This report has been prepared based on information furnished by sources deemed reliable, however no representation or warranty, either express or implied, is made to its accuracy.
  • 15. Equity Values Chart 7888 Othello Avenue San Diego CA 92111 Commercial / Industrial This chart shows the Price, Net Equity, and Loan values for the property at 7888 Othello Avenue over a period of 5 years. The lower chart axis is years. Future assumptions have been factored in. See the spreadsheet for raw data. Prepared By Suhail Khalil, CCIM, GRI, Morning Star Real Estate Services, Brokerage, Asset Mgmt. Land Use Planning & Development, P.O. Box 60506, San Diego, CA 92166, (619) 224-1527, over 25 years experience "working for you to build a better future", MorningStar.RESVC@cox.net This report has been prepared based on information furnished by sources deemed reliable, however no representation or warranty, either express or implied, is made to its accuracy.