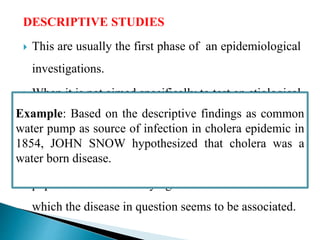
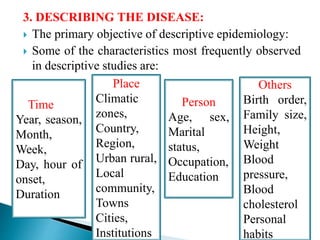
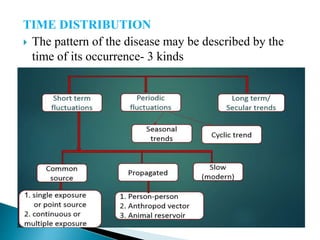
3. Epidemiology is derived from Greek words:
Epi - “upon”
Demos - “people”
Logos - “study”
Epidemiology covers not only the study of disease
distribution and causation but also of health and health
related events occurring in human population.
By identifying risk factors of chronic diseases, evaluating
treatment modalities and health services
6. Sir John Lincour : Reported first dental field studies
in which details of the health habits and dental state
of 96 old ex-service pensioners were collected
Edwin Saunders : Carried a first systematic dental
epidemiology in Britain, studying eruption of teeth
between ages of 9 and 13 and addressed his findings
in a report titled “ the teeth a test of age”
William Fischer (end of 19th century) : Published his
paper “ compulsory attention to the teeth of school
children” and his subsequent reports were an important
step towards the initiation and development of School
Dental Service.
7. Disease frequency:
Frequency of disease, disability or death summarized
as rates or ratios.
Essential for comparing disease frequency in
different populations or subgroups of the same
population in relation to the suspected causal factors.
It concerns with health related states or events in the
community
e.g. health needs, demands, activities, health care
utilization.
8. Distribution of disease:
Refers to time sequences, places of occurrence and
persons affected. (Time, Place and Person).
Determinants of disease :
They are physical, biological and behavioral factors
that can influence health.
To test the aetiological hypothesis and identify the
underlying causes of disease.
This aspect of epidemiology is known as Analytical
Epidemiology.
9. According to the International Epidemiological
Association : by Lowe and Kostrzewski in 1973 as
follows:
To describe the size and distribution of disease
problems in human populations.
To provide the data essential for the planning,
implementation and evaluation of health services for
the prevention, control and treatment of diseases and
for the setting up of priorities among those services
To identify etiological factors in the pathogenesis of
disease
11. Observational studies Experimental studies
Descriptive studies RCT
Analytical studies Feild trials
Community trials
Ecological
Cross sectional
Case control
Cohort
12. DESCRIPTIVE EPIDEMIOLOGY
Descriptive epidemiology is defined as
epidemiological studies and activities with descriptive
components that are much stronger than their analytic
components or that fall within the descriptive area of
the descriptive-analytic spectrum.
Naito M. J
Epidemiol 2014; 24(6): 435-436
13. DESCRIPTIVE STUDIES
This are usually the first phase of an epidemiological
investigations.
When it is not aimed specifically to test an etiological
hypothesis, it is called as “descriptive study”.
They concerned with observing the distribution of
disease or health related characteristics in human
population and identifying the characteristics with
which the disease in question seems to be associated.
Example: Based on the descriptive findings as common
water pump as source of infection in cholera epidemic in
1854, JOHN SNOW hypothesized that cholera was a
water born disease.
14. QUESTIONS ASKED?
WHEN IS THE DISEASE OCCURING? - Time
distribution
WHERE IS IT OCCURING?- Place distribution
WHO IS GETTING THE DISEASE- Person
distribution
15. TYPES OF DESCRIPTIVE STUDIES
Case series
Community diagnosis or needs assessment
Epidemiological description of disease occurrence
Descriptive cross – sectional studies or community
(population) surveys
Ecological descriptive studies
(World Health Organization. Health Research Methodology :A
guide for training in Research Methods. 2nd ed. Geneva:World
Health Organization; 2006.)
16. 1. CASE SERIES
Based on the reports of a series of cases of a specific
condition, or a series of treated cases, with no
specifically allocated control groups.
These represent the numerator of the disease
occurrence, and should not be used to estimate risks.
Consists simply of percentages of the total number of
cases that belong to specific category of age, sex,
ethnic group or other characteristic.
17. 2. COMMUNITY DIAGNOSIS OR NEEDS
ASSESSMENT
Collection of data on existing health problems,
programs, achievements, constraints, leading
patterns, groups at high risk.
Purpose is to identify existing needs and to provide
baseline data for the design of further studies or
action.
18. 3. EPIDEMIOLOGICAL DESCRIPTION OF
DISEASE OCCURRENCE:
Collection of data on the occurrence and distribution
of the disease in population according to the specific
characteristics of individuals.
Example: Age, Sex, Education, Smoking habits,
Religion, Marital status
A description may also be given of familial
characteristics such as birth order, maternal age, birth
interval or family type.
19. 4. DESCRIPTIVE CROSS- SECTIONAL STUDIES OR
COMMUNITY (POPULATION) SURVEYS:
Which may comprise the whole population or a
proportion (sample) of it.
It examines the relationship between diseases and
other variables of interest as they exist in a defined
population at one particular time
Provide a prevalence rate at a particular point in time:
Point Prevalence
Over period of time : Period prevalence
In this, the distribution of disease, disability,
pathological condition is assessed.
20. 5. ECOLOGICAL DESCRIPTIVE STUDIES
When the unit of observation is an aggregate (e.g.
family, school) or an ecological unit ( a village, town
or country)
Moreover, descriptive of the data is also an integral
part of the analytical study.
21. PROCEDURES
1. Defining the population to be studied
2. Defining the disease under study
3. Describing the disease by
(a) Time
(b) Place
(c) Person
4. Measurement of the disease
5. Comparing with known indices
6. Formulation of an aetiological hypothesis
22. 1. DEFINING THE POPULATION:
The first step is to define the population base not only
in terms of the total number, but also its composition
in terms of age, sex, occupation, cultural characters.
The “defined population” be whole population in a
geographic area, or more often a representative
sample taken from it
It also be a specially selected group such as
where a group of people can be fairly accurately
counted.
23. PROPERTIES :
It needs to be large enough so that age, sex and other
specific rates are meaningful.
Be stable, without migration in to and out of the area.
Be clear who does and who does not belong to
population. Eg: visitors and relations.
Not be overtly different from other communities in
the region.
24. A health facility should be relatively close enough to
provide relatively easy access for patients requiring
medical services.
Most essential ingredient:Community participation
The concept of defined population is crucial in
epidemiological studies as it provides denominator for
calculating rates which are essential to measure the
disease frequency and study it’s distribution and
determinants
25. 2. DEFINING THE DISEASE UNDER STUDY :
The needs of the clinician and epidemiologist to
define the disease may be diverge
Clinician- Does not need a precise definition of a
disease
Epidemiologist- Needs an operational definition
which is both precise and stable
The operational definition is a defined by which the
disease or condition can be identified and measured
in the defined population with a degree of accuracy.
example: tonsillitis
26. If the definition is not valid, it would be a powerful
source of error in the presentation and comparability
of measurements from different sources.
The epidemiologist at times need to frame his own
definition keeping the objectives of the study in view
and aiming at the degree of accuracy and it should be
adhered throughout the study.
Eg: Neurological diseases
The diagnostic methods used in these studies must be
acceptable to the population to be studied and
applicable to their use in large population
27. 3. DESCRIBING THE DISEASE:
The primary objective of descriptive epidemiology:
Some of the characteristics most frequently observed
in descriptive studies are:
Time
Year, season,
Month,
Week,
Day, hour of
onset,
Duration
Place
Climatic
zones,
Country,
Region,
Urban rural,
Local
community,
Towns
Cities,
Institutions
Person
Age, sex,
Marital
status,
Occupation,
Education
Others
Birth order,
Family size,
Height,
Weight
Blood
pressure,
Blood
cholesterol
Personal
habits
28. TIME DISTRIBUTION
The pattern of the disease may be described by the
time of its occurrence- 3 kinds
29. The pattern of disease may be described by the time of
its occurrence
Hours
Days
Weeks
Months
It raises questions whether the disease is seasonal in
occurrence; whether it shows periodic increase or
decrease; or whether it follows a consistent time
trend.
30. SHORT TERM FLUCTUATIONS
The best known short-term fluctuation is the
occurrence of a disease is an epidemic.
According to modern concepts, an epidemic is defined
as “the occurrence in a community or region of cases
of an illness or other-related events clearly in excess of
normal expectancy.
The community or region and the time period in which
cases occur are specified prescisely.
A graph of the time distribution of epidemic cases is
called “epidemic curve”
31. The epidemic curve may suggest:
A time relationship with exposure to a suspected
source
A cyclic or seasonal pattern suggestive of a particular
infection
Common source or propagated spread of the disease
32. Common source-single exposure or Point source
Also known as “Point - source”epidemics.
Exposure to the disease agent is brief and
simultaneous.
Resultant cases develop within one incubation period
of the disease.
Example: Epidemic of Food poisoning.
Single exposure epidemic: The curve has usually one
peak.
33. Main features of a point source epidemic :
Epidemic curve rises and falls rapidly, with no
secondary waves.
Epidemic tends to be explosive with clustering of cases
within a narrow interval of time.
All the cases develop within one incubation period of
disease.
The common source epidemics are frequently, but not
always due to an exposure of an infectious agent.
They can result from contamination of the environment
(air, water, soil and water) by industrial chemicals or
pollutants.
Example: Bhopal gas tragedy in India.
2. Minimata disease in Japan resulting from
consumption of fish containing high concentration of
methyl mercury
34. COMMON SOURCE- CONTINUOUS OR
REPEATED EXPOSURE
Exposure from the same source may be prolonged-
Continuous
Repeated
Intermittent (not necessarily at the same place or time).
Variation from the above model is that an epidemic
may be initiated from a common source and continue
as propagated epidemic
Eg: water-borne cholera
The epidemic reaches a sharp peak, but tails off
gradually over a period of time.
Eg: A well of contaminated water and an outbreak of
respiratory illness, the Legionnaire’s disease in
summer of1976 in Philadelphia.
35. PROPAGATED EPIDEMICS
Mostly of infectious origin and results from person to
person transmission of an infectious agent. Example:
Epidemics of a polio.
The epidemic usually shows a gradual rise and tails
off over a much longer period of time.
Transmission continues until the number of
susceptible is depleted or susceptible individuals are
no longer exposed to infected persons or intermediary
vectors.
36. This more likely to occur where large number of
susceptible are aggregated or when there is a regular
supply of new susceptible individuals lowering herd
immunity.
Types:
a) Person-to-person: Poliomyelitis, Chickenpox,
Rubella,Influenza, Tb etc
b) Anthropod vector: Dengue, Malaria, Lymphatic
Filariasis
c) Animal reservoir: Rabies, yellow fever,plague,
Chikungunya, Japanese encephalitis.
37. The great epidemics of the past resulted from infection:
influenza, yellow fever and the plague.
Today, these have largely been replaced by new
epidemics of chronic disease—such as cardiovascular
disease and type II diabetes—
The etiologies of which are as much social and
economic as they are biological.
EMBO Rep. 2006 Dec; 7(12): 1201.
Obesity is now a global epidemic -“globesity”. Side effects
such as diabetes, high blood pressure, cardiovascular disease,
joint and back problems, and a higher risk of some cancers
all place sufferers under huge strain and can shorten their life
expectancy.
38. PERIODIC FLUCTUATIONS:
TYPES
1. SEASONAL TRENDS
2. CYCLIC TRENDS
SEASONAL TRENDS:
Seasonal variations is a well known characteristic of
many communicable diseases
Example: Measles and varicella at its height in
early spring
Upper respiratory infections rise in
winter months
Bacterial gastrointestinal infections in
summer months
39. The seasonal variations of disease occurence may be
related to environmental conditions like temperatue,
humidity, rainfall, overcrowding, life cycle of
vectors.
The basis for seasonal variation is unknown in certain
diseases.
Example: polio
Non-infectious disease and conditions may
sometimes exhibit seasonal variation
Example: sunstroke, hay fever
40. CYCLIC TRENDS:
Some diseases occur in cycles spread over short
period of time which may be days, weeks, months or
years.
Example: measles in the pre-vaccination era
appeared in cycles with major peaks every 2-3 years
and rubella every 6-9 years.
Influenza pandemics are known to occur at intervals
of 7-10 years, due to antigenic variations.
Non-infectious conditions may also show periodic
fluctuations,
Example : Automobile accidents in USA are more
frequent during week-ends.
41. LONG-TERM OR SECULAR TRENDS:
The term “secular trends” implies change in the
occurrence of disease (i.e. progressive increase or
decrease) over a long period of time, generally several
years or decades.
It implies a consistent change in a particular direction
or a definite movement in one direction.
By surveillance or monitoring of time trends, the
epidemiologist which diseases are or , which are
emerging health problems
Provide guidelines to the health administrator matters
prevention and control of disease .
Example: coronary heart disease, lung cancer, oral
cancer and diabetes which have shown a consistent
upward trend in the developed countries during the past
50 years and by decline of diseases such as tuberculosis,
typhoid fever, diphtheria, and polio.
42. PLACE DISTRIBUTION
Variations may be classified into:
International variation
National variation
Rural-urban variation
Local distribution
43. International variation:
•The pattern of disease occurrence varies from country
to country
Example: oral cancer has the highest incidence in
countries like India, Bangladesh, Srilanka and
relatively rare in western world
•The World Health Organization ha played a major role
in the improvement and dissemination of international
statistics related to health
National variation :
Variations occurring within same country
Death statistics and notifications of infectious
diseases are the major source for comparisions
within countries
Example: In India conditions like endemic goitre,
malaria and flourosis
44. Rural-urban variation:
Example: Chronic bronchitis, accidents, lung cancer,
cardiovascular diseases, mental illness and drug
dependence urban than in rural areas.
Skin and zoonotic diseases and soil-transmitted
helminthes rural areas than in urban areas.
Death rates especially infant and maternal mortality
rates are higher for rural than urban areas.
These variations may be due to difference in :
• Population density,
• Social class,
• Deficiencies in medical care,
• Levels of sanitation,
• Education and environmental factors.
45. Local distribution:
The variations are best studied with the aid of ‘spot
maps’ or ‘shaded maps’.
These maps show at a glance areas of high and low
frequency, the boundaries and patterns of disease
distribution.
Example: If the map shows “clustering” of cases, it
may suggest a common source of infection or
common risk factor shared by all the cases.
Example: Based on the descriptive findings as
common water pump as source of infection in cholera
epidemic in 1854, JOHN SNOW hypothesized that
cholera was a water born disease.
46. Migration studies:
It can be carried out in two ways:
Comparison of disease and death rates for migrants
with those of their kin who have stayed at home -
permits study of genetically similar groups but living
under different environmental conditions or
exposures. Example: Twins
Comparison of migrants with local population of the
host country provides information on genetically
different groups living in a similar environment
Example: Men of Japanese ancestry living in USA
experience a higher rate of coronary heart disease
than do the Japanese in Japan.
47. PERSON DISTRIBUTION
In descriptive studies the disease is characterized by
defining the persons who develop the disease by age,
sex, occupation, marital status, habits, social class
and other host factors.
These factors do not necessarily represent etiological
factors but they contribute a good deal to our
understanding of the natural history of disease
48. AGE:
Certain diseases are more common in certain age
groups than others.
It is important to know as :
1. it may assist in understanding the factors responsible
for the development of disease
2. It may produce indirect effects that must be taken
account of
3. Helpful in assigning services to needy parts of
population or community
Example: Measles in childhood, cancer in middle age,
atherosclerosis in old age.
If the attack rate is equal in all age groups, it indicates
that all age groups are equally susceptible and there
was no previous immunity.
49. BIMODALITY:
It is the occurrence of two separate peaks in the age
incidence of the disease instead of one. This
phenomenon is known as bimodality.
Classical Example: Dental caries: Pit and fissure
caries in children
50. GENDER :
Certain chronic diseases such as diabetes,
hyperthyroidism and obesity are more common in
women than in men.
Diseases such as lung cancer and coronary heart
disease are less frequent in women.
This variation in disease frequency has been ascribed to
a) Basic biological differences between sexes
including sex-linked genetic inheritance
b) Cultural and behavioral differences between sexes
(e.g. smoking, alcoholism, automobile use) due to
different roles in social setting.
51. ETHNICITY
Differences in occurrence of diseases such as
tuberculosis, essential hypertension, coronary heart
diseases, cancer and sickle cell anemia have been
noted between population subgroups of different
racial and ethnic origin.
MARITAL STATUS
Mortality rates were always lower for married males
and females than for the unmarried, of the same age,
and sex.
Marital status risk factor some diseases and
conditions.
Example: Cancer cervix is rare in nuns and more in
married females.
52. OCCUPATION :
can be used
1. As a measure of socio-economic status
2. For identification of risks associated with exposure
to agents peculiar to certain occupations
3. To identify groups whose general patterns of life
vary because of the different demands made by their
occupation
Example: Chimney sweepers cancer, Wool sorters
disease, Farmers lung etc.
53. SOCIAL CLASS
Health and disease are not equally distributed in all
social classes.
Individuals in upper social class have a longer life
expectancy and better health and nutritional status
than those in lower social classes.
Certain diseases example: coronary heart disease,
hypertension, diabetes etc. have shown a higher
prevalence in upper class than in lower classes.
Differences have also been observed in mental illness
and utilization of medical and health care services.
54. BEHAVIOR
Some of the behavioral risk factors are smoking,
sedentary life, over-eating and drug abuse, mass
movement of people such as occurs in pilgrimages,
which lends themselves to transmission of infectious
diseases such as cholera and diarrheal diseases,
insect-borne.
55. STRESS
Stress has been shown to affect a variety of variables
related to patients response.
Example: Susceptibility to diseases, exacerbation of
symptoms, compliance with medical regimen etc.
56. MIGRATION:
In India, diseases like leprosy, filarial and malaria are
considered to be rural problems.
Because of the movement of the people from rural to
urban areas these diseases have created a serious
problem in urban areas also.
Human movement may be classified as -
i) Short-term, long-term and permanent
ii) According to age, sex, education,
occupation
iii) Internal or external
iv) Urban versus rural etc.
57. MEASUREMENT OF DISEASE
The measurement of a disease is done in terms of
mortality and morbidity indicators
Measurement of mortality is straight forward.
Morbidity has two aspects- incidence and
prevalence.
Incidence can be obtained from “longitudinal”
studies, and “prevalence” from “cross-sectional”
studies.
58. Also known as ‘prevalence study’.
Simplest form of observational study.
Based on single examination of cross-section of
population at one point in time- results of which can
be projected to whole population provided the
sampling has been done correctly.
More useful for chronic than short-lived diseases.
59. Example: in a study of hypertension, we can also collect
data during survey about age, sex, physical exercise,body
weight, salt intake etc.
Then we can determine how prevention of hypertension is
related to certain variables simultaneously measured.
Such study tells about distribution of disease in
population rather that its aetiology.
It gives little information about natural history of
disease or rate of occurrence of new cases.
60. It is useful:
i. To study the natural history of disease & its future
outcome
ii. For identifying risk factors of disease
iii. For finding out incidence rate or rate of occurrence of
disease in community.
Difficult to organize & more time-consuming.
Ex., Ten‐year longitudinal study of gingival
recession in dentists
61. COMPARING WITH KNOWN INDICES:
Essence of epidemiology is to ask questions and to
make comparisons.
By making comparisons between different
populations, and subgroups of same population, it is
possible to reach a conclusion with regard to disease
etiology.
We can also identify or define groups who are at
increased risk for the development of certain diseases.
62. FORMULATION OF HYPOTHESIS:
A hypotheses is a supposition, arrived at from
observation or reflection.
It can be accepted or rejected, using the techniques
of analytical epidemiology.
An epidemiological hypothesis should specify:
1. The population – the characteristics of the persons
to whom the hypothesis applies.
2. The specific cause being considered.
3. The expected outcome – the disease.
4. The dose-response relationship – the amount of
cause needed to lead to a stated incidence of effect.
5. The time-response relationship – the time period
that will elapse between exposure to the cause and
observation of the effect
63. Ex., “Cigarette smoking causes lung cancer” –
incomplete hypothesis
An Improved formulation:-
“The smoking of 30-40 cigarettes per day causes lung
cancer in 10 per cent of smokers after 20 years of
exposure”.
64. Uses of Descriptive Epidemiology:
Provides data with regard to the types of disease
problems and their magnitude in the community
Provides information on the etiology of a disease and
helps in the formulation of an etiological hypothesis
Provides data required for the planning, organizing
and evaluating preventive and curative services
Permit evaluation of trends in health and disease
Identify problems to be studied by analytic methods
and suggest areas that may be fruitful for
investigation
65. CONCLUSION :
Descriptive epidemiology helps in classify the
diseases according to time, place and person
Aid in generating hypothesis that can be explored by
analytical epidemiology.
Demonstrates health outcomes that should be
prioritized for the design of the interventions.
66. REFERENCES
Park K. Text book of Preventive and Social
Medicine. 23rd ed. Jabalpur : BanarsidasBhanot;
2013.p. 63-70
Detels R, Beaghole R, Lansang MA, Hulliford M.
Oxford text book of Public Health. 5th ed. Newyork :
Oxford University press Inc; 2009 .p.498 – 508.
World Health Organization.Health Research
Methodology : A guide for training in Research
Methods. 2nd ed. Geneva:World Health Organization;
2006.
Beaglehole R, Bonita R, Kjellstrom T. WHO Basic
Epidemiology. Delhi: AITBS publishers; 2006. p.29 -39.
67. Peter S. Text book of Essentials of Public Health
Dentistry. 5thed. New delhi : Arya Medi Publishing;
2013.p.41 –64 – 98.
Abrahamson J H, Abrahamson Z H. Survey methods
in community medicine.5thed.Churchill Livingstone;
1999.
Descriptive Epidemiology: Patterns of Disease-
Person, Place, Time. 2nded; 2007. p. 65-88.
Naito M. utilization and application of public health
data in descriptive epidemiology. J E pidemiol
2014;24(6):435-436