SlideShare a Scribd company logo
1 of 4
Pairwise Comparison of Daily Ozone Concentration in Tampa-St.Petersburg Region
A statistical examination of ozone variation between days.
Author: Kalaivanan Murthy
A B S T R A C T
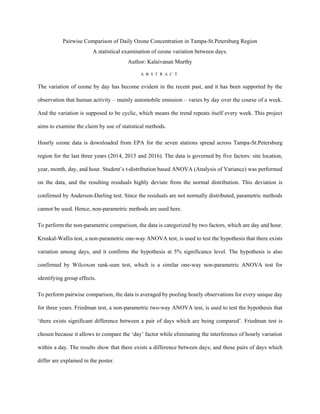
The variation of ozone by day has become evident in the recent past, and it has been supported by the
observation that human activity – mainly automobile emission – varies by day over the course of a week.
And the variation is supposed to be cyclic, which means the trend repeats itself every week. This project
aims to examine the claim by use of statistical methods.
Hourly ozone data is downloaded from EPA for the seven stations spread across Tampa-St.Petersburg
region for the last three years (2014, 2015 and 2016). The data is governed by five factors: site location,
year, month, day, and hour. Student’s t-distribution based ANOVA (Analysis of Variance) was performed
on the data, and the resulting residuals highly deviate from the normal distribution. This deviation is
confirmed by Anderson-Darling test. Since the residuals are not normally distributed, parametric methods
cannot be used. Hence, non-parametric methods are used here.
To perform the non-parametric comparison, the data is categorized by two factors, which are day and hour.
Kruskal-Wallis test, a non-parametric one-way ANOVA test, is used to test the hypothesis that there exists
variation among days, and it confirms the hypothesis at 5% significance level. The hypothesis is also
confirmed by Wilcoxon rank-sum test, which is a similar one-way non-parametric ANOVA test for
identifying group effects.
To perform pairwise comparison, the data is averaged by pooling hourly observations for every unique day
for three years. Friedman test, a non-parametric two-way ANOVA test, is used to test the hypothesis that
‘there exists significant difference between a pair of days which are being compared’. Friedman test is
chosen because it allows to compare the ‘day’ factor while eliminating the interference of hourly variation
within a day. The results show that there exists a difference between days; and those pairs of days which
differ are explained in the poster.
Pairwise Comparison of Daily Ozone Concentration in Tampa-St.Petersburg Region
Programmed by Kalaivanan Murthy
Programming Language: R
SOURCE CODE
#READ DATA AND BUILD DATAFRAME
data.raw=read.csv("C:/Users/Kalaivanan Murthy/Documents/DATA/tampa/to_database.txt",header=T,
stringsAsFactors=F)
s=stringr::str_split_fixed(data.raw$datetime,"[T-]",3)
date.s=strptime(s[,1],"%Y%m%d")
data.xc=data.frame(siteid=factor(data.raw$site),date.s,
day=factor(weekdays(date.s)),
month=factor(format(date.s,"%B")),
year=factor(format(date.s,"%Y")),
hour=factor(s[,2]),value=data.raw$value)
attach(data.xc)
str(data.xc)
#FACTOR DATA: SORT FACTOR LEVELS
siteid=factor(siteid,levels=c("840120571065","840120571035","840120570081","840120573002",
"840121030004","840121030018","840121035002"),
labels=c("T-USMC","T-Davis","T-EGSPrk","T-Sydney",
"SP-SPJrCol","SP-AzaPrk","SP-JCPrk"))
levels(month)=c("January","February","March","April",
"May","June","July","August",
"September","October","November","December")
levels(day)=c("Monday","Tuesday","Wednesday","Thursday",
"Friday","Saturday","Sunday")
#SUMMARY STATISTICS
summary(value)
unique(value)[which.max(tabulate(match(v, unique(value))))] #mode
range(value)
sd(value)
boxplot(value,main="Box-and-whisker",xlab="ozone (ppm)",
horizontal=T, varwidth=1, cex.axis=2.5, cex.lab=2.5)
#ANOVA: INDEPENDENT FACTORS
anova.xc=aov(value~siteid+year+month+day+hour)
summary(anova.xc)
#MEANS BY GROUP (SITE,YEAR,MONTH,DAY,HOUR)
means.func=function(factor,trimx=0.05,roundx=4) {
means.x=tapply(value,factor,mean,trim=trimx)
return(round(means.x,digits=roundx))
}
means.func(year)
means.func(month)
means.func(day)
means.func(hour,roundx=3)
#PLOTS BY GROUP (SITE,YEAR,MONTH,DAY,HOUR)
plot.func=function(factor) {
stripchart(value~factor,method="stack",vertical=TRUE,
pch=1,cex=0.0001,xlab=as.character(substitute(factor)),ylab="ozone(ppm)",
ylim=c(0,0.05),main="Ozone Trend (2014-2016)",col="gray")
title(sub="Pre-Analysis Plot",adj=0,cex=0.1)
points(c(1:length(levels(factor))),tapply(value,factor,mean,trim=0.05),col=2,pch=8)
for (i in 1:length(levels(factor))) {
avg=tapply(value,factor,mean,trim=0.05)[i]
stdev=tapply(value,factor,sd)[i]
arrows(i,avg-stdev,i,avg+stdev,length=0.05,angle=90,code=3,col=16,lwd=0.6)
}
#text(c(1:length(levels(factor))),tapply(value,factor,mean,trim=0.05),
# labels=round(tapply(value,factor,mean,trim=0.05),4),pos=1)
abline(h=mean(value,trim=0.05),lty=2,lwd=1.2,col=2)
legend("bottomright",inset=0.02,
c("ozone (ppm)",paste(as.character(substitute(factor)),"mean",sep=" "),"overall mean"),
col=c(152,2,2),text.col="black",lty=c(0,0,2),pch=c(1,8,NA),bg="gray99")
}
plot.func(siteid)
plot.func(year)
plot.func(month)
plot.func(day)
plot.func(hour)
#TEST FOR NORMALITY: ANDERSON-DARLING
normality.func=function(vector.sample) { # vector.sample is an error vector
qqnorm(vector.sample,datax=TRUE,cex.lab=1.5)
qqline(vector.sample,datax=TRUE)
p.norm=nortest::ad.test(vector.sample)$p.value
norm=ifelse(nortest::ad.test(vector.sample)$p.value<=0.05,
"Ha:Normality Violated","Ho:Normality Verified")
paste(norm," ","p-value=",p.norm)
}
normality.func(anova.xc$residuals)
#KRUSKAL-WALLIS TEST: NON-PARAMETRIC 1-WAY TEST
krtest.func=function(kvalue,kgroup) { # kvalue is a numeric vector of values
# kgroup is a group factor
kr=kruskal.test(kvalue~kgroup)
ifelse(kr$p.value<=0.05,
"Ha:Groups significantly differ","Ho:Groups are alike")
paste(kr$p.value)
}
krtest.func(value,day)
krtest.func(value,month)
#FRIEDMAN TEST: NON-PARAMETRIC 2-WAY TEST
agg.x<<-aggregate(value~day+hour,FUN="mean")
kalday.func=function(xday1,xday2) {
df.x=data.frame(agg.x[agg.x$day %in% c(xday1,xday2),])
df.x$day=factor(df.x$day);levels(df.x$day)
fr.x=friedman.test(value~day|hour,data=df.x)
fr.out=ifelse(fr.x$p.value<=0.05,
"Ha:Different","Ho:Same")
return(paste(fr.out," p-value=",round(fr.x$p.value,3)))
}
pair.func=function() {
for (i in levels(day)) {
for (j in levels(day)) {
while (i!=j) {
print(paste(i,"-",j,kalday.func(i,j)))
break
}}}
}
pair.func()
Pairwise Comparison of Daily Ozone Concentration in Tampa-St.Petersburg Region (abstract, R code)

More Related Content

Similar to Pairwise Comparison of Daily Ozone Concentration in Tampa-St.Petersburg Region (abstract, R code)

Evaluation Of A Correlation Analysis Essay
Evaluation Of A Correlation Analysis EssayEvaluation Of A Correlation Analysis Essay
Evaluation Of A Correlation Analysis EssayCrystal Alvarez
 
Developments in pollution risk forecasting at the Environment Agency. Deborah...
Developments in pollution risk forecasting at the Environment Agency. Deborah...Developments in pollution risk forecasting at the Environment Agency. Deborah...
Developments in pollution risk forecasting at the Environment Agency. Deborah...Stephen Flood
 
Time series forecasting of solid waste generation in arusha city tanzania
Time series forecasting of solid waste generation in arusha city   tanzaniaTime series forecasting of solid waste generation in arusha city   tanzania
Time series forecasting of solid waste generation in arusha city tanzaniaAlexander Decker
 
Time Series Data Analysis for Forecasting – A Literature Review
Time Series Data Analysis for Forecasting – A Literature ReviewTime Series Data Analysis for Forecasting – A Literature Review
Time Series Data Analysis for Forecasting – A Literature ReviewIJMER
 
Disaggregation of Annual to daily Streamflows: A lineardeterministic method
Disaggregation of Annual to daily Streamflows: A lineardeterministic methodDisaggregation of Annual to daily Streamflows: A lineardeterministic method
Disaggregation of Annual to daily Streamflows: A lineardeterministic methodIOSRJAP
 
Comparison of Different Evapotranspiration Estimation Techniques for Mohanpur...
Comparison of Different Evapotranspiration Estimation Techniques for Mohanpur...Comparison of Different Evapotranspiration Estimation Techniques for Mohanpur...
Comparison of Different Evapotranspiration Estimation Techniques for Mohanpur...ijceronline
 
Functional Data Analysis of Hydrological Data in the Potomac River Valley
Functional Data Analysis of Hydrological Data in the Potomac River ValleyFunctional Data Analysis of Hydrological Data in the Potomac River Valley
Functional Data Analysis of Hydrological Data in the Potomac River ValleyAaron Zelmanow
 
W7-D3Two-Sample Hypothesis Tests of Means.pptx
W7-D3Two-Sample Hypothesis Tests of Means.pptxW7-D3Two-Sample Hypothesis Tests of Means.pptx
W7-D3Two-Sample Hypothesis Tests of Means.pptxIvyJoyceBuan2
 
Lombardi_EPA_NARS_Proposal_Final
Lombardi_EPA_NARS_Proposal_FinalLombardi_EPA_NARS_Proposal_Final
Lombardi_EPA_NARS_Proposal_FinalJohn Lombardi
 
Comparative Study of Machine Learning Algorithms for Rainfall Prediction
Comparative Study of Machine Learning Algorithms for Rainfall PredictionComparative Study of Machine Learning Algorithms for Rainfall Prediction
Comparative Study of Machine Learning Algorithms for Rainfall Predictionijtsrd
 
Isotope ratio mass spectrometry minireview
Isotope ratio mass spectrometry   minireviewIsotope ratio mass spectrometry   minireview
Isotope ratio mass spectrometry minireviewMahbubul Hassan
 
The PFAS conundrum: Mass spectrometry solutions for addressing it.
The PFAS conundrum: Mass spectrometry solutions for addressing it.The PFAS conundrum: Mass spectrometry solutions for addressing it.
The PFAS conundrum: Mass spectrometry solutions for addressing it.Shimadzu Scientific Instruments
 
BASIC STATISTICAL TREATMENT IN RESEARCH.pptx
BASIC STATISTICAL TREATMENT IN RESEARCH.pptxBASIC STATISTICAL TREATMENT IN RESEARCH.pptx
BASIC STATISTICAL TREATMENT IN RESEARCH.pptxardrianmalangen2
 
Application of the extreme learning machine algorithm for the
Application of the extreme learning machine algorithm for theApplication of the extreme learning machine algorithm for the
Application of the extreme learning machine algorithm for themehmet şahin
 
Pairwise Comparison of Daily Ozone Concentration in Tampa-St.Petersburg Regio...
Pairwise Comparison of Daily Ozone Concentration in Tampa-St.Petersburg Regio...Pairwise Comparison of Daily Ozone Concentration in Tampa-St.Petersburg Regio...
Pairwise Comparison of Daily Ozone Concentration in Tampa-St.Petersburg Regio...Kalaivanan Murthy
 
XRF interlaboratory comparision.pdf
XRF interlaboratory comparision.pdfXRF interlaboratory comparision.pdf
XRF interlaboratory comparision.pdfharika923209
 

Similar to Pairwise Comparison of Daily Ozone Concentration in Tampa-St.Petersburg Region (abstract, R code) (20)

Evaluation Of A Correlation Analysis Essay
Evaluation Of A Correlation Analysis EssayEvaluation Of A Correlation Analysis Essay
Evaluation Of A Correlation Analysis Essay
 
Time Series Analysis
Time Series AnalysisTime Series Analysis
Time Series Analysis
 
Developments in pollution risk forecasting at the Environment Agency. Deborah...
Developments in pollution risk forecasting at the Environment Agency. Deborah...Developments in pollution risk forecasting at the Environment Agency. Deborah...
Developments in pollution risk forecasting at the Environment Agency. Deborah...
 
Time series forecasting of solid waste generation in arusha city tanzania
Time series forecasting of solid waste generation in arusha city   tanzaniaTime series forecasting of solid waste generation in arusha city   tanzania
Time series forecasting of solid waste generation in arusha city tanzania
 
Time Series Data Analysis for Forecasting – A Literature Review
Time Series Data Analysis for Forecasting – A Literature ReviewTime Series Data Analysis for Forecasting – A Literature Review
Time Series Data Analysis for Forecasting – A Literature Review
 
Disaggregation of Annual to daily Streamflows: A lineardeterministic method
Disaggregation of Annual to daily Streamflows: A lineardeterministic methodDisaggregation of Annual to daily Streamflows: A lineardeterministic method
Disaggregation of Annual to daily Streamflows: A lineardeterministic method
 
Comparison of Different Evapotranspiration Estimation Techniques for Mohanpur...
Comparison of Different Evapotranspiration Estimation Techniques for Mohanpur...Comparison of Different Evapotranspiration Estimation Techniques for Mohanpur...
Comparison of Different Evapotranspiration Estimation Techniques for Mohanpur...
 
Functional Data Analysis of Hydrological Data in the Potomac River Valley
Functional Data Analysis of Hydrological Data in the Potomac River ValleyFunctional Data Analysis of Hydrological Data in the Potomac River Valley
Functional Data Analysis of Hydrological Data in the Potomac River Valley
 
W7-D3Two-Sample Hypothesis Tests of Means.pptx
W7-D3Two-Sample Hypothesis Tests of Means.pptxW7-D3Two-Sample Hypothesis Tests of Means.pptx
W7-D3Two-Sample Hypothesis Tests of Means.pptx
 
Lombardi_EPA_NARS_Proposal_Final
Lombardi_EPA_NARS_Proposal_FinalLombardi_EPA_NARS_Proposal_Final
Lombardi_EPA_NARS_Proposal_Final
 
Ax4301259274
Ax4301259274Ax4301259274
Ax4301259274
 
Comparative Study of Machine Learning Algorithms for Rainfall Prediction
Comparative Study of Machine Learning Algorithms for Rainfall PredictionComparative Study of Machine Learning Algorithms for Rainfall Prediction
Comparative Study of Machine Learning Algorithms for Rainfall Prediction
 
Scheel et al_2011_trmm_andes
Scheel et al_2011_trmm_andesScheel et al_2011_trmm_andes
Scheel et al_2011_trmm_andes
 
Isotope ratio mass spectrometry minireview
Isotope ratio mass spectrometry   minireviewIsotope ratio mass spectrometry   minireview
Isotope ratio mass spectrometry minireview
 
The PFAS conundrum: Mass spectrometry solutions for addressing it.
The PFAS conundrum: Mass spectrometry solutions for addressing it.The PFAS conundrum: Mass spectrometry solutions for addressing it.
The PFAS conundrum: Mass spectrometry solutions for addressing it.
 
BASIC STATISTICAL TREATMENT IN RESEARCH.pptx
BASIC STATISTICAL TREATMENT IN RESEARCH.pptxBASIC STATISTICAL TREATMENT IN RESEARCH.pptx
BASIC STATISTICAL TREATMENT IN RESEARCH.pptx
 
Next Generation Systems
Next Generation SystemsNext Generation Systems
Next Generation Systems
 
Application of the extreme learning machine algorithm for the
Application of the extreme learning machine algorithm for theApplication of the extreme learning machine algorithm for the
Application of the extreme learning machine algorithm for the
 
Pairwise Comparison of Daily Ozone Concentration in Tampa-St.Petersburg Regio...
Pairwise Comparison of Daily Ozone Concentration in Tampa-St.Petersburg Regio...Pairwise Comparison of Daily Ozone Concentration in Tampa-St.Petersburg Regio...
Pairwise Comparison of Daily Ozone Concentration in Tampa-St.Petersburg Regio...
 
XRF interlaboratory comparision.pdf
XRF interlaboratory comparision.pdfXRF interlaboratory comparision.pdf
XRF interlaboratory comparision.pdf
 

More from Kalaivanan Murthy

Life Cycle Analysis of Greenhouse Gases for Sugarcane Ethanol
Life Cycle Analysis of Greenhouse Gases for Sugarcane EthanolLife Cycle Analysis of Greenhouse Gases for Sugarcane Ethanol
Life Cycle Analysis of Greenhouse Gases for Sugarcane EthanolKalaivanan Murthy
 
Analysis of Stratospheric Tropospheric Intrusion as a Function of Potential V...
Analysis of Stratospheric Tropospheric Intrusion as a Function of Potential V...Analysis of Stratospheric Tropospheric Intrusion as a Function of Potential V...
Analysis of Stratospheric Tropospheric Intrusion as a Function of Potential V...Kalaivanan Murthy
 
Seismic Analysis of Elevated Water Tank
Seismic Analysis of Elevated Water TankSeismic Analysis of Elevated Water Tank
Seismic Analysis of Elevated Water TankKalaivanan Murthy
 
Approaches in Scientific Research
Approaches in Scientific ResearchApproaches in Scientific Research
Approaches in Scientific ResearchKalaivanan Murthy
 
Impact of Greenhouse Gases on Climate Policy
Impact of Greenhouse Gases on Climate PolicyImpact of Greenhouse Gases on Climate Policy
Impact of Greenhouse Gases on Climate PolicyKalaivanan Murthy
 
Biodiesel vs. Diesel: Air Quality and Economic Aspects
Biodiesel vs. Diesel: Air Quality and Economic AspectsBiodiesel vs. Diesel: Air Quality and Economic Aspects
Biodiesel vs. Diesel: Air Quality and Economic AspectsKalaivanan Murthy
 
Performance of Biodiesel against Petroleum Diesel
Performance of Biodiesel against Petroleum DieselPerformance of Biodiesel against Petroleum Diesel
Performance of Biodiesel against Petroleum DieselKalaivanan Murthy
 
Near-field Gaussian Dispersion Analysis in AERMOD: A demonstration project (I...
Near-field Gaussian Dispersion Analysis in AERMOD: A demonstration project (I...Near-field Gaussian Dispersion Analysis in AERMOD: A demonstration project (I...
Near-field Gaussian Dispersion Analysis in AERMOD: A demonstration project (I...Kalaivanan Murthy
 
Application of Regression Analysis: Model Building and Validation
Application of Regression Analysis: Model Building and Validation  Application of Regression Analysis: Model Building and Validation
Application of Regression Analysis: Model Building and Validation Kalaivanan Murthy
 
Performance Appraisal (Part-2/2: Graphical Representation)
Performance Appraisal (Part-2/2: Graphical Representation)Performance Appraisal (Part-2/2: Graphical Representation)
Performance Appraisal (Part-2/2: Graphical Representation)Kalaivanan Murthy
 
Gasphase Oxidation Products of Isoprene
Gasphase Oxidation Products of IsopreneGasphase Oxidation Products of Isoprene
Gasphase Oxidation Products of IsopreneKalaivanan Murthy
 
Respiratory Illness Mortality: Global Health Burden due to Ozone and PM2.5
Respiratory Illness Mortality: Global Health Burden due to Ozone and PM2.5Respiratory Illness Mortality: Global Health Burden due to Ozone and PM2.5
Respiratory Illness Mortality: Global Health Burden due to Ozone and PM2.5Kalaivanan Murthy
 
Application of Multivariate Regression Analysis and Analysis of Variance
Application of Multivariate Regression Analysis and Analysis of VarianceApplication of Multivariate Regression Analysis and Analysis of Variance
Application of Multivariate Regression Analysis and Analysis of VarianceKalaivanan Murthy
 
Multivariate Regression Analysis
Multivariate Regression AnalysisMultivariate Regression Analysis
Multivariate Regression AnalysisKalaivanan Murthy
 
Gasphase Oxidation Products of Isoprene
Gasphase Oxidation Products of IsopreneGasphase Oxidation Products of Isoprene
Gasphase Oxidation Products of IsopreneKalaivanan Murthy
 

More from Kalaivanan Murthy (20)

Life Cycle Analysis of Greenhouse Gases for Sugarcane Ethanol
Life Cycle Analysis of Greenhouse Gases for Sugarcane EthanolLife Cycle Analysis of Greenhouse Gases for Sugarcane Ethanol
Life Cycle Analysis of Greenhouse Gases for Sugarcane Ethanol
 
Analysis of Stratospheric Tropospheric Intrusion as a Function of Potential V...
Analysis of Stratospheric Tropospheric Intrusion as a Function of Potential V...Analysis of Stratospheric Tropospheric Intrusion as a Function of Potential V...
Analysis of Stratospheric Tropospheric Intrusion as a Function of Potential V...
 
Seismic Analysis of Elevated Water Tank
Seismic Analysis of Elevated Water TankSeismic Analysis of Elevated Water Tank
Seismic Analysis of Elevated Water Tank
 
Approaches in Scientific Research
Approaches in Scientific ResearchApproaches in Scientific Research
Approaches in Scientific Research
 
Hybrid Leadership
Hybrid LeadershipHybrid Leadership
Hybrid Leadership
 
How to write better emails?
How to write better emails?How to write better emails?
How to write better emails?
 
Impact of Greenhouse Gases on Climate Policy
Impact of Greenhouse Gases on Climate PolicyImpact of Greenhouse Gases on Climate Policy
Impact of Greenhouse Gases on Climate Policy
 
Biodiesel vs. Diesel: Air Quality and Economic Aspects
Biodiesel vs. Diesel: Air Quality and Economic AspectsBiodiesel vs. Diesel: Air Quality and Economic Aspects
Biodiesel vs. Diesel: Air Quality and Economic Aspects
 
Performance of Biodiesel against Petroleum Diesel
Performance of Biodiesel against Petroleum DieselPerformance of Biodiesel against Petroleum Diesel
Performance of Biodiesel against Petroleum Diesel
 
Near-field Gaussian Dispersion Analysis in AERMOD: A demonstration project (I...
Near-field Gaussian Dispersion Analysis in AERMOD: A demonstration project (I...Near-field Gaussian Dispersion Analysis in AERMOD: A demonstration project (I...
Near-field Gaussian Dispersion Analysis in AERMOD: A demonstration project (I...
 
Autonomous Line Follower
Autonomous Line FollowerAutonomous Line Follower
Autonomous Line Follower
 
Application of Regression Analysis: Model Building and Validation
Application of Regression Analysis: Model Building and Validation  Application of Regression Analysis: Model Building and Validation
Application of Regression Analysis: Model Building and Validation
 
Performance Appraisal (Part-2/2: Graphical Representation)
Performance Appraisal (Part-2/2: Graphical Representation)Performance Appraisal (Part-2/2: Graphical Representation)
Performance Appraisal (Part-2/2: Graphical Representation)
 
Gasphase Oxidation Products of Isoprene
Gasphase Oxidation Products of IsopreneGasphase Oxidation Products of Isoprene
Gasphase Oxidation Products of Isoprene
 
Respiratory Illness Mortality: Global Health Burden due to Ozone and PM2.5
Respiratory Illness Mortality: Global Health Burden due to Ozone and PM2.5Respiratory Illness Mortality: Global Health Burden due to Ozone and PM2.5
Respiratory Illness Mortality: Global Health Burden due to Ozone and PM2.5
 
Climate Wedges
Climate Wedges Climate Wedges
Climate Wedges
 
Application of Multivariate Regression Analysis and Analysis of Variance
Application of Multivariate Regression Analysis and Analysis of VarianceApplication of Multivariate Regression Analysis and Analysis of Variance
Application of Multivariate Regression Analysis and Analysis of Variance
 
Multivariate Regression Analysis
Multivariate Regression AnalysisMultivariate Regression Analysis
Multivariate Regression Analysis
 
Gasphase Oxidation Products of Isoprene
Gasphase Oxidation Products of IsopreneGasphase Oxidation Products of Isoprene
Gasphase Oxidation Products of Isoprene
 
Remote Sensing of Aerosols
Remote Sensing of AerosolsRemote Sensing of Aerosols
Remote Sensing of Aerosols
 

Recently uploaded

IVE Industry Focused Event - Defence Sector 2024
IVE Industry Focused Event - Defence Sector 2024IVE Industry Focused Event - Defence Sector 2024
IVE Industry Focused Event - Defence Sector 2024Mark Billinghurst
 
VIP Call Girls Service Kondapur Hyderabad Call +91-8250192130
VIP Call Girls Service Kondapur Hyderabad Call +91-8250192130VIP Call Girls Service Kondapur Hyderabad Call +91-8250192130
VIP Call Girls Service Kondapur Hyderabad Call +91-8250192130Suhani Kapoor
 
College Call Girls Nashik Nehal 7001305949 Independent Escort Service Nashik
College Call Girls Nashik Nehal 7001305949 Independent Escort Service NashikCollege Call Girls Nashik Nehal 7001305949 Independent Escort Service Nashik
College Call Girls Nashik Nehal 7001305949 Independent Escort Service NashikCall Girls in Nagpur High Profile
 
CCS355 Neural Network & Deep Learning Unit II Notes with Question bank .pdf
CCS355 Neural Network & Deep Learning Unit II Notes with Question bank .pdfCCS355 Neural Network & Deep Learning Unit II Notes with Question bank .pdf
CCS355 Neural Network & Deep Learning Unit II Notes with Question bank .pdfAsst.prof M.Gokilavani
 
CCS355 Neural Network & Deep Learning UNIT III notes and Question bank .pdf
CCS355 Neural Network & Deep Learning UNIT III notes and Question bank .pdfCCS355 Neural Network & Deep Learning UNIT III notes and Question bank .pdf
CCS355 Neural Network & Deep Learning UNIT III notes and Question bank .pdfAsst.prof M.Gokilavani
 
VICTOR MAESTRE RAMIREZ - Planetary Defender on NASA's Double Asteroid Redirec...
VICTOR MAESTRE RAMIREZ - Planetary Defender on NASA's Double Asteroid Redirec...VICTOR MAESTRE RAMIREZ - Planetary Defender on NASA's Double Asteroid Redirec...
VICTOR MAESTRE RAMIREZ - Planetary Defender on NASA's Double Asteroid Redirec...VICTOR MAESTRE RAMIREZ
 
Introduction to Microprocesso programming and interfacing.pptx
Introduction to Microprocesso programming and interfacing.pptxIntroduction to Microprocesso programming and interfacing.pptx
Introduction to Microprocesso programming and interfacing.pptxvipinkmenon1
 
Model Call Girl in Narela Delhi reach out to us at 🔝8264348440🔝
Model Call Girl in Narela Delhi reach out to us at 🔝8264348440🔝Model Call Girl in Narela Delhi reach out to us at 🔝8264348440🔝
Model Call Girl in Narela Delhi reach out to us at 🔝8264348440🔝soniya singh
 
OSVC_Meta-Data based Simulation Automation to overcome Verification Challenge...
OSVC_Meta-Data based Simulation Automation to overcome Verification Challenge...OSVC_Meta-Data based Simulation Automation to overcome Verification Challenge...
OSVC_Meta-Data based Simulation Automation to overcome Verification Challenge...Soham Mondal
 
Oxy acetylene welding presentation note.
Oxy acetylene welding presentation note.Oxy acetylene welding presentation note.
Oxy acetylene welding presentation note.eptoze12
 
main PPT.pptx of girls hostel security using rfid
main PPT.pptx of girls hostel security using rfidmain PPT.pptx of girls hostel security using rfid
main PPT.pptx of girls hostel security using rfidNikhilNagaraju
 
Sheet Pile Wall Design and Construction: A Practical Guide for Civil Engineer...
Sheet Pile Wall Design and Construction: A Practical Guide for Civil Engineer...Sheet Pile Wall Design and Construction: A Practical Guide for Civil Engineer...
Sheet Pile Wall Design and Construction: A Practical Guide for Civil Engineer...Dr.Costas Sachpazis
 
Study on Air-Water & Water-Water Heat Exchange in a Finned Tube Exchanger
Study on Air-Water & Water-Water Heat Exchange in a Finned Tube ExchangerStudy on Air-Water & Water-Water Heat Exchange in a Finned Tube Exchanger
Study on Air-Water & Water-Water Heat Exchange in a Finned Tube ExchangerAnamika Sarkar
 
Current Transformer Drawing and GTP for MSETCL
Current Transformer Drawing and GTP for MSETCLCurrent Transformer Drawing and GTP for MSETCL
Current Transformer Drawing and GTP for MSETCLDeelipZope
 
Past, Present and Future of Generative AI
Past, Present and Future of Generative AIPast, Present and Future of Generative AI
Past, Present and Future of Generative AIabhishek36461
 
HARMONY IN THE NATURE AND EXISTENCE - Unit-IV
HARMONY IN THE NATURE AND EXISTENCE - Unit-IVHARMONY IN THE NATURE AND EXISTENCE - Unit-IV
HARMONY IN THE NATURE AND EXISTENCE - Unit-IVRajaP95
 
Application of Residue Theorem to evaluate real integrations.pptx
Application of Residue Theorem to evaluate real integrations.pptxApplication of Residue Theorem to evaluate real integrations.pptx
Application of Residue Theorem to evaluate real integrations.pptx959SahilShah
 

Recently uploaded (20)

IVE Industry Focused Event - Defence Sector 2024
IVE Industry Focused Event - Defence Sector 2024IVE Industry Focused Event - Defence Sector 2024
IVE Industry Focused Event - Defence Sector 2024
 
VIP Call Girls Service Kondapur Hyderabad Call +91-8250192130
VIP Call Girls Service Kondapur Hyderabad Call +91-8250192130VIP Call Girls Service Kondapur Hyderabad Call +91-8250192130
VIP Call Girls Service Kondapur Hyderabad Call +91-8250192130
 
College Call Girls Nashik Nehal 7001305949 Independent Escort Service Nashik
College Call Girls Nashik Nehal 7001305949 Independent Escort Service NashikCollege Call Girls Nashik Nehal 7001305949 Independent Escort Service Nashik
College Call Girls Nashik Nehal 7001305949 Independent Escort Service Nashik
 
CCS355 Neural Network & Deep Learning Unit II Notes with Question bank .pdf
CCS355 Neural Network & Deep Learning Unit II Notes with Question bank .pdfCCS355 Neural Network & Deep Learning Unit II Notes with Question bank .pdf
CCS355 Neural Network & Deep Learning Unit II Notes with Question bank .pdf
 
CCS355 Neural Network & Deep Learning UNIT III notes and Question bank .pdf
CCS355 Neural Network & Deep Learning UNIT III notes and Question bank .pdfCCS355 Neural Network & Deep Learning UNIT III notes and Question bank .pdf
CCS355 Neural Network & Deep Learning UNIT III notes and Question bank .pdf
 
VICTOR MAESTRE RAMIREZ - Planetary Defender on NASA's Double Asteroid Redirec...
VICTOR MAESTRE RAMIREZ - Planetary Defender on NASA's Double Asteroid Redirec...VICTOR MAESTRE RAMIREZ - Planetary Defender on NASA's Double Asteroid Redirec...
VICTOR MAESTRE RAMIREZ - Planetary Defender on NASA's Double Asteroid Redirec...
 
Introduction to Microprocesso programming and interfacing.pptx
Introduction to Microprocesso programming and interfacing.pptxIntroduction to Microprocesso programming and interfacing.pptx
Introduction to Microprocesso programming and interfacing.pptx
 
Model Call Girl in Narela Delhi reach out to us at 🔝8264348440🔝
Model Call Girl in Narela Delhi reach out to us at 🔝8264348440🔝Model Call Girl in Narela Delhi reach out to us at 🔝8264348440🔝
Model Call Girl in Narela Delhi reach out to us at 🔝8264348440🔝
 
OSVC_Meta-Data based Simulation Automation to overcome Verification Challenge...
OSVC_Meta-Data based Simulation Automation to overcome Verification Challenge...OSVC_Meta-Data based Simulation Automation to overcome Verification Challenge...
OSVC_Meta-Data based Simulation Automation to overcome Verification Challenge...
 
Oxy acetylene welding presentation note.
Oxy acetylene welding presentation note.Oxy acetylene welding presentation note.
Oxy acetylene welding presentation note.
 
main PPT.pptx of girls hostel security using rfid
main PPT.pptx of girls hostel security using rfidmain PPT.pptx of girls hostel security using rfid
main PPT.pptx of girls hostel security using rfid
 
★ CALL US 9953330565 ( HOT Young Call Girls In Badarpur delhi NCR
★ CALL US 9953330565 ( HOT Young Call Girls In Badarpur delhi NCR★ CALL US 9953330565 ( HOT Young Call Girls In Badarpur delhi NCR
★ CALL US 9953330565 ( HOT Young Call Girls In Badarpur delhi NCR
 
young call girls in Rajiv Chowk🔝 9953056974 🔝 Delhi escort Service
young call girls in Rajiv Chowk🔝 9953056974 🔝 Delhi escort Serviceyoung call girls in Rajiv Chowk🔝 9953056974 🔝 Delhi escort Service
young call girls in Rajiv Chowk🔝 9953056974 🔝 Delhi escort Service
 
Sheet Pile Wall Design and Construction: A Practical Guide for Civil Engineer...
Sheet Pile Wall Design and Construction: A Practical Guide for Civil Engineer...Sheet Pile Wall Design and Construction: A Practical Guide for Civil Engineer...
Sheet Pile Wall Design and Construction: A Practical Guide for Civil Engineer...
 
Study on Air-Water & Water-Water Heat Exchange in a Finned Tube Exchanger
Study on Air-Water & Water-Water Heat Exchange in a Finned Tube ExchangerStudy on Air-Water & Water-Water Heat Exchange in a Finned Tube Exchanger
Study on Air-Water & Water-Water Heat Exchange in a Finned Tube Exchanger
 
Current Transformer Drawing and GTP for MSETCL
Current Transformer Drawing and GTP for MSETCLCurrent Transformer Drawing and GTP for MSETCL
Current Transformer Drawing and GTP for MSETCL
 
Past, Present and Future of Generative AI
Past, Present and Future of Generative AIPast, Present and Future of Generative AI
Past, Present and Future of Generative AI
 
HARMONY IN THE NATURE AND EXISTENCE - Unit-IV
HARMONY IN THE NATURE AND EXISTENCE - Unit-IVHARMONY IN THE NATURE AND EXISTENCE - Unit-IV
HARMONY IN THE NATURE AND EXISTENCE - Unit-IV
 
9953056974 Call Girls In South Ex, Escorts (Delhi) NCR.pdf
9953056974 Call Girls In South Ex, Escorts (Delhi) NCR.pdf9953056974 Call Girls In South Ex, Escorts (Delhi) NCR.pdf
9953056974 Call Girls In South Ex, Escorts (Delhi) NCR.pdf
 
Application of Residue Theorem to evaluate real integrations.pptx
Application of Residue Theorem to evaluate real integrations.pptxApplication of Residue Theorem to evaluate real integrations.pptx
Application of Residue Theorem to evaluate real integrations.pptx
 

Pairwise Comparison of Daily Ozone Concentration in Tampa-St.Petersburg Region (abstract, R code)

  • 1. Pairwise Comparison of Daily Ozone Concentration in Tampa-St.Petersburg Region A statistical examination of ozone variation between days. Author: Kalaivanan Murthy A B S T R A C T The variation of ozone by day has become evident in the recent past, and it has been supported by the observation that human activity – mainly automobile emission – varies by day over the course of a week. And the variation is supposed to be cyclic, which means the trend repeats itself every week. This project aims to examine the claim by use of statistical methods. Hourly ozone data is downloaded from EPA for the seven stations spread across Tampa-St.Petersburg region for the last three years (2014, 2015 and 2016). The data is governed by five factors: site location, year, month, day, and hour. Student’s t-distribution based ANOVA (Analysis of Variance) was performed on the data, and the resulting residuals highly deviate from the normal distribution. This deviation is confirmed by Anderson-Darling test. Since the residuals are not normally distributed, parametric methods cannot be used. Hence, non-parametric methods are used here. To perform the non-parametric comparison, the data is categorized by two factors, which are day and hour. Kruskal-Wallis test, a non-parametric one-way ANOVA test, is used to test the hypothesis that there exists variation among days, and it confirms the hypothesis at 5% significance level. The hypothesis is also confirmed by Wilcoxon rank-sum test, which is a similar one-way non-parametric ANOVA test for identifying group effects. To perform pairwise comparison, the data is averaged by pooling hourly observations for every unique day for three years. Friedman test, a non-parametric two-way ANOVA test, is used to test the hypothesis that ‘there exists significant difference between a pair of days which are being compared’. Friedman test is chosen because it allows to compare the ‘day’ factor while eliminating the interference of hourly variation within a day. The results show that there exists a difference between days; and those pairs of days which differ are explained in the poster.
  • 2. Pairwise Comparison of Daily Ozone Concentration in Tampa-St.Petersburg Region Programmed by Kalaivanan Murthy Programming Language: R SOURCE CODE #READ DATA AND BUILD DATAFRAME data.raw=read.csv("C:/Users/Kalaivanan Murthy/Documents/DATA/tampa/to_database.txt",header=T, stringsAsFactors=F) s=stringr::str_split_fixed(data.raw$datetime,"[T-]",3) date.s=strptime(s[,1],"%Y%m%d") data.xc=data.frame(siteid=factor(data.raw$site),date.s, day=factor(weekdays(date.s)), month=factor(format(date.s,"%B")), year=factor(format(date.s,"%Y")), hour=factor(s[,2]),value=data.raw$value) attach(data.xc) str(data.xc) #FACTOR DATA: SORT FACTOR LEVELS siteid=factor(siteid,levels=c("840120571065","840120571035","840120570081","840120573002", "840121030004","840121030018","840121035002"), labels=c("T-USMC","T-Davis","T-EGSPrk","T-Sydney", "SP-SPJrCol","SP-AzaPrk","SP-JCPrk")) levels(month)=c("January","February","March","April", "May","June","July","August", "September","October","November","December") levels(day)=c("Monday","Tuesday","Wednesday","Thursday", "Friday","Saturday","Sunday") #SUMMARY STATISTICS summary(value) unique(value)[which.max(tabulate(match(v, unique(value))))] #mode range(value) sd(value) boxplot(value,main="Box-and-whisker",xlab="ozone (ppm)", horizontal=T, varwidth=1, cex.axis=2.5, cex.lab=2.5) #ANOVA: INDEPENDENT FACTORS anova.xc=aov(value~siteid+year+month+day+hour) summary(anova.xc) #MEANS BY GROUP (SITE,YEAR,MONTH,DAY,HOUR) means.func=function(factor,trimx=0.05,roundx=4) { means.x=tapply(value,factor,mean,trim=trimx) return(round(means.x,digits=roundx)) } means.func(year) means.func(month) means.func(day) means.func(hour,roundx=3) #PLOTS BY GROUP (SITE,YEAR,MONTH,DAY,HOUR) plot.func=function(factor) { stripchart(value~factor,method="stack",vertical=TRUE, pch=1,cex=0.0001,xlab=as.character(substitute(factor)),ylab="ozone(ppm)", ylim=c(0,0.05),main="Ozone Trend (2014-2016)",col="gray") title(sub="Pre-Analysis Plot",adj=0,cex=0.1) points(c(1:length(levels(factor))),tapply(value,factor,mean,trim=0.05),col=2,pch=8) for (i in 1:length(levels(factor))) { avg=tapply(value,factor,mean,trim=0.05)[i] stdev=tapply(value,factor,sd)[i] arrows(i,avg-stdev,i,avg+stdev,length=0.05,angle=90,code=3,col=16,lwd=0.6)
  • 3. } #text(c(1:length(levels(factor))),tapply(value,factor,mean,trim=0.05), # labels=round(tapply(value,factor,mean,trim=0.05),4),pos=1) abline(h=mean(value,trim=0.05),lty=2,lwd=1.2,col=2) legend("bottomright",inset=0.02, c("ozone (ppm)",paste(as.character(substitute(factor)),"mean",sep=" "),"overall mean"), col=c(152,2,2),text.col="black",lty=c(0,0,2),pch=c(1,8,NA),bg="gray99") } plot.func(siteid) plot.func(year) plot.func(month) plot.func(day) plot.func(hour) #TEST FOR NORMALITY: ANDERSON-DARLING normality.func=function(vector.sample) { # vector.sample is an error vector qqnorm(vector.sample,datax=TRUE,cex.lab=1.5) qqline(vector.sample,datax=TRUE) p.norm=nortest::ad.test(vector.sample)$p.value norm=ifelse(nortest::ad.test(vector.sample)$p.value<=0.05, "Ha:Normality Violated","Ho:Normality Verified") paste(norm," ","p-value=",p.norm) } normality.func(anova.xc$residuals) #KRUSKAL-WALLIS TEST: NON-PARAMETRIC 1-WAY TEST krtest.func=function(kvalue,kgroup) { # kvalue is a numeric vector of values # kgroup is a group factor kr=kruskal.test(kvalue~kgroup) ifelse(kr$p.value<=0.05, "Ha:Groups significantly differ","Ho:Groups are alike") paste(kr$p.value) } krtest.func(value,day) krtest.func(value,month) #FRIEDMAN TEST: NON-PARAMETRIC 2-WAY TEST agg.x<<-aggregate(value~day+hour,FUN="mean") kalday.func=function(xday1,xday2) { df.x=data.frame(agg.x[agg.x$day %in% c(xday1,xday2),]) df.x$day=factor(df.x$day);levels(df.x$day) fr.x=friedman.test(value~day|hour,data=df.x) fr.out=ifelse(fr.x$p.value<=0.05, "Ha:Different","Ho:Same") return(paste(fr.out," p-value=",round(fr.x$p.value,3))) } pair.func=function() { for (i in levels(day)) { for (j in levels(day)) { while (i!=j) { print(paste(i,"-",j,kalday.func(i,j))) break }}} } pair.func()