Market Analysis: Softs and Grains week ended Oct 28, 2016
•
0 likes•214 views

Technical analysis of agricultural markets

Recommended
Recommended
More Related Content
Recently uploaded
Recently uploaded (20)
Featured
Featured (20)
Market Analysis: Softs and Grains week ended Oct 28, 2016
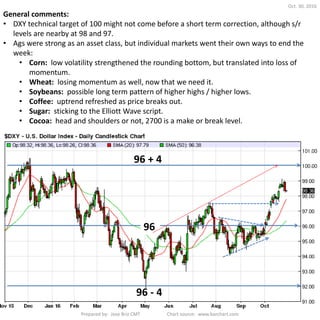
- 1. General comments: • DXY technical target of 100 might not come before a short term correction, although s/r levels are nearby at 98 and 97. • Ags were strong as an asset class, but individual markets went their own ways to end the week: • Corn: low volatility strengthened the rounding bottom, but translated into loss of momentum. • Wheat: losing momentum as well, now that we need it. • Soybeans: possible long term pattern of higher highs / higher lows. • Coffee: uptrend refreshed as price breaks out. • Sugar: sticking to the Elliott Wave script. • Cocoa: head and shoulders or not, 2700 is a make or break level. 96 96 + 4 96 - 4 Prepared by: Jose Briz CMT Chart source: www.barchart.com Oct. 30, 2016
- 2. CBOT Corn (daily chart): • Rounding bottom in corn takes it back to the 360-380 S/R zone in effect since 2014 as shown on last week’s weekly chart. Spikes to 450 are not out of the question. • Short term, however, look out for lost momentum last week, and a possible small correction Prepared by: Jose Briz CMT Chart source: www.barchart.com Oct. 30, 2016
- 3. CBOT Wheat (daily chart): • Wheat lost momentum needed to get into the resistance area and Friday’s close below the moving averages could push it back to year lows. Would rather be cautious wheat below 450. Resistance Area Oct. 30, 2016 Prepared by: Jose Briz CMT Chart source: www.barchart.com
- 4. CBOT Soybeans (weekly chart): • Weekly soybeans chart more interesting than the daily as we may be watching market action of long term relevance. Next resistance is 1050, then 1100, then few things stand between soybeans and a fresh higher-high / higher-low pattern. Prepared by: Jose Briz CMT Chart source: www.barchart.com Oct. 30, 2016
- 5. ICE Coffee (daily chart): • Breakout above 165 refreshes the coffee rally and sets the stage for a 180 target, maybe even 185 given coffee’s volatility. As days go by, moving averages could get into the previous resistance area, making it even stronger as future support. Previous resistance area 20 cts/lb range Prepared by: Jose Briz CMT Chart source: www.barchart.com Oct. 30, 2016
- 6. ICE Sugar (weekly chart): • Very low volume on this correction that may mark the end of the III rd wave. Expectations purely based on Elliott Wave Theory are for an a-b-c correction down to 20.50, and then a V impulse wave to new highs. I II III i ii iii iv v Prepared by: Jose Briz CMT Chart source: www.barchart.com Oct. 30, 2016
- 7. ICE Cocoa: • Still undecided about cocoa. Those following the Momentum Thesis saw the classic pullback to the trendline on slightly lower volume. Those following the Contrarian Thesis are seeing an oversold market reiterating its support. Momentum Thesis : Head and shoulders top Contrarian Thesis : Not yet Momentum or Contrarian? Heavy volume doesn’t help the head and shoulders thesis Prepared by: Jose Briz CMT Chart source: www.barchart.com Oct. 30, 2016
- 8. DISCLAIMER Prepared by: Jose Briz CMT This presentation is an analysis of past price action and uses technical analysis tools such as charting and mathematical calculations based on time series data of price and volume. It is meant to be descriptive, not proscriptive, and comments about upside and downside potential are my own. Before taking any action, do your own analysis, see what conclusions you arrive at, and choose to trade the instruments and volumes that are appropriate to your own situation.