Market Analysis: Softs and Grains week ended Oct 21, 2016
•
0 likes•151 views

Technical Analysis of the US Dollar and Agricultural Commodities (corn, wheat, soybeans, coffee, sugar, and cocoa).

Recommended
More Related Content
Viewers also liked
Viewers also liked (12)
Similar to Market Analysis: Softs and Grains week ended Oct 21, 2016
Similar to Market Analysis: Softs and Grains week ended Oct 21, 2016 (7)
Recently uploaded
Recently uploaded (20)
Market Analysis: Softs and Grains week ended Oct 21, 2016
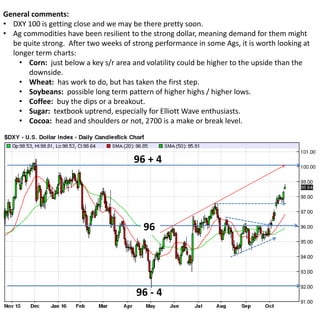
- 1. General comments: • DXY 100 is getting close and we may be there pretty soon. • Ag commodities have been resilient to the strong dollar, meaning demand for them might be quite strong. After two weeks of strong performance in some Ags, it is worth looking at longer term charts: • Corn: just below a key s/r area and volatility could be higher to the upside than the downside. • Wheat: has work to do, but has taken the first step. • Soybeans: possible long term pattern of higher highs / higher lows. • Coffee: buy the dips or a breakout. • Sugar: textbook uptrend, especially for Elliott Wave enthusiasts. • Cocoa: head and shoulders or not, 2700 is a make or break level. 96 96 + 4 96 - 4
- 2. CBOT Corn (weekly chart): • Rounding bottom in corn takes it back to the 360-380 S/R zone in effect since 2014. Once back into this zone, spikes to 450 are not out of the question. A break above 450 would mean possible long term bull move for corn.
- 3. CBOT Wheat (daily chart): • Last few days have retraced part of the breakout from 2-month base. Price above the 20 & 50d MA’s should be a good sign for the bulls. 430-450 resistance area is strong in both daily and weekly charts. A break above 450 would be a very bullish development. Resistance Area
- 4. CBOT Soybeans (weekly chart): • Aggressive buyers could enter this dip with a tight stop under the 50 week MA and hope for a breakout above 1000. Upside volume has been encouraging this year, and there’s potential for a fresh ‘higher-high/higher-low’ pattern to emerge from here.
- 5. ICE Coffee (daily chart): • Coffee is still a buy; good entry points would be dips to the 50 day MA or a buy stop above resistance the area. Low volume should be interpreted as very little resistance to the current trend, which might mean that the uptrend is the status quo and is not yet crowded. Resistance area 20 cts/lb range
- 6. ICE Sugar (weekly chart): • There might be room for a correction in the sugar market, but notice how price held on to short term support despite fall in open interest. The trend’s structure is very healthy with clear wave-counting possibilities, which attract financial traders. I II III i ii iii iv v
- 7. ICE Cocoa: • Awkward situation because we can argue that a head and shoulders pattern has been completed and we can argue that it has not. What’s true is that the 2700 support is holding and, if broken, 2200 becomes a technical target. Momentum Thesis : Head and shoulders top Contrarian Thesis : Not yet Momentum or Contrarian? Heavy volume doesn’t help the head and shoulders thesis
- 8. DISCLAIMER Prepared by: Jose Briz CMT This presentation is an analysis of past price action and uses technical analysis tools such as charting and mathematical calculations based on time series data of price and volume. It is meant to be descriptive, not proscriptive, and comments about upside and downside potential are my own. Before taking any action, do your own analysis, see what conclusions you arrive at, and choose to trade the instruments and volumes that are appropriate to your own situation.