Market Analysis: Softs and Grains week ended Nov 11, 2016
•
0 likes•86 views

Technical analysis of agricultural commodities: corn, wheat, soybeans, sugar, coffee, cocoa

Recommended
More Related Content
Viewers also liked
Similar to Market Analysis: Softs and Grains week ended Nov 11, 2016
Similar to Market Analysis: Softs and Grains week ended Nov 11, 2016 (20)
Recently uploaded
Recently uploaded (20)
Market Analysis: Softs and Grains week ended Nov 11, 2016
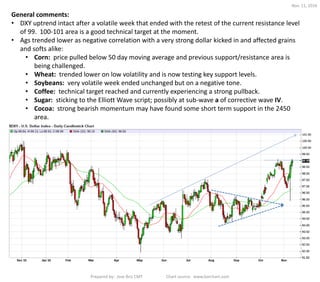
- 1. General comments: • DXY uptrend intact after a volatile week that ended with the retest of the current resistance level of 99. 100-101 area is a good technical target at the moment. • Ags trended lower as negative correlation with a very strong dollar kicked in and affected grains and softs alike: • Corn: price pulled below 50 day moving average and previous support/resistance area is being challenged. • Wheat: trended lower on low volatility and is now testing key support levels. • Soybeans: very volatile week ended unchanged but on a negative tone. • Coffee: technical target reached and currently experiencing a strong pullback. • Sugar: sticking to the Elliott Wave script; possibly at sub-wave a of corrective wave IV. • Cocoa: strong bearish momentum may have found some short term support in the 2450 area. Prepared by: Jose Briz CMT Chart source: www.barchart.com Nov. 11, 2016
- 2. CBOT Corn (daily chart): • Rounding bottom in October took it back to a S/R zone that can be traced back to 2014, but last week’s volatility took it back below the zone and the 50 day MA. • Narrow support area of 340 – 346 is key right now, otherwise bearish momentum can pick up steam. Prepared by: Jose Briz CMT Chart source: www.barchart.com Nov. 11, 2016 R = 354 R = 369 R = 390 Support area
- 3. CBOT Wheat (daily chart): • Wheat has experienced very low volatility within the 410 – 430 zone, has been able to digest a lot of information without moving much. However, were starting to see weakness in other grains and volatility may return. • Inability to hold above 410 may paint the October strength as a false breakout, and these are often followed by strong moves in the opposite direction. Nov. 11, 2016 Prepared by: Jose Briz CMT Chart source: www.barchart.com
- 4. CBOT Soybeans (daily chart): • What soybeans prices lacked in direction, they more than made up in volatility. The wild swings respected the 990 support and 1030 resistance in the H7 contract to end the week almost unchanged. Judging by its ability to close above the 50 day MA, soybeans looks stronger than the other grains and a move above its 20 day MA may help corn and wheat get out of the trouble zones they got into. Prepared by: Jose Briz CMT Chart source: www.barchart.com Nov. 11, 2016
- 5. ICE Coffee (daily chart): • H7 Coffee almost completes the 20ct move early Tuesday before a week marked by strong selling activity. Open interest is also falling, as expected during a risk-off move. • At the moment, 160 is a key level and Friday’s close points to a high probability it will be challenged the coming week. Previous resistance area 20 cts/lb range Prepared by: Jose Briz CMT Chart source: www.barchart.com Nov. 11, 2016
- 6. ICE Sugar (weekly chart): • Sugar correction continued, although at a slower pace, and 20-week MA continued to support price. The analysis continues to be: • We are seeing a correction that marks the end of impulse wave III. Expectations purely based on Elliott Wave Theory are for an a-b-c correction down to 20.50, and then a V impulse wave to new highs. I II III i ii iii iv v Prepared by: Jose Briz CMT Chart source: www.barchart.com Nov. 11, 2016 a?
- 7. ICE Cocoa (weekly chart): • Another week of strong momentum found some support at an old resistance zone around 2450. We may see price catch some air at around these levels and even correct a bit to the upside to retest old supports. • Technical target to the downside is 2100 based on the distance between the Dec 15 top and the level of the breakout. Strong Momentum Prepared by: Jose Briz CMT Chart source: www.barchart.com Nov. 11, 2016
- 8. DISCLAIMER Prepared by: Jose Briz CMT This presentation is an analysis of past price action and uses technical analysis tools such as charting and mathematical calculations based on time series data of price and volume. It is meant to be descriptive, not proscriptive, and comments about upside and downside potential are my own. Before taking any action, do your own analysis, see what conclusions you arrive at, and choose to trade the instruments and volumes that are appropriate to your own situation.