Wind from the_black_hole_accretion_disk_driving_a_molecular_outflow_in_an_act...Sérgio Sacani
Similar to The Upper Neogene and Quaternary δ18O Chronology and a Discussion of Possible Orbital Forcing Mechanisms and their Influence on Climate (20)
Justdial Call Girls In Indirapuram, Ghaziabad, 8800357707 Escorts Service
The Upper Neogene and Quaternary δ18O Chronology and a Discussion of Possible Orbital Forcing Mechanisms and their Influence on Climate
1. Department of Earth Sciences, University of Durham J. D. Edwards
yHz – Unit of frequency, y = 3.17x10⁻¹⁴ 1
The Upper Neogene and Quaternary δ18O Chronology and a Discussion of
Possible Orbital Forcing Mechanisms and their Influence on Climate.
J.D. Edwards1
1
Department of Earth Sciences, Durham University, Elvet Hill, Durham, DH1 3LE
Contact: jon.edwards95@icloud.com
Abstract
A benthic foraminifera δ18O time series was analyzed during the Upper
Neogene and Quaternary with REDFIT and wavelet spectral analysis. REDFIT
analysis identified three cyclicities that correlated with obliquity, eccentricity,
and processional Milankovitch wavelengths with obliquity (41Ka) being the
most dominant. Wavelet analysis showed a temporal shift from an obliquity
(41Ka) dominant cyclic system to an eccentricity (100Ka) dominant cyclic
system approximately 1.6Ma before present. Additional data is needed to
further understand this temporal shift.
1.0 Introduction
Oxygen isotope ratios O18/O16 (later δ18O)
provide a useful climate proxy for
temperature and ice volume and are used
extensively for analysing palaeoclimate
(e.g. Takalo, n.d.). Foraminifera are
analysed for this purpose due to their
aragonitic test which have a composition
that passively reflects the δ18O of the
surrounding sea water (Winograd et al.,
1997). To study ice volume independent of
temperature, benthonic foraminifera were
chosen as these organisms live at sufficient
depth for temperature changes to be
insignificant. Ice volume and temperature
have not been constant throughout the
upper Neogene and Quaternary (e.g. Miller,
2005). It is therefore important to
understand the mechanisms behind any
changes to gain a deeper understanding of
the future of the planet’s climate.
Milankovitch, 1941 was one of the first to
hypothesize that three orbital cycles;
eccentricity, obliquity, and precession,
could impact the earth’s climate through
orbital forcing. This paper aims to study the
extent orbital forcing has affected global ice
volume since the upper Neogene, and if so,
which cycles are most dominant.
2.0 Methodology
Paleontological Statistics Software
Package (PAST) and Microsoft Excel were
used to analyse the δ18O dataset. The data
was first plotted against time as a scatter
graph to study the broad trends (figure 1).
The data was then detrended in preparation
for REDFIT spectral analysis. The REDFIT
analysis was applied to both the δ18O data,
as well as idealised Milankovitch
eccentricity, obliquity and precession data.
To prevent low frequency, high uncertainty
artefacts in the data affecting the
interpretation, a 99% Chi2 significance
curve was plotted to the generated REDFIT
figures to identify peaks of statistical
significance (figure 2). Wavelet spectral
analysis was then conducted on the dataset
in concordance with the methodology
outlined in Takalo (n.d.). Orbital data was
also processed using this methodology to
try to recognise cyclicity identified by
REDFIT analysis. A cone of influenced was
added to wavelet scalograms to identify
areas where edge effects have become
significant.
3.0 Results and Discussion
Initial observations (figure 1) has identified
three periodicities of cyclicity of the δ18O
time series of ~0.1Ma, ~1Ma and >6Ma. It
must be noted however, that the low
frequency component has a high
2. Department of Earth Sciences, University of Durham J. D. Edwards
yHz – Unit of frequency, y = 3.17x10⁻¹⁴
2
uncertainty as less than one period is
represented in the dataset. Figure 1 also
shows an overall increase in δ18O over the
past 6Ma which is synonymous with an
increase in continental ice volume. Low
frequency fluctuations are likely
representing glacial and interglacial periods
such as the last glacial maximum (LGM)
26.5Ka before present (Winograd et al.,
1997). The low frequency overall trend is
hypothesized to represent an accumulation
and overall growth of the polar ice sheets
during the Quaternary.
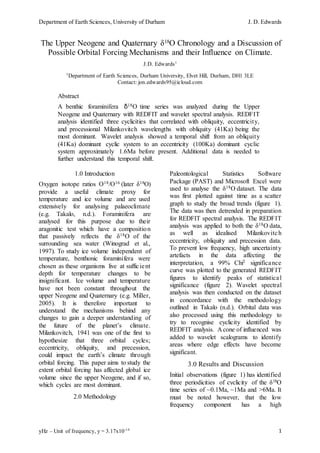
3.1 REDFIT Analysis
REDFIT spectral analysis mathematically
shows that the dominant frequency present
in the benthonic δ18O dataset is ~25yHz
(~41Ka periodicity). This is correlated with
the obliquity trace that has a near identical
dominant frequency. As well as this
however, the δ18O dataset shows other
minor peaks that are statistically significant
to 99% Chi2. A series of minor peaks
between 42yHz and 46yHz, and 52yHz and
54yHz are present which matches that of
the precession trace (~26Ka periodicity).
Finally, a very small peak that only just
breaches the 99% Chi2 line is present at
~10yHz (~100Ka periodicity). This can be
attributed to the eccentricity trace that has a
peak at a similar frequency. This data
shows that orbital forcing is likely a
dominant mechanism in the driving of δ18O
cyclicity, as prevailing frequencies of the
time series can be correlated with
Milankovitch frequencies. Obliquity is the
most prominent mechanism, however, both
eccentricity and precession have also
influenced the record to a minor degree.
3.2 Wavelet Analysis
Wavelet spectral analysis further provides
evidence for orbital forcing on the δ18O
record, however also shows a temporal shift
from obliquity to eccentricity at
approximately 1.2Ma before present, in
being the dominant orbital force on
palaeoclimate. This is because the δ18O
time series shows a clear cyclicity of
~100kYears which becomes more
ambiguous with foraminifera samples older
than 1.2Ma. This ~100kYears pattern is
also present in the eccentricity scalogram,
allowing it to be identified as an
eccentricity driven cycle. For older than
1.6Ma, it is assumed that obliquity is the
dominant cyclic mechanism as identified
by REDFIT analysis. This temporal shift
recognised by this analysis was also
highlighted in the literature (e.g. Takalo
n.d.) and it is suggested that additional ice
core drilling in Antarctica needs to be done
before the reason for this occurrence can be
fully understood. The main issue with this
analysis is that the pattern that seems to be
apparent at low frequencies may not be
genuine due to the high uncertainty. For
example, the prominent signal (<6yHz) in
the δ18O data is unlikely to be cyclic as very
few cycles need to be represented by the
data for this time series. Nevertheless, there
is some structure to this signal indicating
that with a longer time series it may be
possible to identify such low frequency
cycles.
4.0 Conclusion
The analysis presented here has clearly
identified a correlation between
Milankovitch orbital forcing with terrestrial
ice volume. Between 6Ma and 1.2Ma,
cyclicity of a wavelength similar to
obliquity (41Ka) is most dominant in the
δ18O record, however both eccentricity
(100Ka) and precession (26Ka) have a
minor influence. Since 1.2Ma however, it
appears that eccentricity has become more
dominant though additional research is
needed to explain this shift.
5.0 References
Milankovitch, M. (1941). Kanon der Erdebestrahlung und seine Anwendung auf das Eiszeitenproblem. Königlich
Serbische Akademie.
Miller, K. (2005). The Phanerozoic Record of Global Sea-Level Change. Science, 310(5752), pp.1293-1298.
Takalo, J. (n.d.). Wavelet analysis of benthic O18/O16 time series during Quaternary: Evidence for
3. Department of Earth Sciences, University of Durham J. D. Edwards
yHz – Unit of frequency, y = 3.17x10⁻¹⁴
3
both obliquity and eccentricity driven paleoclimate. [online] Available at:
https://www.researchgate.net/publication/279884211_Wavelet_analysis_of_benthic_O18O16_time_ser
ies_during_Quaternary_Evidence_for_both_obliquity_and_eccentricity_driven_paleoclimate
[Accessed 1 Feb. 2016].
Winograd, I., Landwehr, J., Ludwig, K., Coplen, T. and Riggs, A. (1997). Duration and Structure of the Past
Four Interglaciations. Quaternary Research, 48(2), pp.141-154.
Appendix – Figures
Obliquity
Precession
δ18
O Data
Eccentricit
y
Frequency x 3.17x10⁻¹⁴
Hz
Power
Figure 2 - REDFIT Spectral Analysis
Figure 3 - Wavelet Spectral Analysis
Eccentricity
δ18
O Data
95kYears
95kYears
Sample Noise?
Figure 1 - δ18O Time Series
1Ma Periodicity, 0.25‰ δ18
O Amplitude
0.1Ma Periodicity, 0.75‰ δ18
O Amplitude
>6Ma Periodicity, 1‰δ18
O Amplitude
Age (Ka)
log2(Age)