SlideShare a Scribd company logo
1 of 108
From Correctional Education to School
Reentry: How Formerly Incarcerated Youth
Can Achieve Better Educational Outcomes
Sonia Pace*
I.
Introduction............................................................................
128
II. Youth at Re e n t r y
.................................................................. 128
III. Relevant Federal Po l ic ie
s.................................................. 130
IV. Correctional Education......................................................
131
V . Education Reentry Transition Services and Programs .133
VI. Obstacles to School Re e n t r y
.............................................135
VII. Alternative Schools Offer an “Easy Out” .................... 138
VIII.
Recommendations.................................................................1
39
1. Implement individualized, long-term educational planning
from intake to discharge...................................................139
2. Encourage greater collaboration between state education
agencies, local school districts, and juvenile justice
facilities.............................................................................13
9
3. Align correctional education curricula and standards with
local school districts......................................................... 140
4. Increase tracking and evaluation of academic outcomes. . 140
5. Place more social workers in public schools to support youth
in transition.......................................................................
141
6. Mandate that schools accept formerly incarcerated
students.............................................................................
141
7. Increase investment in and funding for correctional
education and reentry programs............................... ........ 142
8. Implement best practices in the continuum of educational
128 Texas Journal on Civil Liberties & Civil Rights [Vol. 23:2
services..............................................................................
143
Conclusion..............................................................................
..........143
I. Introduction
Though education may be essential to reducing the risk of
recidivism, research shows that many formerly incarcerated
youth still
experience dismal educational outcomes.* 1 Each year,
approximately
100,000 youths are discharged from juvenile justice facilities
and return
to their communities2 to face a myriad of challenges, including
difficulties with high school reentry3 and diploma attainment.4
Many
released juveniles do not return to school.5 By contrast, eighty-
eight
percent of the general U.S. population graduates from high
school or has
a GED.6 These outcomes suggest an ineffective continuum of
correctional education and school-reentry processes. This Note
seeks to
identify how correctional education, school-reentry processes,
and
education-transition programs contribute to the educational
outcomes of
formerly incarcerated youth. This Note also provides
recommendations
on how stakeholders can achieve better educational outcomes
for youths
who have been in correctional settings.
E. Youth at Reentry
Formerly incarcerated youths are more likely to experience
distinct
personal and academic challenges at reentry. They are more
likely have
been involved in child welfare systems, as well as being
relatively more
likely to be a racial minority or male.7 They are more likely to
have
*Sonia Pace, M .P.A ff, The LBJ School of Public Affairs at
The University of Texas at Austin,
2018; B .A ., University o f W isconsin-M adison, 2010. The
author would like to thank Professor
Michele Deitch for her guidance.
1 Jennifer Lowman & Shari A. Mamas, Educ. L. Ctr. - PA,
Educational Aftercare
& Reintegration Toolkit for Juvenile Justice Professionals 15
(2009).
2 Ashley Nellis & Richard Hooks Wayman, Youth Reentry Task
Force of the Juv.
Just, and Delinq. Prevention Coalition, Back on Track:
Supporting Youth G entry
from Out-of-Home Placement to the Community 5 (2009).
3 Infra Part II.
4 Infra Part IV.
5 Nat’l Conf. of State Legis., Reentry & Aftercare: Juvenile
Justice Guide for
Legislators 4 (2011).
6 Camille L. Ryan & Kurt Bauman, U.S. Census Bureau,
Educational Attainment in
the United States: 2015 1 (2016).
7 See Peter Leone & L ois Weinberg, Ctr. for Juv. Just. Reform,
Addressing the
Unmet Educational Needs of Children and Youth in the Juvenile
Justice and Child
Welfare Systems 6-7 (2012) ( “Over the course of a year, almost
800,000 abused or neglected
2018] From Correctional Education to School Reentry 129
experienced trauma and neglect before incarceration, and to
have
significant need for mental health services and substance abuse
treatment.8 They are also more likely to experience poverty and
to have
financial responsibilities,9 with one in eleven reporting having
children
of their own.10
Formerly incarcerated youths also face academic challenges.
Twenty-three percent of incarcerated youth have learning
disabilities,
though experts suspect the actual figure may be higher.* 11
These youths
are likely to be behind in literacy and schooling when they enter
the
juvenile justice system; an estimated seventy-five percent of the
150,000
youth in detention in 2009 were high school dropouts, and many
were
not fully literate.12 Correctional education often does not get
students up
to speed, in part because it may lack sufficient services for
special
education, English Language Learner (ELL) programs, and
remedial
education.13 Furthermore, incarceration during youth—a crucial
point of
intellectual development—has a fundamentally disruptive effect
on
education attainment.14
All of these factors place formerly incarcerated youth reentering
their communities at a high risk of recidivism; over half are re-
incarcerated within three years of release.15 In 2015, Former
Attorney
General Loretta Lynch said of the challenges facing formerly
incarcerated people: “[T]oo often, justice-involved individuals
who have
paid their debt to society confront daunting obstacles to good
jobs, decent
housing, adequate health care, [and] quality education.”16 To
successfully
children in the United States are in the foster care system. . . .
[S]tatistics show that 19.5 Black
children per 1,000 [Black children] are in foster care compared
to 16.5 American Indian and Alaskan
Native children, 16.1 Pacific Islander children, 10.8 White
children, and 10.7 Hispanic
children. . . . [And d]ata suggest that girls are less likely to be
detained and committed than boys
for most categories of delinquent offenses[.]”).
8 U.S. De p’ts of Educ. & Just., Guiding Principles for
Providing High-Quality
Education in Juvenile Justice Secure Care Settings 1 (2014)
(discussing trauma and
neglect); Re-entry: Reform Trends, Juv. JUST. Info.
Exchange, http://jjie.org/hub/reentry/reform-trends/
[https://perma.cc/5Y3R-M7PZ] (“Over half
the youth in the justice system have been found to suffer from
mental health or substance use
disorders.”).
9 Nat’l Ct r. for Juv. Just. & U.S. Dep’t of Educ. Of f . of Juv.
Just, and Delinq.
Prevention, Juvenile Offenders and Victims: 2014 National
Report 7 (Melissa Sickmund
& Charles Puzzanchera eds., 2014).
10 Nat’l Conf. of State Legis. , supra note 5, at 4.
11 See U.S. Dep’t of Educ., Protecting the Civil Rights of
Students in the Juvenile
Justice System 3 (2016) (noting that students with disabilities
represent 12% “of all students in
public high schools served by the Individuals with Disabilities
Education Act (IDEA)”).
12 Ed Risler & Tom O’Rourke, Thinking Exit at Entry:
Exploring Outcomes o f Georgia’s
Juvenile Justice Educational Programs, 60 J. Correctional Edu
c. 225, 225-29 (2009).
13 See, e.g., U.S. Dep’t of Educ., supra note 11 (highlighting
national issues in providing
services to youths in correction and spotlighting San Ber nardino
County).
14 See Amber Fern & Jill Adams, Ct r . for Juv. Just. Reform,
Education and
Interagency Collaboration: A Lifeline for Justice-Involved
Youth 5 (2016) (“Juvenile
justice involvement, such as attending court hearings during
school hours, can disrupt students’
school experience.”).
15 David M. Altschuler et a l., The Urban Inst., The
Sustainability of Juvenile
Programs beyond Second Chance Act F unding: The Case of
Two Grantees 1 (2016).
16 Department o f Justice to Launch Inaugural National
Reentry Week, U.S. De p’t of Just. (Apr.
130 Texas Journal on Civil Liberties & Civil Rights [Vol. 23:2
divert from this pipeline, youth need the necessary knowledge
and skills
to secure employment, which will help them to reintegrate into
their
communities.17
Beyond the devastating effects of insufficient education
experienced
by formerly incarcerated youth, communities may face negative
fiscal
impact from low rates of high school graduation. A 2009 study
by the
Center for Labor Market Studies at Northeastern University
found that
each high school dropout costs taxpayers over $292,000 in lost
tax
revenues, incarceration costs, and social services.18 Investing
in better
correctional and reentry education is thus sound fiscal policy
that may
yield long-term savings. Indeed, in a 2014 joint letter to state
education
officials, the Attorney General and Secretary of Education
encouraged
states to prudently allocate taxpayer dollars to improve
correctional
education and expand access to vocational education to help
improve
educational outcomes for justice-involved youth.19
in. Relevant Federal Policies
There is no federal policy on school reentry regarding formerly
incarcerated youth. Youth over the age of sixteen are not always
required
by state law to return to school.20 The Juvenile Justice and
Delinquency
Prevention Act of 1974 does not explicitly address the
educational needs
of students exiting the juvenile justice system.21
Other laws based on different federal policies may apply to
students
in or exiting the juvenile justice system. The McKinney-Vento
Homeless
Assistance Act of 1987 provides educational guarantees for any
homeless
youth.22 The protections of the Individuals with Disabilities
Education
Act of 1990 (IDEA) guarantee all youth with special needs a
“free and
22, 2016), https://www.justice.gov/opa/pr/department-justice-
launch-inaugural-national-reentry-
week [https://perma.cc/B9KC-BA89].
17 See id. (discussing formerly incarcerated persons generally).
18 Andrew Sum et a l., Ctr. for Labor Mkt. Studs., The
Consequences of Dropping
Out of High School 16 (2009).
19 Policy Letter, U.S. DEP’TS OF Educ. & JUST. (Dec. 8,
2014),
https://www2.ed.gov/policy/elsec/guid/secletter/141208.html
[https://perma.cc/T5BS-CAWX].
20 Compulsory school attendance laws, minimum and maximum
age limits for required free
education, by state: 2017, Nat’l Ctr. for Educ. Stats. (2015),
https://nces.ed.gov/programs/statereform/tab5 l.asp
[https://perma.cc/6LA9-KB47] (indicating
some states do not require students to attend schools past age
sixteen).
21 Re-entry: Reform Trends, supra note 8 (discussing the
Juvenile Justice and Delinquency
Prevention Act of 1974, Pub. L. No. 93-415, 88 Stat. 1109, and
noting that “[w]hile JJDPA funds
may be used by states for re-entry services, few states use it for
that purpose because they need to
direct the limited federal dollars available to comply with the
core requirements”); Campaign for
Youth Justice, Youth in the Adult System Fact Sheet 2 (2014)
(“Although the federal
Juvenile Justice and Delinquency Prevention Act (JJDPA)
requires that youth in the juvenile justice
system be removed from adult jails or be sight-and-sound
separated from other adults, these
protections do not apply to youth prosecuted in the adult
criminal justice system.”).
22 Leone & Weinberg, supra note 7, at 23 (discussing the
McKinney-Vento Homeless
Assistance Act of 1987, Pub. L. 100-77, 101 Stat. 482).
2018] From Correctional Education to School Reentry 131
appropriate public education,”23 and require adult transition
planning for
youth with disabilities beginning at age fourteen.24 The No
Child Left
Behind Act of 2001 established standards for education that
apply to the
education received in the juvenile justice system.25 The Every
Student
Succeeds Act of 2015, which replaced the No Child Left Behind
Act,26
requires states to ensure certain protections for students in or
exiting the
juvenile justice system.27
IV. Correctional Education
Though juvenile justice facilities are legally required to educate
youth in placement under age seventeen,28 the quality of
correctional
education may differ between jurisdictions. The oversight
bodies for
correctional education, for example, vary by state: in forty-one
states,
juvenile justice staff, public education agencies, and private
education
providers together oversee correctional education; in six states,
juvenile
justice staff solely oversee it; in three states, public education
agencies
solely oversee it.29 Education providers also vary by state and
facility.
Teachers from local school districts in some cases may deliver
correctional education.30 In other cases, private contractors,
education-
department staff, or juvenile justice staff deliver it.31 Private
providers
frequently execute Memoranda of Understanding with state
education
departments to provide particular and limited services.32 Given
the
variations in delivery and oversight, the quality of correctional
education
likely varies by jurisdiction and site, and in some cases this
variation may
23 Lauri Goldkind, A Leadership Opportunity for School Social
Workers: Bridging the Gaps in
School Reentry for Juvenile Justice System Youths, 33 Child. &
Schs. 229, 232 (2011) (discussing
the Individuals with Disabilities Education Act, Pub. L. 101-
476, 104 Stat. 1142 (1990)).
24 Healther M. Boltadano, et al., Transition o f Incarcerated
Youth with Disabilities Across
Systems and Into Adulthood, 13 Exceptionality 103, 104 (2005).
25 See, e.g., No Child Left Behind Act of 2001 § 1414(c)(19),
Pub. L. No. 107-110, 115 Stat.
1425 (2002) (codified as amended at 20 U.S.C. § 6434 (2012))
(“ [T]he program under this subpart
will be coordinated with any programs operated under the
Juvenile Justice and Delinquency
Prevention Act of 1974 (42 U.S.C. § 5601 et seq.) or other
comparable programs, if
applicable.”).
26 See, e.g., Jason P. Nance, Students, Police, and the School -
to-Prison Pipeline, 93 WASH. U.
L. Rev. 919, 940 n. 103 (2016) (noting replacement).
27 Every Student Succeeds Act § 1401(4)(A)(ii), Pub. L. No.
114-95, 129 Stat. 1802 (2015)
(codified as amended at 20 U.S.C. § 6435) (noting the purpose
of this part of the law is to “prevent
at-risk youth from dropping out of school, and to provide
dropouts, and children and youth
returning from correctional facilities or institutions for
neglected or delinquent children and youth,
with a support system to ensure their continued education and
the involvement of their families
and communities”).
28 Lowman & Mamas, supra note 1, at 15.
29 Council of State Gov’ts Just. Ct r., Locked Ou t: Improving
Educational and
Vocational Outcomes for Incarcerated Youth 2 (2015).
30 Id.
31 Id.
32 Thomas G. Blomberg et a l., Fla. State U. Ct r. for Crim. and
Pub. Pol’y Re s. The
Juvenile Justice No Child Left Behind Collaboration Project 61
(2008).
132 Texas Journal on Civil Liberties & Civil Rights [Vol. 23:2
keep youth from closing the gap in their educational
achievement relative
to their peers.
While correctional education curricula and standards might be
most
effective if aligned with state academic standards,33 this may
not always
be the case. Students frequently do not earn credit transferrable
to public
schools for courses completed in detention.34 Correctional
education
programs also offer fewer math and science courses than public
secondary schools.35 Academic standards in correctional
education may
fall short because of the many challenges teachers face in
shaping a
curriculum for students with different situations and educational
needs:
students have different lengths of sentences; students may
transfer
detention facilities abruptly due to lack of space;36 many
students need
remedial and special education;37 and, due to limited staffing,
students
across grade levels and languages often share a classroom.38
Students in juvenile detention are also disadvantaged by lower
attendance by and less interaction with their teachers. While
technologies
such as computer exercises are meant only to enhance
correctional
education,39 they may sometimes detrimentally replace in-
person teacher
instruction.40 In addition, a report by the Department of
Justice’s Civil
Rights Division found that correctional teachers are eight
percent more
likely to be absent from the classroom for over ten days than
teachers in
public high schools.41 Students may also face disciplinary
measures that
interfere with class attendance; for example, youth offenders
with
disabilities sued Contra Costa County Juvenile Hall in
California for
frequent use of solitary confinement that resulted in “miss[ing]
hundreds
of hours of education combined,” violating protections of
IDEA.42
33 Paul Hirschfield, E ffective and Promising Practices in
Transitional Planning and School
Reentry, 65 J. CORRECTIONAL EDUC. 84, 87 (2014).
34 Id.
35 U.S. D e p ’t o f Ed u c ., supra note 11, at 1.
36 Blom berg et a l . , supra note 32, at 56.
37 C ouncil of Sta te Go v ’ts J u st. Ct r . , supra note 29, at 1
(“At least one in three incarcerated
youth is identified as needing or already receiving special
education services—a rate nearly four
times higher than youth attending school in the community.”).
38 U.S. D e p ’ts o f Ed u c . & Ju s t ., supra note 8, at 3 (
“Secure care facilities typically do not
have the capacity to provide a ‘traditional’ school setting with
individual grade-level classrooms and
core subject teachers. Instead, education staff often must
provide instruction to students at a variety
o f ages and academic levels in one room at the same tim e.”).
39 M ichelle Tolbert, U.S. De p ’t o f Ed u c ., A Reentry
Education Mo d e l: Supporting
Education and C areer Advancem ent for Low-Skill Individuals
in Corrections 6 (2010).
40 Blom berg et a l ., supra note 32, at 51 (“ [0]ne state reported
that the result of using the
internet to address highly qualified teacher needs has been
mixed. Although online classes have
allowed each program to address its individual highly qualified
teacher needs, one state found that
the online instruction has not been as effective as in-person
classroom instruction. Specifically,
engaging students is more difficult in a virtual classroom .”);
U.S. D e p ’ts o f Ed u c . & Ju s t ., supra
note 8, at 4 ( “ [Tjechnology should not be used as a substitute
for teachers and classroom instruction
in a secure setting any more than it would replace classroom
teaching and engagement in a regular
educational setting.”).
41 5 e e U .S . De p ’t of Ed u c ., supra note 11, at 1 (“While
27% o f teachers nationally are absent
more than 10 school days per year for reasons unrelated to
school activities, 35% of teachers at
justice facilities are absent more than 10 days per year.”).
42 Sarah Cate, The Politics of Prison Reform: Juvenile Justice
Policy in Texas, California, and
2018] From Correctional Education to School Reentry 133
Data on student performance and educational outcomes while in
correctional education programs is sparse and incomplete. One
source of
data stems from a mandate from the No Child Left Behind
Act,43 which
required states to report standardized test scores for youth who
have been
in custody for one academic year,44 but excludes the test scores
of many
other students.45 As of 2006, only thirty of forty-three states
surveyed by
the Center for Criminology and Policy Research had
implemented the
formal evaluations of their correctional education programs as
required
by the Act.46 Another source of data comes from efforts by
some states
to track attainment of transferable credits, high school
diplomas, and
GEDs by incarcerated youth in correctional education:47 as of
2015,
twenty-seven states tracked attainment of transferrable post-
secondary
credits; forty-six tracked high school diploma attainment; and
eighteen
tracked attainment of post-secondary degrees.48
V . Education Reentry Transition Services a nd
Programs
Some states provide transition services to support youth
reentering
their communities. Research shows that engagement is the most
important factor for youth during the transition process, and
that the type
of reentry program—educational, vocational, or community-
oriented—is
less important to diversion from recidivism than engagement.49
One of
the earliest developed and most commonly used models for
reentry
programs is the Intensive Aftercare Program (IAP), developed
in 1994
by researchers David Altschuler and Troy Armstrong.50 IAP
includes
reentry services commonly considered best practices today, such
as
continuity of care, family involvement, and cultural
competency.51
Evaluations of IAP, however, still show relatively high
recidivism rates
for participating youth that are equivalent to rates of the control
group.52
Pennsylvania 139 (Jan. 1, 2016) (Ph.D. dissertation, University
of Pennsylvania),
https://repository.upenn.edu/cgi/viewcontent.cgi?article=3425&
context=edissertations.
43 No Child Left Behind Act of 2001, Pub. L. No. 107-110, 115
Stat. 1425 (2002).
44 Peter Leone & Candace Cutting, Appropriate Educations,
Juvenile Corrections, and No Child
L eft Behind, 29 Behavioral Disorders 260, 263 (2004).
45 Id.
46 BLOMBERG ET al. , supra note 32, at 17, 43.
47 Locked Out, supra 29, a l l .
48 Id.
49 William H. Barton & G. Roger Jarjoura, Applying a
Developmental Lens to Juvenile Reentry
and Reintegration, 1 J. of Juv. Just. 95, 97-98 (2012).
50 Id. at 95.
51 See, e.g., Re-entry: Reform Trends, supra note 8 (“The IAP
model focused on ‘the
identification, preparation, transition, and re-entry of ‘high-
risk’ juvenile offenders from secure
confinement back into the community in a gradual, highly
structured, and closely monitored
fashion. ’ This model was one of the first to acknowledge that
effective aftercare planning must begin
from the moment a young person enters a correctional
facility.”).
52 Barton & Jarjoura, supra note 49, at 95-96.
134 Texas Journal on Civil Liberties & Civil Rights [Vol. 23:2
To work toward better educational outcomes, states must
commit
sufficient resources to reentry planning. Texas is among the
states that
appear to have invested significantly in such planning. The
Texas
Juvenile Justice Department’s (TJJD) education goal is to
“provide each
youth quality academic and vocational experiences in order to
better
equip them for a successful reentry into community life.”53
TJJD begins
reentry planning at the moment of intake by creating the plan by
doing
“a comprehensive and accurate assessment,” and continues these
assessments “at regular intervals during the youth’s time in”
custody.54
TJJD also employs Education Reentry Liaisons and Workforce
Development Re-entry Specialists in both its facilities and
parole offices
to assist with navigating the school reentry process, preparing
for GED
exams, finding vocational training opportunities, and otherwise
achieving
a post-secondary education.55 Texas has also pursued additional
programs
in the past, such as the now-discontinued Gang Intervention
Treatment:
Reentry Development for Youth (GitRedy) initiative in Houston
that had
some success in developing strategies for reentry services.56
A state may also use federal funding for its youth reentry
services,
though availability of such funding is limited. The Department
of Labor
formerly offered some funding through Youth Opportunity
Grants as part
of the Workforce Investment Act of 1998.57 The thirty-six
grants under
this program ranged in amount between $3.1 and $43.8 million
and
served more than 90,000 youths aged fourteen to twenty-one in
high-
poverty communities.58 In 2007, the Second Chance Act59
provided the
Department of Justice with $53 million to fund state and local
reentry
programs and the evaluation of correctional education, meant to
reduce
recidivism among youth and adults.60
The federal government recently issued voluntary guidelines
meant
to help states decrease the school dropout rate and improve
reentry
transitions. In 2012, the Department of Education issued a
Reentry
Education model as an evidence-based approach to aligning
correctional
and educational services.61 The model recommends staff
training, data
53 TJJD Strategic Plan 2015-2019, Tex. Juv. Just. De p’t (Apr.
11, 2017),
https://www.tjjd.texas.gov/programs/education.aspx
[https://perma.cc/67KB-EJVS] .
54 Tex. Juv. Just. Dep’t , Comprehensive Report: Youth
Reentry and Reintegration 7
(2012).
55 TJJD Strategic Plan, supra note 53, at 52.
56 Altschuler et a l., supra note 15, at 5 (“Since the end of the
Second Chance Act grant in
September 2014, GitRedy has not continued funding the staff
positions of project reentry specialist
and gang intervention specialist, and as such the program has
been formally terminated. ”).
57 Linda Harris, Ctr. for L. and Soc. Pol’y , Learning from the
Youth Opportunity
Experience 3 (2006); see also Workforce Investment Act of
1998 § 169, Pub. L. 105-220, 112
Stat. 936 (codified at 29 U.S.C. § 2811) (section entitled
“Youth Opportunity Grants”).
58 Harris, supra note 57 at 3-4.
59 Second Chance Act of 2007, H.R. 1593, 110th Cong. (2008).
60 Attorney General Loretta E. Lynch Delivers Remarks at
Second Chance A ct - Justice and
Mental Health Collaboration Program National Conference,
U.S. Dep’t of Just. (Dec. 16, 2015),
https://www.justice.gov/opa/speech/attorney-general-loretta-e-
lynch-delivers-remarks-second-
chance-act-justice-and-mental [https://perma.cc/CF29-G7JU].
61 Michelle Tolbert & Laura Rasmussen Foster, U.S. De p’t of
Educ., Reentry
2018] From Correctional Education to School Reentry 135
tracking of long-term student outcomes, and formal evaluation
of
correctional education.62 The model’s stated goal is “long-term
employment in living-wage occupation without recidivating.”63
State divisions may also directly collaborate on improving
reentry
services. The Family Court and the Department of Human
Services in
Philadelphia, for example, led a 2005 reintegration initiative to
improve
correctional education and reentry processes.64 Not long before
the
improvements, as little as ten percent of youth placed in the
Philadelphia
juvenile justice system graduated from Philadelphia public
schools.65 As
a result of the collaboration, the city established a
“streamlined” record
transferal process, created a dual-credit program with a local
community
college, accelerated high schools for older youth, and evening
programs
for students with daytime jobs.66 By 2008, thirty-one percent of
the youth
released from placement received a high school diploma, GED,
or both.67
VI. Obstacles to School Reentry
Certain state laws can hinder or disincentivize reenrollment.
The
maximum age until which free public education is guaranteed,
for
example, is lower in some states than others; as of 2015, the
maximum
age was seventeen in one state, nineteen in two states, twenty in
nine
states, and twenty-one or older in thirty-one states.68 See
Figure 1. The
age until which school attendance is compulsory is higher in
some states
than others; as of 2015, this age was sixteen in fifteen states,
seventeen
in eleven states, and eighteen in twenty-four states.69 See
Figure 2.
Education Framework: Guidelines for Providing High-Quality
Education for Adults
Involved in the Criminal Justice System 6 (2016).
62 Tolbert, supra note 39, at 5.
63 Tolbert, supra note 61, at 5.
64 Robert G. Schwartz, Juv. L. Ct r., Pennsylvania and
MacArthur’s Models for
Change: The Story of a Successful Public-P rivate Partnership
18 (2013); Patrick
Griffin & Mary Hunninen, Nat’l Ct r. for Juv. Just. ,
Pennsylvania Progress: Preparing
Youth for Productive Futures 2 (2008).
65 Griffen & HUNNINEN, supra note 64, at 3 (noting that a
study between 2000 and 2005 found
that “in one cohort analyzed, 90% of those with a juvenile
justice placement never graduate from
the Philadelphia School system, [with] some of them
compietfing] school in placement [but with]
the vast majority simply dropping] out”).
66 Id. at 3, 6.
67 Re-entry: R eform Trends, supra note 8.
68 Compulsory school attendance law s, supra note 20 (noting
that Texas has the highest age until
which free education is offered, at twenty-six).
69 Id.
136 Texas Journal on Civil Liberties & Civil Rights [Vol. 23:2
10
9
8
7
6
5
4
3
2
1
0
Age Until Which Free Public Education is
Guaranteed by Number of States, 2015
Figure 1
Age Until Which School Attendance is
Compulsory by Number of States, 2015
16 17 18
Figure 2
Administrative practices within local school districts may also
be
complicated. Some local school districts do not always grant
students
course credit for correctional education.70 More difficult record
transfer
procedures, in place partly due to the privacy protections of
student
70 Hirschfield, supra note 33, at 87.
2018] From Correctional Education to School Reentry 137
records under the Family Educational Rights and Privacy Act of
1974,71
can create unintended complications. Long and complex
registration
procedures can result in postponement of reenrollment until the
start of
the next school semester.72 Certain documentation
requirements, such as
proof of age, residence, and immunizations, can pose barriers to
reenrollment.73 These difficulties and delays can have a
dramatic effect
on the likelihood that released youths will return to school.
Public school districts may also be reluctant to accept formerly
incarcerated youth.74 These schools perhaps fear that accepting
formerly
incarcerated youth will negatively affect standardized test score
averages,
graduation rates, and school attendance rates. These kinds of
concerns
may be some of the major issues today in policy discussions
around
school reentry.
Public school districts may also be concerned about the safety
implications of enrolling formerly incarcerated youth,75 despite
the fact
that the majority of the released youth committed only
nonviolent
offenses.76 Some school districts will narrowly elect to not
reenroll youth
convicted of a sex offense.77 More broadly, other school
districts may
not enroll students who have been expelled for any reason from
a school
within the system.78
These obstacles to school reentry, combined with conditions of
release, can push youth into alternatives. Regular school
attendance may
perhaps be a condition of probation, the violation of which can
quickly
result in re-incarceration. Such a condition may have the effect
of pushing
youth who cannot enroll in public schools into alternate
education,
discussed infra, and GED programs.79
Released youth, once enrolled, may also lack the means or
incentives to stay in school or remain engaged in work. A
longitudinal
study in Oregon by the Transition Research on Adjudicated
Youth in
Community Settings (TRACS) project, for example, found a
significant
drop in continuing enrollment or work engagement shortly after
release;
findings indicated that at six months after release, forty-seven
percent of
71 Leone & Weinberg, supra note 7, at 22 (discussing the
Family Educational Rights and
Privacy Act of 1974, Pub. L. No. 93-380, 88 Stat. 5).
72 Id. at 25.
73 Lowman & Mamas, supra note 1, at 26.
74 See infra Part VII.
75 5e,e, e.g., Michael Bullisetal., L ife o n th e “O uts”—
Examination o f the Facility-to-Community
Transition o f Incarcerated Youth, 69 Exceptional Child. 7,19
(2016) (noting that “there is reason
to incarcerate youth who commit certain crimes for the reason
of public safety”).
76 NELLIS & Wayman, supra note 2, at 13 (“Nearly two-thirds
of juveniles in out-of-home
placements are held for nonviolent offenses.”).
77 Ashley Nellis, A ddressing the Collateral Consequences o f
Convictions for Young Offenders,
The Champion, 24 July/August 2011, at 24.
78 Juv. L. Ct r., Justice for Juveniles: Youth Recommendations
to Improve
Educational Outcomes for Youth in the Juvenile Justice System
11 (2015) (discussing
zero tolerance policies).
79 Lowman & Mamas, supra note 1, at 21.
138 Texas Journal on Civil Liberties & Civil Rights [Vol. 23:2
the 531 youth participants were engaged in school or work, but
at one
year after release, only thirty-one percent of the participants
remained
engaged.80 The study also found that participants with learning
disabilities
experienced worse educational and employment outcomes.81
VII. Alternative Schools Offer an “Easy Ou t ”
Some school districts may recommend released youth enroll in
or transfer to alternative schools. According to a 2008 survey by
the
Department of Education, forty-two percent of public school
districts
administered alternative schools and programs meant for
students
previously arrested or involved in the juvenile justice system.82
Some
states have no protections limiting the ability of school districts
to refuse
to enroll previously incarcerated youth in their main school
systems.83
Other states may only have certain procedural protections.
Alternative schools and programs are controversial. Some
commentators celebrate the success of prominent programs such
as the
Maya Angelou Public Charter Schools in Washington, D .C .84
Others
question if alternative school programs consistently provide
sufficient
educational quality.85 On this point, a former director of the
Maya
Angelou Charter Schools said, “If you want to see really
dysfunctional
schools, just go visit the designated alternative schools in any
city around
the country. These schools are just dumping grounds where
schools
throw kids they don’t want to deal with. . . . [Their] presence
just gives
everybody an easy o u t.”86
80 Bullis et al., supra note 75, at 7 (summarizing the Transition
Research on Adjudicated Youth
in Community Settings (TRACS) project, a longitudinal study
published in 2002 that tracked 531
youth released from juvenile justice facilities in Oregon over
five years and sought to identify factors
that contributed to success upon community reentry).
81 S e e id. at 18 (“[It] is clear that participants with special
education disabilities fared worse than
their peers without disabilities.”).
82 Priscilla R. Carver et al., Nat’l Ct r. For Educ. Stats.,
Alternative Schools and
Programs for Public School Students At Risk of Educational F
ailure: 2007-08 11
(2010).
83 JUV. L. CTR., su/ranote 78, at 11.
84 See Amber Farn & Jill Adams, Ctr. for Juv. Just. Reform,
Education and
Interagency Collaboration: A Lifeline for Justice-Involved
Youth 10-11 (2016)
(discussing the successes of students at Maya Angelou Academy
at New Beginnings).
85 S e e Melinda D. Anderson, Learning Behind Bars, The
Atlantic (Jun. 6, 2016),
https://www.theatlantic.com/education/archive/2016/06/learning
-behind-bars/485663/
[https://perma.cc/86CJ-SYWX] (discussing the fact that
education quality in correctional settings
can vary greatly).
86 See Forever Board, Maya Angelou Schools See Forever
Foundation,
http://www.seeforever.org/the-foundation/see-forever-board/
[https://perma.cc/BQ5M-GNAF]
(quoting David Domenici, Director of the Center for
Educational Excellence in Alternative Settings).
2018] From Correctional Education to School Reentry 139
vm. Recommendations
1. Implement individualized, long-term educational planning
from intake to discharge.
From the moment of intake, correctional staff should develop
and implement an individualized educational plan for each
student that
both targets specific educational outcomes and contains possible
routes
for school reentry. One example of a model for this approach is
Georgia’s
Student Transition Model, which includes a four-stage timeline
for
correctional education: intake, ongoing educational activities,
review for
release, and a formal exit interview.87 Correctional staff
compiles
important documents in a student portfolio, which contains
official
documentation of previous academic records, completed
correctional
education, and information on next steps for reenrollment.88 To
further
facilitate education reentry, correctional staff should give the
student a
transition portfolio consisting of official documentation of
completed
correctional education and information on next steps for
reenrollment,
including application timeliness and credit equivalency charts,
to
facilitate knowledge about the reenrollment process.
2. Encourage greater collaboration between state education
agencies, local school districts, and juvenile justice facilities.
Policymakers should encourage greater collaboration on
correctional education between state and local education
agencies, local
school districts, and juvenile justice facilities. Policymakers
should help
standardize and streamline the education reenrollment process,
including
increased use of integrated electronic systems. Juvenile justice
facilities
should work directly with home school districts to timely
transfer records
and place students immediately upon release. They should also
connect
the released youth with probation departments, child welfare
systems,
mental health agencies, and community organizations to help
initiate
wraparound aftercare services. In particular, similarly focused
probation
departments may aid the reentry process; Pennsylvanian
probation
officers, for example, improved their rates of reenrolling youth
under
their supervision in public school after training to advocate
education
reentry.89
87 Ed Risler & Tom O ’Rourke, Thinking Exit at Entry:
Exploring Outcomes o f Georgia’s
Juvenile Justice Education Programs, 60 J. Correctional Educ.
225, 230 (2009).
88 Id.
89 See Schwartz, supra note 64, at 21 ( “Probation officers
became education advocates. They
140 Texas Journal on Civil Liberties & Civil Rights [Yol. 23:2
Some private parties help create the necessary connection
between education and justice departments. A New York City
nonprofit
organization, for example, supports reentry by assessing current
levels
of student education, expediting school reenrollment and record
transfer
where possible, and tutoring students in reading.90 Program
data on
student outcomes indicate a sixty-six percent student retention
rate, on
average, from one academic year to the next.91
3. Align correctional education curricula and standards with
local
school districts.
Policymakers should align correctional education curricula and
standards with those of local school districts. Students should
always be
able to earn transferrable course credit for schooling completed
in
detention. State correctional education standards, when fully
aligned with
local school district standards, could provide benchmarks of
quality
related to minimum daily hours of classroom instruction,
maximum
student-teacher ratios, and minimum teacher credentials.
Aligned
educational standards could also make available professional
development opportunities, instruction for English Language
Learners in
their native language, services for students with learning
disabilities and
remedial needs, and a more complete offering of core courses.
4. Increase tracking and evaluation o f academic outcomes.
Long-term academic outcomes for students who formerly
attended correctional education should be tracked. Thi s tracking
should
include data points that measure performance and completion in
correctional courses as well as subsequent secondary and post-
secondary
courses, attainment rates for high school diplomas and General
Education
Development (GED) certificates, performance and completion in
any
vocational training programs, and results from evaluations of
the efficacy
of local correctional education led by State juvenile justice
departments.
Policymakers can then use this information to inform and
develop policy
change and reform.
State juvenile justice departments may vary in evaluation
methods for their correctional education programs. If cost
permits, state
were much more successful with school enrollment when youth
left placement.”).
90 Cora Roy-Stevens, U.S. Dep’t of Just. , Overcoming Barriers
to School Reentry 1-
2 (2004) (discussing services available at Community Prep High
School, a transitional school for
students who are ready to attend community schools on release
from custody).
91 Id.
2018] From Correctional Education to School Reentry 141
juvenile justice departments may develop their own evaluation
methods
for correctional education and perform these evaluations on a
regular and
formal basis; if budgets are constrained, they should at a
minimum
implement wider use of already available evaluation tools
modeled after
publicly available options. The State Correctional Education
Self-
Assessment (SCES) tool developed by the Department of
Education, for
example, is publicly accessible online to help state governments
complete
voluntary self-assessments of special education within
correctional
programs.92
5. Place more social workers in public schools to support youth
in transition.
Policymakers should place more social workers in public
schools
to emphasize transition services around release and to provide
integral
support to youths. The process of school reenrollment
frequently throws
youth off-track.93 Social workers can act as liaisons between
schools and
correctional staff at juvenile justice facilities to smooth the
transition and
increase reenrollment.
6. Mandate that schools accept formerly incarcerated students.
Due to the poor educational quality of many alternative
programs,94 state legislators should support legislation to
remove barriers
to school reenrollment for formerly incarcerated youth. States
should
follow the lead of Connecticut95 and Washington,96 which
have laws
favorable to youths that may allow them to be more easily
readmitted or
otherwise protect them from being expelled in certain
circumstances.
92 U.S. Dep’t of Educ. Of f . of Spec. Ed u . Programs (OSEP),
State Correctional
education Self-Assessment (SCES) (2014) (“The Office of
Special Education Programs (OSEP)
has developed a voluntary State Correctional Education Self-
Assessment (SCES) to assist States in
self-assessing their systems for providing special education and
related services to students with
disabilities in correctional facilities.”).
93 See supra Part IV.
94 See Anderson, supra note 85 (discussing the fact that
education quality in correctional settings
can vary greatly).
95 See Conn. Gen. Stat. § 10-233d (2017) (requiring boards of
education to readmit students to
the district if such student has been in an out-of-district
placement in lieu of expulsion).
96 See, e.g., Wash. Rev. Code § 28A.635.020 (protecting
students’ freedom of speech while in
school).
142 Texas Journal on Civil Liberties & Civil Rights [Vol. 23:2
7. Increase investment in and funding for correctional education
and reentry programs.
States and the federal government should increase investment
and
funding for correctional education. This investment may be
needed for
adequate staffing97 and will likely yield long-term savings. A
2009 study
by the RAND Corporation found that each dollar invested in
adult
correctional education returns five dollars in savings during the
first three
years following release.98 Given the importance of education
for youth in
transition, it seems likely that similar investments in juvenile
correctional
education would yield similar, if not greater, benefits.
Availability of federal funding should be revisited and
increased.
For example, the Department of Education in 2016 allocated a
small
federal grant of $5.6 million to only four secondary and post-
secondary
grantees across the country.99 Many more programs likely need
this kind
of funding to improve their correction education. A 2012 report
by
educational foundations and stakeholders recommended that
policymakers amend the Elementary and Secondary Education
Act
(ESEA) to require states and localities to use ESEA funding in
part for
educational services for reentering youth, with accountability to
the
Department of Education.100 Policymakers could also revisit
federal
funding formulas101 for state and local education to incentivize
spending
on reentry services, and expand eligibility for federal Pell
grants102 that
support post-secondary education to include funding at the
secondary
school level.
97 SeeU.S. Dep’t OF EDUC., supra note 11, at 1 (“While 27%
of teachers nationally are absent
more than 10 school days per year for reasons unrelated to
school activities, 35% of teachers at
justice facilities are absent more than 10 days per year.”).
98 Lois M. Davis et a l., Rand Corp., How Effective Is
Correctional Education, and
Where Do We Go from Here?: The Results of a Comprehensive
Evaluation 78 (2014)
(“Our meta-analysis results . . . suggest that . . . for every
dollar spent on correctional education
programs, five dollars are saved in three-year reincarceration
costs.”).
99 Education Department Announces New Tools to Support
Successful Reentry for Formerly
Incarcerated Youth and Adults, U.S. De p’t of Educ. (Apr. 25,
2016),
https://www.ed.gov/news/press-releases/education-department-
announces-new-tools-support-
successful-reentry-formerly-incarcerated-youth-and-adults
[https://perma.cc/BY37-6NMT].
100 Juv. Law Ct r. et al., TOOL IX: Federal Policy
Recommendations 10 (2013)
(discussing the Elementary and Secondary Education Act
(ESEA), Pub. L. 89-10, 79 Stat. 27
(1965)).
101 For more information on federal funding formulas, see How
Do School Funding Formulas
Work?, Urban Inst. (Nov. 29, 2017),
https://apps.urban.org/features/funding-formulas/
[https: //perma. cc/YWN 3-2R4F].
102 For more information of federal Pell grants, see Federal
Pell Grant Program, U.S. Dep’t of
Educ. , https://www2.ed.gov/programs/fpg/index.html
[https://perma.cc/VD2X-HHL9].
2018] From Correctional Education to School Reentry 143
8. Implement best practices in the continuum o f educational
services.
States should consider implementing the following best
practices
in the continuum of educational services:
First, states should ensure sufficient reentry planning. States
should start planning at intake and continue planning through
release,
identify skill-building opportunities, complete a transition
portfolio, and
collaborate and share information between agencies during the
process.
Second, states should ensure quality correctional education.
Sates
should create an individualized case plan with defined
outcomes; align
curricular with local school districts; offer remedial, ELL, and
special
education services; offer sufficient core courses; and conduct
regular and
formal evaluations of their programs.
Third, states should give proper emphasis to transitional
services. Sates should coordinate with probation departments,
emphasize
engagement, provide access to affordable GED testing and
preparation,
and provide access to vocational training.
Lastly, states should focus on school reentry services. States
should transfer records in a timely manner, reenroll students
within two
days of release, ensure students earn transferable credits, and
provide
classes with evening and weekend hours offered at alternative
schools.
Conclusion
Central to juvenile justice reform are the principles that the
rights
and welfare of youth in the system matter and that this
population is not
expendable. Strengthening correctional education and reentry
services
will provide a powerful and desperately needed means to mend
the
damage caused by the school-to-prison pipeline and
criminalization of
underprivileged minorities in the criminal justice system in the
United
States. 103 Education must become a higher priority for
stakeholders, as it
represents a crucial component of how youth involved in the
juvenile
justice system may work toward better life outcomes and reduce
their
likelihood of recidivism. The evidence outlined in this Note
points to the
need for increased investment and innovative solutions that
strengthen
correctional education, remove barriers to school reentry, and
provide
released youth with the support and tools they need to succeed.
103 See Christopher A. Mallett, The School-to-Prison Pipeline,
49 Educ. & Urban Soc’y 563,
572-73 (2017) (referencing the connection between race and
juvenile corrections).
144 Texas Journal on Civil Liberties & Civil Rights [Vol. 23:2
Copyright of Texas Journal on Civil Liberties & Civil Rights is
the property of University of
Texas at Austin School of Law Publications and its content may
not be copied or emailed to
multiple sites or posted to a listserv without the copyright
holder's express written permission.
However, users may print, download, or email articles for
individual use.
Vol.:(0123456789)1 3
Child and Adolescent Social Work Journal (2018) 35:577–585
https://doi.org/10.1007/s10560-018-0549-1
School, Social-Communicative, and Academic Challenges
Among
Delinquents and Juvenile Sexual Offenders
Kevin Tan1 · Adam Brown2 · George Stuart Leibowitz3
Published online: 30 May 2018
© Springer Science+Business Media, LLC, part of Springer
Nature 2018
Abstract
This study explores the association between student factors and
delinquency by comparing two groups of adjudicated youth
in six Midwestern residential facilities: 331 young men
committed for a sexual offense, and 171 committed for a
nonsexual
offense. Statistically significant findings include juvenile
sexual offenders exhibiting a greater number of delinquent
behaviors
and greater academic and social difficulties compared with their
counterparts adjudicated for a nonsexual offense. Addition-
ally, path analysis revealed that school experience was
negatively associated with delinquency for both groups. For
juvenile
sexual offenders, academic difficulties were associated with
delinquency through their school experience. Among general
delinquents, delinquency was directly associated with social
difficulties and school experience. Implications for interven-
tions and future research are discussed.
Keywords Adolescent sexual offending · Delinquency · School
experience · Academic difficulties · Social difficulties
A range of school-related stressors, such as poor school
experience and social communicative and academic dif-
ficulties are strongly associated with crime among youth
(Agnew, 2009). Youth who have committed sexual offenses
(juvenile sexual offenders, JSOs) tend to have high levels of
co-occurring general delinquency (Brown & Burton, 2010;
van Wijk et al., 2006) and share many characteristics with
youth offenders who have committed nonsexual offenses
(general delinquents, GDs; Seto & Lalumière, 2010). Fail -
ures in school bonding and academic achievement during
early adolescence are well established correlates of prob-
lem behaviors and delinquency in late adolescence (Hoff-
mann, Erickson, & Spence, 2013; Welsh & Harding, 2015).
Strong evidence also associates lack of school-related social
competencies such as communication abilities with delin-
quency (Gottfredson, 2017). This study therefore compares
school-related stressors between JSOs and GDs, an area past
research has ignored.
A recent study comparing JSOs to GD shows that gen-
eral delinquency and property damage significantly pre-
dicted membership in the JSO group (Leibowitz, Akakpo,
& Burton, 2016). However, to the best of our knowledge,
only one study has compared JSOs to GDs using a school-
based indicator. This study relies on population-based data
from Sweden (Kjellgren, Priebe, Svedin, & Långström,
2010). It found that GDs were more likely than JSOs to be
in a vocational school as opposed to an academic-based
program (Kjellgren et al., 2010). However, the authors did
not hypothesize as to the significance of this finding. This
finding might suggest that the relationship between school-
based factors and delinquency looks different for JSOs than
GDs. If so, school-based delinquency interventions for JSOs
might benefit from different approaches than those designed
for GDs. Hence, the purpose of this study is to compare
the role of school experience and social communicative and
academic difficulties on delinquency among JSOs and GDs.
Findings have implications for practice with children and
adolescents in understanding and preventing delinquency,
especially among JSOs.
The literature refers to school experience by many terms,
including “school bonding,” “school engagement,” and
“school connectedness” (Blum, 2005; Jonson-Reid, 2009).
* Kevin Tan
[email protected]
1 School of Social Work, University of Illinois at Urbana-
Champaign, Urbana, USA
2 Silberman School of Social Work, Hunter College, The City
University of New York, New York, USA
3 School of Social Welfare, Stony Brook University, Stony
Brook, New York, USA
578 K. Tan et al.
1 3
All have a strong inverse link with negative behaviors by
adolescents (Blum, 2005; Fredricks, Blumenfeld, & Paris,
2004; Jonson-Reid, 2009; Maddox & Prinz, 2003; McNeely,
Nonnemaker, & Blum, 2002). For example, having the abil-
ity to make and maintain friendships in school and/or the
experience of academic success may contribute to a positive
school experience (Blum, 2005; Jonson-Reid, 2009). Such
positive encounters are important, as failure to cultivate
encouraging experiences might result in young people turn-
ing to crime as a means of alleviating the negative emotions
associated with school (Agnew, 2009). As such, in order to
foster positive feelings of school among JSOs and GDs, it
is important to identify potential sources of school stressors
and to understand how they may relate to delinquency.
A number of factors can influence a student’s experience
at school. For instance, strong evidence shows that race/
ethnicity affects a student’s overall experience in school,
as African American youth proportionally encounter more
academic struggles in school than White youth (Rocque &
Paternoster, 2011). African American youth tend to be over -
represented in juvenile detention settings (Pettus-Davis &
Epperson, 2015). However, White youth tend to represent
the greatest number of JSOs (Burton & Ginsberg, 2012;
Kernsmith, Craun, & Foster, 2009); African-American GDs
are more likely than white GDs to have committed nonsexual
violence (Felson & Kreager, 2014).
A deeper understanding of how race/ethnicity functions
in the connection between delinquency and the school expe-
rience might highlight some important differences between
JSOs and GDs. An understanding of the impact of educa-
tional disability and the attending risk of being victimized
in school than their peers is also a significant contribution
to the literature (Rose, Monda-Amaya, & Espelage, 2010).
Often, a learning disability diagnosis is associated with aca-
demic abilities and social communicative skills (Espelage,
Rose, & Polanin, 2015). Findings with respect to both race
and learning disabilities have important implications for
social workers, particularly school practitioners. First, the
over-representation of African-American youth in juvenile
detention settings requires a social work ethical response
(Pettus-Davis & Epperson, 2015). Second, findings with
respect to all of these factors can support early interventions
to prevent delinquency among students who display signifi -
cant needs in their school social-communicative abilities.
In light of the association between a young person’s aca-
demic ability and school success (Blum, 2005; Jonson-Reid,
2009), social communicative skills, which include the abil-
ity to resolve conflicts and maintain relationships in school
(Merrell & Gimpel, 2014) are important. Despite being con-
ceptually distinct constructs, academic and communicative
deficits are highly correlated; students with poor communi-
cative skills are very likely to have lower academic abilities
and vice versa (Riggio, Messamer, & Throckmorton, 1991).
Furthermore, both poor communicative skills and lower aca-
demic abilities are highly associated with delinquent behav-
iors (Clegg, Stackhouse, Finch, Murphy, & Nicholls, 2009;
Katsiyannis, Ryan, Zhang, & Spann, 2008). The inability to
achieve positively valued goals, such as academic success, or
the loss of positively-valued stimuli, such as having friends
at school, are likely to be great sources of strain in a young
person’s life that could lead to delinquency (Agnew, 2009).
The extent to which academic abilities and social com-
munication are associated with delinquency may differ
between JSOs and GDs. For instance, while researchers
have not explored the link between school experience and
delinquency among JSOs, JSOs tend to have lower measures
of general intelligence and memory functioning than GDs
(Cantor, Blanchard, Robichaud, & Christensen, 2005; Seto
& Lalumière, 2010), which would likely affect academic
ability. Very little attention has been paid to how levels of
social competence might distinguish these groups. If young
people with lower cognitive and communicative function-
ing tend to struggle in their academics and social interac-
tions, it makes sense that they might experience school less
positively than those without these issues might. The addi -
tional strains they experience as a consequence of this type
of school experience may, in turn, expose them higher risk
of engaging in criminological activities (Agnew, 2009; Ben-
nett, Farrington, & Huesmann, 2005; Hawkins, Catalano,
Kosterman, Abbott, & Hill, 1999).
Given the potential for quality of school experience, aca-
demic abilities, and social communication and background
factors to differ between JSOs and GDs, this study seeks to
compare how these student factors may differ. Based on the
literature, we hypothesize that academic and communicative
difficulties correlate with each other for both groups, but
that JSOs will report higher levels of academic and com-
municative difficulties and lower levels of positive school
experience than GDs. We also hypothesize that, after taking
race and special education status into account, the quality of
school experience is inversely associated with delinquency
in both groups. Lastly, we believe that academic and com-
municative difficulties are inversely associated with positive
school experience and positively linked with delinquency
for the two groups.
Methods
School Experiences
Participants and Procedures
Participants were incarcerated male juveniles, ages 12–20
(n = 502), recruited from six residential facilities in a
579School, Social-Communicative, and Academic Challenges
Among Delinquents and Juvenile Sexual…
1 3
Midwestern state. Juvenile sexual offenders are likely to be
male (Barbaree & Marshall, 2008). Among our sample, 331
(66%) were adjudicated for sexual offenses and 171 (34%)
for non-sexual crimes. Among these participants, 321 JSOs
and 155 GDs’ responses were suitable to be used for this
study’s analyses, as the other participants had a high degree
of missing values on some measures used in this study, and it
was not possible to impute. There was no difference between
juveniles left out due to missing responses and those used
in this study.
After approval from the State Department of Youth
Services Institutional Review Board (IRB), self-reported
measures were administered using pencil and paper surveys
in a small group format (6–8 participants) in classrooms.
Youths were separated to ensure that they could not view
one another’s responses. A trained graduate student research
assistant read the survey aloud individually to those youths
who struggled with reading. Participants received no incen-
tive to complete the survey. Those youths who refused to
participate (approximately 30%) were proportionately dis-
tributed across the six facilities. It was not possible to com-
pare data on those who declined vs. those who consented
to participate.
Measures
Academic Difficulties
Academic difficulties were based on the sum of five ques-
tions that assessed problems in reading, writing and math,
such as “how difficult is/was reading for you?” and “how dif-
ficult is/was math for you?” “How difficult was/is penman-
ship (writing letters or numbers) for you?” “How difficult
was/is spelling for you?” “How difficult was/is it for you to
write your thoughts on paper?” These are standard ques-
tions used to assess academic difficulties (Johnston, 1985).
Cronbach’s alpha for this measure was 0.75. Participants
chose from five responses ranging from “1” = no difficulties
at all to “5” = a great degree of difficulty. A higher overall
score would suggest more struggles in academic difficulties.
Social Communicative Difficulties
The measure for communicative difficulties was constructed
from the sum of six questions that examined struggles in
understanding and communicating thoughts and feelings.
The following questions were asked: “How much difficulty
did/do you have understanding what others were saying to
you?” “How difficult was/is it for you to communicate with
others?” “How difficult was/is it for you to communicate
your feelings to others?” “How difficult was/is it for you
to communicate your ideas/thoughts to others?” “How dif-
ficult was/is it for you to understand spoken directions?” and
“How difficult was/is it for you to understand written direc-
tions?” These are frequently used questions to assess social-
communicative difficulties (Kaczmarek, 2002). Cronbach’s
alpha = 0.78. Similar to academic difficulties, participants
chose from five responses ranging from “1” = no difficulties
at all to “5” = a great degree of difficulty.
School Experience
The quality of school experience was measured using a sin-
gle item asking respondents to rate the degree to which they
liked school during their elementary and secondary school
years up until the time of their incarceration. Participants
chose from a scale of 1 to 5, with a higher score indicating
a more positive school experience.
Delinquency
Delinquent behaviors were assessed using the Self-Reported
Delinquency (SRD) scale (Elliott, Huizinga, & Menard,
1989), which measured delinquent behaviors based on 32
questions, such as “before I was arrested, I sold marijuana/
pot/weed/hash,” and “I hit or threatened to hit one of my par -
ents.” For each question, respondents were asked to rate on a
scale of “1,” indicating that they did not exhibit that behav-
ior, to “7,” which indicated that they displayed the behavior
“two to three times a day.” Responses from the 32 questions
were added together to provide a measure of delinquency. A
higher overall score would suggest a higher involvement or
greater intensity in delinquent behaviors. Cronbach’s alpha
was 0.97.
Race/Ethnicity and Special Education Status
Race/ethnicity and special education status were based on
youths’ self-reports. For race/ethnicity, participants chose
from one of these categories: Black or African American,
White or Caucasian, Hispanic or Latino, Asian/Pacific
Islander, Native American / American Indian, Arab Ameri-
can, Others. Special education status was based on the ques-
tion “Did/do you attend Special Education classes?”
Analyses
SPSS version 24.0 was used to run descriptive statistics on
the demographic variables and measures used in the study.
To compare the differences between the JSOs and GDs, t
tests for continuous variables and Chi square tests for cat-
egorical variables were used. Pearson bivariate correlation
analyses were also conducted to examine the strength and
direction of the variables used in this study. Subsequently,
Mplus version 7.4 was used to run path analysis models sep-
arately for JSOs and GDs with the dummy coded variables
580 K. Tan et al.
1 3
for race (African American) and special education added as
covariates in the models.
For both JSOs and GDs, the same model that depicted
the hypotheses of this study was applied and pathways not
meeting statistical significance were removed from the
model. The final model was assessed using the following
goodness-of-fit indices: model Chi square, the comparative
fit index (CFI), the Tucker–Lewis index (TLI) and the root
mean square error of approximation (RMSEA). Chi square
tests in the model assess the exact-fit hypothesis that there
are no discrepancies between the co-variances of this study’s
population and those predicted by the models, with an insig-
nificant Chi square (p ≥ 0.05) suggesting that we would not
reject the exact-fit hypothesis. CFI and TLI are incremen-
tal fit indices that compare the improvement in fit over the
baseline model, with values ≥ 0.95 being considered to be
desirable; while the RMSEA is a parsimony-corrected index
with a value of ≤ 0.05 suggesting a good model fit (Kline,
2011). The robust maximum likelihood robust (MLR) esti-
mator under the analysis command in MPLUS was used to
estimate the coefficients for the models. Missing data was
handled using the default ML function in Mplus.
Results
Characteristics of the Sample
Table 1 provides a descriptive summary of the sample. The
mean age for JSOs was 16.70 (SD = 1.65) and for GDs,
16.49 (SD = 1.28). No statistically significant differences
were noted between groups in terms of age. Differences were
noted for race and special education status. JSOs tended to
be mostly White and GDs were mostly African American
(47.0 vs. 52.9%; p ≤ 0.001). JSOs had higher placement rates
in special education (49.4 vs. 26.5%; p ≤ 0.001). JSOs were
significantly more likely than GDs to have reported academic
difficulties (M = 11.01, SD = 4.78 vs. M = 9.84, SD = 4.54;
p ≤ 0.05) and communicative difficulties (M = 12.83,
SD = 5.31 vs. M = 10.19, SD = 4.34; p ≤ 0.001). No statisti-
cal difference was observed between groups in the quality
of school experience reported (JSOs: M = 3.09, SD = 1.39
vs. GDs: M = 2.88, SD = 1.33). Finally, JSOs reported sig-
nificantly higher levels of delinquent behaviors (M = 64.61,
SD = 34.07) than GDs (54.31, SD = 24.46; p ≤ 0.001).
Bivariate Relationships
The Pearson correlation matrix (Table 2) showed that com-
municative difficulties were positively correlated with
delinquency for both JSOs (r = 0.113, p ≤ 0.05) and GDs
(r = 0.228, p ≤ 0.01); while academic difficulties were posi -
tively correlated with delinquency for JSOs only (r = 0.117,
p ≤ 0.05). As expected, school experience was inversely
correlated with delinquency for both JSOs (r = − 0.149,
p ≤ 0.01) and GDs (r = − 0.222, p ≤ 0.01), while commu-
nicative difficulties and academic difficulties were posi -
tively correlated for both JSOs (r = 0.533, p ≤ 0.001) and
GDs (r = 0.464, p ≤ 0.001). School experience was not
significantly correlated with academic and communicative
difficulties for either group. Special education status was
significantly correlated with all other variables for JSOs.
However, for GDs, special education was only significantly
correlated with race, academic difficulties, and communica-
tive difficulties.
Path Analysis Models and Overall Hypotheses
After removing the insignificant pathways, the two final
models (Figs. 1, 2) reported satisfactory overall model-fit
statistics (JSOs: χ2 p = 0.260; CFI = 0.990; TLI = 0.977;
RMSEA = 0.030; GDs: ML χ2 p = 0.908; CFI = 1.00;
TLI = 1.136; RMSEA = 0.001). Both models show a num-
ber of similarities. Firstly, school experience is inversely
Table 1 Descriptive summary
for JSOs and GDs
Characteristics JSOs
(n = 321)
GDs
(n = 155)
Test of
significance
difference
(p-value)
Age, mean (SD) 16.70 (1.65) 16.49 (1.28) 0.114
Race, no. (%)
White 156 (47.00) 60 (35.30) 0.001
African American 90 (27.10) 90 (52.90)
Others 85 (25.70) 21 (11.80)
Attended special education classes, no. (%) 164 (49.40) 45
(26.50) 0.001
School experience, mean (SD) 3.09 (1.39) 2.88 (1.33) 0.112
Academic difficulties, mean (SD) 11.01 (4.78) 9.84 (4.54) 0.009
Communicative difficulties, mean (SD) 12.83 (5.31) 10.19
(4.34) 0.001
Self-reported delinquency scale (SRD), mean (SD) 64.61
(34.07) 54.31 (24.46) 0.001
581School, Social-Communicative, and Academic Challenges
Among Delinquents and Juvenile Sexual…
1 3
associated with delinquency for JSOs (− 0.171; p ≤ 0.01) and
GDs (− 0.230; p ≤ 0.01). In addition, being African Ameri-
can is inversely correlated with special education status for
JSOs (− 0.145; p ≤ 0.05) and GDs (− 0.171; p ≤ 0.05). In
both models, special education status is positively associated
with academic difficulties (JSOs 0.415; p ≤ 0.001; GDs
0.458; p ≤ 0.001) and communicative difficulties (JSOs
0.259; ≤ 0.001; GDs 0.169; p ≤ 0.05).
In addition to their similarities, the two groups showed
some disparate relationships with the dependent variables
Table 2 Pearson correlation matrix for academic difficulties,
communicative difficulties, school experience and delinquency
for JSOs and GDs
The correlations for JSOs (n = 321) are below the 1.00, and the
correlations for GDs (n = 155) are above
***p ≤ 0.001; **p ≤ 0.01; *p ≤ 0.05
African American Special education Academic difficulties
Communica-
tive difficul-
ties
School experience SRD
African American 1.00 − 0.175* − 0.079 0.004 0.067 − 0.040
Special education status − 0.144* 1.00 0.454*** 0.175* 0.080
0.032
Academic difficulties − 0.105 0.370*** 1.00 0.464*** − 0.048
0.145
Communicative difficulties − 0.198*** 0.287*** 0.533*** 1.00
− 0.084 0.228**
School experience − 0.050 0.167** − 0.081 − 0.074 1.00 −
0.222**
Self-reported delinquency scale
(SRD)
0.066 0.122* 0.117* 0.113* − 0.149** 1.00
Special Education
Status
African American School Experience
0.226 ***
0.142 **
-0.171 **
-0.164 **
0.520 ***-0.145 **
0.259 ***
Academic
Difficulties
Communicative
Difficulties
Delinquency
Fig. 1 Final Model for JSOs (n = 321). ***p ≤ 0.001, **p ≤
0.01,
*p ≤ 0.05. Estimates are standardized coefficients. Large circles
rep-
resent latent variables; rectangles represent single-item
indicators.
Single-headed arrows represent regression coefficients; two-
headed
arrows represent correlations. Fit indices: χ2 (6) = 7.706, p =
0.260,
CFI = 0.990 TLI = 0.977, RMSEA = 0.030
Special Education
Status
African American School Experience
-0.230 *
0.230 *
0.433 ***-0.171 *
0.169 * Communicative
Difficulties
Academic
Difficulties
Delinquency
Fig. 2 Final Model for GDs (n = 155). ***p ≤ 0.001, **p ≤
0.01,
*p ≤ 0.05. Estimates are standardized coefficients. Large circles
rep-
resent latent variables; rectangles represent single-item
indicators.
Single-headed arrows represent regression coefficients; two-
headed
arrows represent correlations. Fit indices: χ2 (8) = 3.380, p =
0.908,
CFI = 1.000 TLI = 1.136, RMSEA = 0.001
582 K. Tan et al.
1 3
studied. For JSOs, only academic difficulties were signifi -
cantly associated with school experience (− 0.164; p ≤ 0.01).
GDs did not exhibit this relationship. While communicative
difficulties points to academic difficulties for JSOs (0.520;
p ≤ 0.001). For GDs, this relationship was observed to be
bidirectional (0.433; p ≤ 0.001). Other relationships distinct
to the JSOs included an inverse relationship between being
African American and communicative difficulties (− 0.128;
p ≤ 0.01), a positive association between special education
status and school experience (0.226; p ≤ 0.001), and a posi-
tive link between special education status and delinquency
(0.142; p ≤ 0.01). For GDs, the only relationship that was
distinct was a positive association between communicative
difficulties and delinquency (0.230; p ≤ 0.05).
Discussion
Findings support the hypothesis that JSOs report more aca-
demic difficulties, social communicative difficulties, and
delinquency than GDs. Furthermore, as expected, school
experience was inversely associated with delinquency for
both groups. However, contrary to expectations, there was
no significant difference in the quality of school experience
between the groups. Additionally, after taking into account
race and special education status, the pathways from aca-
demic difficulties to school experience and delinquency
were significant among JSOs. Adolescent development
researchers have found low academic achievement and
having antisocial peers is associated with lower levels of
school experience (Oelsner, Lippold, & Greenberg, 2011).
In Seto and Lalumiere’s (2010) meta-analysis, intelligence
was not associated with the commission of a sexual offense
among youth, although JSOs showed lower mean IQs than
GDs. In this study, there was no direct association between
academic and communicative difficulties on delinquency.
For GDs, communicative difficulties and school experience
were both significantly associated with delinquency in the
hypothesized directions.
This study supports findings from the extant literature
which highlights both an overlap and significant distinctions
in the characteristics of juvenile JSOs and GDs (Leibowitz
et al., 2016; Seto & Lalumière, 2010; Wijk et al., 2005).
Specifically, JSOs display more delinquent behaviors than
GDs. This study also shows the groups have distinct risk fac-
tors: JSOs are significantly more likely to have an underlying
educational disability, exhibit more academic difficulties,
and have greater communicative difficulties. These results
provide evidence suggesting that JSOs might have greater
underlying deficits in cognitive and interactional processes
than GDs. Research investigating executive functioning
among JSOs have found impairments in activities associated
with frontal lobe functioning (Burton, Demuynck, & Yoder,
2016; Veneziano, Veneziano, LeGrand, & Richards, 2004).
These deficits are a potential source of strain for young peo-
ple in schools and could elicit negative emotions, such as
frustration, anger, and fear which, in turn, could diminish
their consideration of the costs of deviant behavior (Agnew,
2009).
Both groups show noteworthy bivariate relationships.
Race/ethnicity was significantly negatively correlated with
special education status in both groups. African American
youth were more likely than Whites to be diagnosed with an
educational disability, which was unexpected given the con-
trary findings in the literature (Rocque & Paternoster, 2011).
Interestingly, for JSOs only, being African American was
also negatively correlated with communicative difficulties.
The finding that African American JSOs struggle less with
communication and report less special education involve-
ment than Whites might suggest that race plays a significant
role in the etiology of JSOs. This is an area in dire need of
further investigation, as we only found one study that has
investigated race directly in youth sexual abuser etiology:
Burton and Ginsberg (2012) show that African American
JSOs have significantly lower levels of deviant sexual inter -
est than their White counterparts.
Study findings might suggest that race/ethnicity plays a
significant role in who gets incarcerated for sexual offenses.
In this sample of youth placed in residential treatment,
Whites are more likely to be JSOs and African American
are more likely to be GDs, reflecting the fact that African
American are overrepresented among GDs but not JSOs
nationally. However, race was not correlated with level of
delinquency for either group. Therefore, if African Ameri -
can youths incarcerated for sexual abuse are presenting with
fewer indicators for being a sexual abuser than White youths,
it seems possible that the threshold for incarcerating a Afri -
can American youth for a sexual offense is lower than it is
for a White youth. Thus, White youth in an incarcerated
sample may represent a more severe type of youth sexual
perpetrator than the African American youth in the same
sample. These findings have important implications to the
broader conversations on the overall discourse of the racial
disproportionality in the juvenile justice system. Efforts
must be made to identify and implement appropriate strate-
gies to address complex social justice issues (Pettus-Davis
& Epperson, 2015). Findings suggest that social workers
should address systemic and structural issues that pertain to
the racial/ethnicity disparities and that future studies should
attempt to better understand what contributes to racial dif-
ference in the schooling experience of racial minority JSOs
and GDs.
Another noteworthy finding from the bivariate analyses is
the observed positive association between special education
status and school experience for JSOs. Results suggest that
JSOs who are diagnosed with an educational disability are
583School, Social-Communicative, and Academic Challenges
Among Delinquents and Juvenile Sexual…
1 3
more likely to report enhanced levels of school experience.
This finding is inconsistent with the schooling experience
literature in general, as students diagnosed with an educa-
tional disability experience more victimization than their
peers (Rose et al., 2010). However, this is the first study
of schooling experience that compares JSOs to GDs. As
has been noted, JSOs tend to demonstrate higher levels of
problematic behavior than GDs. Therefore, it seems plausi-
ble that JSOs might receive proportionally higher levels of
individualized attention and support from special education
teachers than GDs. Thus, for JSOs in special education, their
positive school experience may be a function of their special
education status.
Among the aspects of student factors examined in this
study, the quality of school experience is associated with
delinquency for both JSOs and GDs. This finding is con-
sistent with the General Strain Theory’s proposition on the
importance of cultivating positive experiences of school for
young people to serve as a deterrent against crime (Agnew,
2009). Results are also consistent with literature, which
highlights the importance of one’s time in school as a deter-
rent against delinquency (Blum, 2005; Jonson-Reid, 2009;
Maddox & Prinz, 2003; McNeely et al., 2002). Given this,
we expected JSOs to have a poorer experience of school.
However, the analyses showed no significant difference
between JSOs and GDs. Given that JSOs have greater defi-
cits in academics and communicative abilities, this result
might indicate that the overall school experience is similar
for both groups because neither of these factors affect it.
However, path analysis showed that, despite a significant
correlation for both groups between participation in special
education and academic difficulties, the overall school expe-
rience was only positively associated with these factors for
JSOs. Furthermore, special education participation only had
a direct correlation with delinquency for JSOs. Therefore, it
is possible that, for JSOs only, special education status and
academic difficulties have a unique association with school
experience and the severity of delinquent behavior. Given
the dearth of research on understanding the student factors
of juvenile JSOs, this study contributes new knowledge to
the field by drawing attention to the importance of the qual -
ity of student factors as a possible protective factor against
sexual offending.
Two different patterns of the relations among academic
difficulties, communicative difficulties, and school experi -
ence emerged for JSOs and GDs. For JSOs, academic dif-
ficulties have a stronger correlation with delinquency than
communicative difficulties. Further, the correlation between
academic deficits and delinquency seems to be indirect in
that both relate to the quality of their time in school. In
other words, for JSOs, the school experience mediates the
effects of academic strains on delinquent behavior. A medi-
tational influence of school experience between academic
difficulties and delinquency is plausible, as General Strain
Theory highlights the function of social institutions, such
as schools, to serve as a form of social control against crime
(Agnew, 2009). Although a meditational analysis was not
part of the original focus of this study, the finding that help-
ing to attain positively-valued goals, such as academic suc-
cess, could be associated with a more positive experience
of time in school and thereby lower individual risk of devi -
ant behaviors might guide future interventions. Similarly,
the suggestion that positive school experiences buffer the
strains JSOs who are academically challenged experience as
a result of their academic deficits might guide preventative
programs. Findings suggest that professionals working with
JSOs should consider targeting levels of academic abilities
and school experience together, as both strategies effectively
reduce delinquency. Future research may also explicitly test
for a mediating effect of school experience in the pathway
between academic difficulties and delinquency.
On the contrary, for GDs, delinquency does not appear to
be related to impaired intellectual functioning. One possible
explanation is that GDs struggle less than JSOs to reflect on
the consequences of their actions. These findings are consist-
ent with the literature, which highlights that GDs are more
likely to have higher cognitive abilities than JSOs (Cantor
et al., 2005; Seto & Lalumière, 2010). Findings also suggest
that GDs with strong communicative abilities are more likely
to be delinquent. Based on this, interventions should address
the different developmental pathways to delinquenc y, includ-
ing improving the quality of relationships in school, as posi -
tive school experience is inversely associated with negative
behaviors.
Implications for Practice
There are many strategies that child and adolescent profes-
sionals can utilize to promote positive school experiences,
social communicative abilities, and academic performance.
Blum (2005) discusses multiple best practices that pro-
fessionals may use to promote positive school experience
among the young people they serve. For instance, GDs
showed a greater liking for school if they had more partici -
pation in school activities and/or leadership opportunities in
school. Programs to foster delinquents’ social communica-
tive abilities may adopt a social-emotional learning approach
in which specific social skills deficits can be screened, iden-
tified, and addressed. The Social Skills Improvement System
is an intervention in which practitioners and educators iden-
tify specific social skills in need of attention and participants
can undertake particular intervention modules to address
their needs (Gresham & Elliott, 2008). Young people’s read-
ing and mathematics abilities can also be screened, and those
who perform at or below grade level can undergo targeted
academic programs to enhance their academic abilities. For
584 K. Tan et al.
1 3
instance, randomized clinical trials of Read 180, an aca-
demic intervention program, have shown improvements in
reading achievements among low-achieving incarcerated
youth (Zhu, Loadman, Lomax, & Moore, 2010).
Limitations
There are limitations to this study that may affect the gener -
alizability of the findings. Although a strength of the study
is that data were collected from multiple facilities, all of
them were in a single state and findings may not generalize
to youth in facilities across different geographic locations.
As well, all participants were male, so findings may not gen-
eralize to females. This study is also based on retrospective
self-reported data from young people who were incarcerated
at the time of data collection, which may lead to a response
bias. We also recognize some limitations of the use of our
measure of school experience. In this study, we based this
construct on a single question asking participants to rate the
degree to which they liked school. Although such a ques-
tion provides an overall scale of the quality of one’s school
encounters, the question subsumes specific factors such as
the quality of their teachers and peer relationships as well
as their perceptions of school environment. The lack of
details limits the understanding of the richness of the school
encounters of JSOs and GDs. Additionally, special educa-
tion status was measured by attendance in special education
classes. It is possible that students will have unaddressed
special education needs that were not identified. Thus, spe-
cial education status may be under-identified in this study’s
sample.
Lastly, this is a simple cross-sectional study and as such,
has the lowest confidence in explaining causality. Studies
that have secondary sources, such as school grade reports
or psychological assessment reports, as well as longitudinal
data, could further strengthen the conclusions drawn from
this study. However, the availability of such data on samples
of JSOs and GDs are a challenge to access due to a vari -
ety of social and legal constraints. Nonetheless, in spite of
these limitations, given the relative lack of research on the
educational experience of young offenders, this research is
among the first to provide valuable insights into their school -
ing experience.
Conclusion
Few studies have examined the link among school-related
factors and delinquency among JSOs and GDs. Findings
highlight the need for child and adolescent work to focus on
promoting youth school experiences and social-communica-
tive and academic abilities. Results illustrate that these have
varying relations with delinquency among JSOs and GDs.
Furthermore, we recommend that future studies build on
this study to examine more deeply the relations among race,
school factors, and delinquency among JSOs and GDs. Stud-
ies are also needed to explicitly test and compare the poten-
tial for school experience to mediate the relations among
social-communicative and academic factors and delinquency
among JSOs and GDs. Findings advance the limited research
on school-based factors and delinquency on youth who com-
mitted sexual offenses.
Acknowledgements The authors would like to acknowledge the
Social
Work Academic Criminality Collaboratory (SWACC) for data
sharing
and consultation on this project.
References
Agnew, R. (2009). General strain theory: Current status and
direc-
tions for future research. In F. T. Cullen, J. P. Wright, & K. R.
Blevins (Eds.), Taking stock: The status of criminological
theory.
Advances in criminology theory (Vol. 15, pp. 101–123). New
Brunswick, NJ: Transaction Publishers.
Barbaree, H. E., & Marshall, W. L. (2008). The juvenile sex
offender.
New York: Guilford Press.
Bennett, S., Farrington, D. P., & Huesmann, L. R. (2005).
Explain-
ing gender differences in crime and violence: The importance of
social cognitive skills. Aggression and Violent Behavior, 10(3),
263–288. https ://doi.org/10.1016/j.avb.2004.07.001.
Blum, R. W. (2005). A case for school connectedness.
Educational
Leadership, 62(7), 16–20.
Brown, A., & Burton, D. L. (2010). Exploring the overlap in
male juve-
nile sexual offending and general delinquency: Trauma, alcohol
use, and masculine beliefs. Journal of Child Sexual Abuse,
19(4),
450–468. https ://doi.org/10.1080/10538 712.2010.49504 4.
Burton, D., Demuynck, S., & Yoder, J. R. (2016). Executive
dysfunc-
tion predicts delinquency but not characteristics of sexual
aggres-
sion among adolescent sexual offenders. Sexual Abuse, 28(8),
707–721.
Burton, D., & Ginsberg, D. (2012). An exploration of racial
differ-
ences in deviant sexual interests among male adolescent sexual
offenders. Journal of Forensic Social Work, 2(1), 25–44. https
://
doi.org/10.1080/19369 28X.2011.60976 6.
Cantor, J. M., Blanchard, R., Robichaud, L. K., & Christensen,
B. K.
(2005). Quantitative reanalysis of aggregate data on IQ in
sexual
offenders. Psychological Bulletin, 131(4), 555.
Clegg, J., Stackhouse, J., Finch, K., Murphy, C., & Nicholls, S.
(2009).
Language abilities of secondary age pupils at risk of school
exclu-
sion: A preliminary report. Child Language Teaching and Ther -
apy, 25(1), 123–139.
Elliott, D. S., Huizinga, D., & Menard, S. W. (1989). Multiple
problem
youth: Delinquency, substance use, and mental health problems.
New York: Springer.
Espelage, D. L., Rose, C. A., & Polanin, J. R. (2015). Social -
emotional
learning program to reduce bullying, fighting, and victimization
among middle school students with disabilities. Remedial and
Special Education, 36(5), 299–311.
Felson, R. B., & Kreager, D. A. (2014). Group differences in
delinquency. Race and Justice, 5(1), 58–87. https ://doi.
org/10.1177/21533 68714 54695 3.
Fredricks, J. A., Blumenfeld, P. C., & Paris, A. H. (2004).
School
engagement: Potential of the concept, state of the evidence.
585School, Social-Communicative, and Academic Challenges
Among Delinquents and Juvenile Sexual…
1 3
Review of Educational Research, 74(1), 59–109. https ://doi.
org/10.3102/00346 54307 40010 59.
Gottfredson, D. C. (2017). Prevention research in schools.
Criminol-
ogy & Public Policy, 16(1), 7–27. https
://doi.org/10.1111/1745-
9133.12280 .
Gresham, M., & Elliott, S. (2008). Social skills improvement
system.
Minneapolis: Pearson.
Hawkins, J. D., Catalano, R. F., Kosterman, R., Abbott, R. D.,
&
Hill, K. (1999). Preventing adolescent health-risk behaviors by
strengthening protection during childhood. Archives of
Pediatrics
& Adolescent Medicine, 153(3), 226–234. https
://doi.org/10.1001/
archp edi.153.3.226.
Hoffmann, J. P., Erickson, L. D., & Spence, K. R. (2013).
Modeling the
association between academic achievement and delinquency: An
application of interactional theory. Criminology, 51(3), 629–
660.
https ://doi.org/10.1111/1745-9125.12014 .
Johnston, P. (1985). Understanding reading disability: A case
study
approach. Harvard Educational Review, 55(2), 153–178.
Jonson-Reid, M. (2009). Redefining the outcome for education.
Children & Schools, 31(3), 131–133. https ://doi.org/10.1093/
cs/31.3.131.
Kaczmarek, L. A. (2002). Assessment of social-communicative
com-
petence: An interdisciplinary model. Towson: Paul H Brookes
Publishing.
Katsiyannis, A., Ryan, J. B., Zhang, D., & Spann, A. (2008).
Juvenile
delinquency and recidivism: The impact of academic achieve-
ment. Reading & Writing Quarterly, 24(2), 177–196.
Kernsmith, P. D., Craun, S. W., & Foster, J. (2009). Public
attitudes
toward sexual offenders and sex offender registration. Journal
of
Child Sexual Abuse, 18(3), 290–301.
Kjellgren, C., Priebe, G., Svedin, C. G., & Långström, N.
(2010).
Sexually coercive behavior in male youth: Population survey of
general and specific risk factors. Archives of Sexual Behavior,
39(5), 1161–1169.
Kline, R. B. (2011). Principles and practice of structural
equation
modeling (3rd ed.). New York: The Guilford Press.
Leibowitz, G. S., Akakpo, T., & Burton, D. L. (2016).
Comparison of
non-sexual crimes committed by juvenile sexual offenders and
delinquent Youth in residential treatment in the USA. Journal of
Sexual Aggression, 22(1), 66–81.
Maddox, S. J., & Prinz, R. J. (2003). School bonding in children
and
adolescents: Conceptualization, assessment, and associated vari -
ables. Clinical Child and Family Psychology Review, 6(1), 31–
49.
https ://doi.org/10.1023/A:10222 14022 478.
McNeely, C. A., Nonnemaker, J. M., & Blum, R. W. (2002).
Promot-
ing school connectedness: Evidence from the national longitudi -
nal study of adolescent health. Journal of School Health, 72(4),
138–146. https ://doi.org/10.1111/j.1746-1561.2002.tb065 33.x.
Merrell, K. W., & Gimpel, G. (2014). Social skills of children
and
adolescents: Conceptualization, assessment, treatment. Hove:
Psychology Press.
Oelsner, J., Lippold, M. A., & Greenberg, M. T. (2011). Factors
influ-
encing the development of school bonding among middle school
students. The Journal of Early Adolescence, 31(3), 463–487.
Pettus-Davis, C., & Epperson, M. (2015). Promote smart
decarcer-
ation—American Academy of Social Work and Social Welfare.
Retrieved from http://aasws w.org/grand -chall enges -initi ative
/12-
chall enges /promo te-smart -decar cerat ion/.
Riggio, R. E., Messamer, J., & Throckmorton, B. (1991). Social
and
academic intelligence: Conceptually distinct but overlapping
con-
structs. Personality and Individual Differences, 12(7), 695–702.
Rocque, M., & Paternoster, R. (2011). Understanding the
anteced-
ents of the school-to-jail link: The relationship between race
and
school discipline. The Journal of Criminal Law and
Criminology,
101, 633.
Rose, C. A., Monda-Amaya, L. E., & Espelage, D. L. (2010).
Bully-
ing perpetration and victimization in special education: A
review
of the literature. Remedial and Special Education. https ://doi.
org/10.1177/07419 32510 36124 7
Seto, M. C. & Lalumière, M. L. (2010). What is so special about
male
adolescent sexual offending? A review and test of explanations
through meta-analysis. Psychological Bulletin, 136(4), 526–575.
https ://doi.org/10.1037/a0019 700.
van Wijk, A., Vermeiren, R., Loeber, R., Hart-Kerkhoffs, L. T.,
Dore-
leijers, T., Bullens, R. (2006). Juvenile sex offenders compared
to
non-sex offenders: A review of the literature 1995–2005.
Trauma,
Violence & Abuse, 7(4), 227–243. https
://doi.org/10.1177/15248
38006 29251 9.
Veneziano, C., Veneziano, L., LeGrand, S., & Richards, L.
(2004).
Neuropsychological executive functions of adolescent sex
offend-
ers and nonsex offenders. Perceptual and Motor Skills, 98(2),
661–674.
Welsh, W. N., & Harding, C. (2015). School effects on
delinquency and
school-based prevention. In M.D. Krohn & J. Lane (Eds.), The
handbook of juvenile delinquency and juvenile justice (pp. 181–
198). New York: Wiley.
Wijk, V., Loeber, R., Vermeiren, R., Pardini, D., Bullens, R., &
Dore-
leijers, T. (2005). Violent juvenile sex offenders compared with
violent juvenile nonsex offenders: Explorative findings from the
Pittsburgh Youth Study. Sexual Abuse: A Journal of Research
and
Treatment, 17(3), 333–352.
Zhu, J., Loadman, W. E., Lomax, R. G., & Moore, R. (2010).
Evaluat-
ing intervention effects of scholastic READ 180 on low -
achieving
incarcerated youth. Evanston, IL: Society for Research on
Educa-
tional Effectiveness. Retrieved from ERIC database.
(ED514404).
https ://eric.ed.gov/?id=ED514 404.
Child & Adolescent Social Work Journal is a copyright of
Springer, 2018. All Rights
Reserved.
Some of my Students are Prisoners:
Issues and Dilemmas for Social Work
Educators
Beth R. Crisp & Philip Gillingham
Higher education recruitment principles and procedures which
seek to redress social
exclusion have inadvertently resulted in the authors discovering
that some of their
students are incarcerated. Notwithstanding the important
logistical issues which may
emerge as a consequence of accepting prisoners into a
programme of social work
education, it would seem that the inclusion of prisoners is
symbolic of a fundamental
difference in philosophy with a risk management stance which
expects that social work
educators act as gatekeepers to the profession, especially in
respect of students with
criminal convictions.
Keywords: Social Work Education; Social Work Students;
Offenders; Prisoners; Social
Inclusion; Risk Management
Introduction
The related questions of who is fit and proper to be a social
worker, and
consequently, who is suitable to undertake a course of study
leading to qualification
as a social worker, are perennial issues for a range of
stakeholders in social work
education. In some countries, including the US, UK and New
Zealand, the desire to
restrict who can practise as a social worker has resulted in
systems of licensing or
registration of the workforce. In the UK, registration has been
further extended to
include students in recognised programmes of qualifying studies
in social work. In
stark contrast to these overseas developments, the authors, who
teach social work at
Deakin University, which is one of the leading providers of
distance education in
Australia, have discovered that an inadvertent outcome of
offering a social work
degree in distance education mode is that some prisoners are
choosing to study social
work.
Correspondence to: Beth R. Crisp, School of Health and Social
Development, Deakin University, 1 Gheringhap Street,
Waterfront Campus, Geelong, Victoria 3217, Australia. Email:
[email protected]
Beth R. Crisp & Philip Gillingham, Deakin University,
Australia.
Social Work Education
Vol. 27, No. 3, April 2008, pp. 307–317
ISSN 0261-5479 print/1470-1227 online # 2008 The Board of
Social Work Education
DOI: 10.1080/02615470701380360
In this paper, after describing the key features of the Bachelor
of Social Work
(BSW) degree at Deakin, we will explore arguments for and
against allowing current
prisoners to become social work students using two seemingly
competing
contemporary discourses that are shaping social work, namely
social inclusion and
risk management.
Social Work Education at Deakin
Despite being a profession which claims actively to be about
promoting social
inclusion, social work education in Australia has traditionally
been somewhat socially
exclusive. Prior to the early 1990s, there were relatively few
opportunities to study
social work which did not require full-time study on a
metropolitan campus. The last
15 years have seen an enormous growth in social work
education, with an increase
from 13 to 23 providers, with the majority of these new courses
in regional centres.
However, an even more fundamental change has been the
introduction of off-campus
(distance education) programmes, and there are now a number
of Australian
universities offering the Bachelor of Social Work (BSW) fully
or partially in this
mode of delivery. The BSW is the approved entry level
qualification for social
workers in Australia.
Deakin University is one of the accredited providers of the BSW
by distance mode
and Deakin’s BSW is an undergraduate degree which requires
the equivalent of four
years of full-time study. Deakin places a high priority on
offering educational
opportunities to potential students who demonstrate aptitude for
university study
but due to various reasons require a flexible mode of delivery in
order to access
higher education. Hence, students can study either full- or part-
time and in on- or
off-campus modes, with the possibility of changing mode of
study as their needs
change. However, there is no difference in academic
expectations of students between
different modes of study. All students are expected to attend an
intensive practice
skills workshop for a few days at the Waterfront campus of the
From Correctional Education to School Reentry How Formerly

More Related Content

More from JeanmarieColbert3

Hai,this is Anusha. am looking for a help with my research.docx
Hai,this is Anusha. am looking for a help with my research.docxHai,this is Anusha. am looking for a help with my research.docx
Hai,this is Anusha. am looking for a help with my research.docxJeanmarieColbert3
 
Guys I need your help with my international law class, Its a course.docx
Guys I need your help with my international law class, Its a course.docxGuys I need your help with my international law class, Its a course.docx
Guys I need your help with my international law class, Its a course.docxJeanmarieColbert3
 
hare some memories of encounters with people who had very different .docx
hare some memories of encounters with people who had very different .docxhare some memories of encounters with people who had very different .docx
hare some memories of encounters with people who had very different .docxJeanmarieColbert3
 
Hacker or SupporterAnswer ONE of the following questionsQuestio.docx
Hacker or SupporterAnswer ONE of the following questionsQuestio.docxHacker or SupporterAnswer ONE of the following questionsQuestio.docx
Hacker or SupporterAnswer ONE of the following questionsQuestio.docxJeanmarieColbert3
 
HA415 Unit 6Discussion TopicHealthcare systems are huge, compl.docx
HA415 Unit 6Discussion TopicHealthcare systems are huge, compl.docxHA415 Unit 6Discussion TopicHealthcare systems are huge, compl.docx
HA415 Unit 6Discussion TopicHealthcare systems are huge, compl.docxJeanmarieColbert3
 
HA410 Unit 7 AssignmentUnit outcomes addressed in this Assignment.docx
HA410 Unit 7 AssignmentUnit outcomes addressed in this Assignment.docxHA410 Unit 7 AssignmentUnit outcomes addressed in this Assignment.docx
HA410 Unit 7 AssignmentUnit outcomes addressed in this Assignment.docxJeanmarieColbert3
 
hacer oír salir suponer traer ver 1. para la clase a la.docx
hacer oír salir suponer traer ver 1.  para la clase a la.docxhacer oír salir suponer traer ver 1.  para la clase a la.docx
hacer oír salir suponer traer ver 1. para la clase a la.docxJeanmarieColbert3
 
H07 Medical Coding IDirections  Be sure to make an electronic c.docx
H07 Medical Coding IDirections  Be sure to make an electronic c.docxH07 Medical Coding IDirections  Be sure to make an electronic c.docx
H07 Medical Coding IDirections  Be sure to make an electronic c.docxJeanmarieColbert3
 
Guidelines1.Paper consisting of 2,000-2,250 words; however,.docx
Guidelines1.Paper consisting of 2,000-2,250 words; however,.docxGuidelines1.Paper consisting of 2,000-2,250 words; however,.docx
Guidelines1.Paper consisting of 2,000-2,250 words; however,.docxJeanmarieColbert3
 
Guidelines12-point fontCambria fontSingle space50 words ma.docx
Guidelines12-point fontCambria fontSingle space50 words ma.docxGuidelines12-point fontCambria fontSingle space50 words ma.docx
Guidelines12-point fontCambria fontSingle space50 words ma.docxJeanmarieColbert3
 
HA425 Unit 2 discussion- Organizational Behavior and Management in H.docx
HA425 Unit 2 discussion- Organizational Behavior and Management in H.docxHA425 Unit 2 discussion- Organizational Behavior and Management in H.docx
HA425 Unit 2 discussion- Organizational Behavior and Management in H.docxJeanmarieColbert3
 
GuidelinesPaper  is based on one novel , Frankenstein. We ha.docx
GuidelinesPaper  is based on one novel , Frankenstein. We ha.docxGuidelinesPaper  is based on one novel , Frankenstein. We ha.docx
GuidelinesPaper  is based on one novel , Frankenstein. We ha.docxJeanmarieColbert3
 
Guidelines1.Paper word count should be 1,000-1,250. Refer.docx
Guidelines1.Paper word count should be 1,000-1,250. Refer.docxGuidelines1.Paper word count should be 1,000-1,250. Refer.docx
Guidelines1.Paper word count should be 1,000-1,250. Refer.docxJeanmarieColbert3
 
Guided Response Respond to at least two of your classmates.  Ch.docx
Guided Response Respond to at least two of your classmates.  Ch.docxGuided Response Respond to at least two of your classmates.  Ch.docx
Guided Response Respond to at least two of your classmates.  Ch.docxJeanmarieColbert3
 
Guided ResponseReview the philosophies of education that your.docx
Guided ResponseReview the philosophies of education that your.docxGuided ResponseReview the philosophies of education that your.docx
Guided ResponseReview the philosophies of education that your.docxJeanmarieColbert3
 
Guided Response  When responding to your peers, suggest ways to.docx
Guided Response  When responding to your peers, suggest ways to.docxGuided Response  When responding to your peers, suggest ways to.docx
Guided Response  When responding to your peers, suggest ways to.docxJeanmarieColbert3
 
Guided Response As you read the responses of your classmates, con.docx
Guided Response As you read the responses of your classmates, con.docxGuided Response As you read the responses of your classmates, con.docx
Guided Response As you read the responses of your classmates, con.docxJeanmarieColbert3
 
Guided ResponseReview several of your classmates’ posts and res.docx
Guided ResponseReview several of your classmates’ posts and res.docxGuided ResponseReview several of your classmates’ posts and res.docx
Guided ResponseReview several of your classmates’ posts and res.docxJeanmarieColbert3
 
Guided ResponseYou must reply to at least one classmate. As y.docx
Guided ResponseYou must reply to at least one classmate. As y.docxGuided ResponseYou must reply to at least one classmate. As y.docx
Guided ResponseYou must reply to at least one classmate. As y.docxJeanmarieColbert3
 
Guided ResponseRespond to at least one classmate that has been .docx
Guided ResponseRespond to at least one classmate that has been .docxGuided ResponseRespond to at least one classmate that has been .docx
Guided ResponseRespond to at least one classmate that has been .docxJeanmarieColbert3
 

More from JeanmarieColbert3 (20)

Hai,this is Anusha. am looking for a help with my research.docx
Hai,this is Anusha. am looking for a help with my research.docxHai,this is Anusha. am looking for a help with my research.docx
Hai,this is Anusha. am looking for a help with my research.docx
 
Guys I need your help with my international law class, Its a course.docx
Guys I need your help with my international law class, Its a course.docxGuys I need your help with my international law class, Its a course.docx
Guys I need your help with my international law class, Its a course.docx
 
hare some memories of encounters with people who had very different .docx
hare some memories of encounters with people who had very different .docxhare some memories of encounters with people who had very different .docx
hare some memories of encounters with people who had very different .docx
 
Hacker or SupporterAnswer ONE of the following questionsQuestio.docx
Hacker or SupporterAnswer ONE of the following questionsQuestio.docxHacker or SupporterAnswer ONE of the following questionsQuestio.docx
Hacker or SupporterAnswer ONE of the following questionsQuestio.docx
 
HA415 Unit 6Discussion TopicHealthcare systems are huge, compl.docx
HA415 Unit 6Discussion TopicHealthcare systems are huge, compl.docxHA415 Unit 6Discussion TopicHealthcare systems are huge, compl.docx
HA415 Unit 6Discussion TopicHealthcare systems are huge, compl.docx
 
HA410 Unit 7 AssignmentUnit outcomes addressed in this Assignment.docx
HA410 Unit 7 AssignmentUnit outcomes addressed in this Assignment.docxHA410 Unit 7 AssignmentUnit outcomes addressed in this Assignment.docx
HA410 Unit 7 AssignmentUnit outcomes addressed in this Assignment.docx
 
hacer oír salir suponer traer ver 1. para la clase a la.docx
hacer oír salir suponer traer ver 1.  para la clase a la.docxhacer oír salir suponer traer ver 1.  para la clase a la.docx
hacer oír salir suponer traer ver 1. para la clase a la.docx
 
H07 Medical Coding IDirections  Be sure to make an electronic c.docx
H07 Medical Coding IDirections  Be sure to make an electronic c.docxH07 Medical Coding IDirections  Be sure to make an electronic c.docx
H07 Medical Coding IDirections  Be sure to make an electronic c.docx
 
Guidelines1.Paper consisting of 2,000-2,250 words; however,.docx
Guidelines1.Paper consisting of 2,000-2,250 words; however,.docxGuidelines1.Paper consisting of 2,000-2,250 words; however,.docx
Guidelines1.Paper consisting of 2,000-2,250 words; however,.docx
 
Guidelines12-point fontCambria fontSingle space50 words ma.docx
Guidelines12-point fontCambria fontSingle space50 words ma.docxGuidelines12-point fontCambria fontSingle space50 words ma.docx
Guidelines12-point fontCambria fontSingle space50 words ma.docx
 
HA425 Unit 2 discussion- Organizational Behavior and Management in H.docx
HA425 Unit 2 discussion- Organizational Behavior and Management in H.docxHA425 Unit 2 discussion- Organizational Behavior and Management in H.docx
HA425 Unit 2 discussion- Organizational Behavior and Management in H.docx
 
GuidelinesPaper  is based on one novel , Frankenstein. We ha.docx
GuidelinesPaper  is based on one novel , Frankenstein. We ha.docxGuidelinesPaper  is based on one novel , Frankenstein. We ha.docx
GuidelinesPaper  is based on one novel , Frankenstein. We ha.docx
 
Guidelines1.Paper word count should be 1,000-1,250. Refer.docx
Guidelines1.Paper word count should be 1,000-1,250. Refer.docxGuidelines1.Paper word count should be 1,000-1,250. Refer.docx
Guidelines1.Paper word count should be 1,000-1,250. Refer.docx
 
Guided Response Respond to at least two of your classmates.  Ch.docx
Guided Response Respond to at least two of your classmates.  Ch.docxGuided Response Respond to at least two of your classmates.  Ch.docx
Guided Response Respond to at least two of your classmates.  Ch.docx
 
Guided ResponseReview the philosophies of education that your.docx
Guided ResponseReview the philosophies of education that your.docxGuided ResponseReview the philosophies of education that your.docx
Guided ResponseReview the philosophies of education that your.docx
 
Guided Response  When responding to your peers, suggest ways to.docx
Guided Response  When responding to your peers, suggest ways to.docxGuided Response  When responding to your peers, suggest ways to.docx
Guided Response  When responding to your peers, suggest ways to.docx
 
Guided Response As you read the responses of your classmates, con.docx
Guided Response As you read the responses of your classmates, con.docxGuided Response As you read the responses of your classmates, con.docx
Guided Response As you read the responses of your classmates, con.docx
 
Guided ResponseReview several of your classmates’ posts and res.docx
Guided ResponseReview several of your classmates’ posts and res.docxGuided ResponseReview several of your classmates’ posts and res.docx
Guided ResponseReview several of your classmates’ posts and res.docx
 
Guided ResponseYou must reply to at least one classmate. As y.docx
Guided ResponseYou must reply to at least one classmate. As y.docxGuided ResponseYou must reply to at least one classmate. As y.docx
Guided ResponseYou must reply to at least one classmate. As y.docx
 
Guided ResponseRespond to at least one classmate that has been .docx
Guided ResponseRespond to at least one classmate that has been .docxGuided ResponseRespond to at least one classmate that has been .docx
Guided ResponseRespond to at least one classmate that has been .docx
 

Recently uploaded

Advanced Views - Calendar View in Odoo 17
Advanced Views - Calendar View in Odoo 17Advanced Views - Calendar View in Odoo 17
Advanced Views - Calendar View in Odoo 17Celine George
 
Measures of Dispersion and Variability: Range, QD, AD and SD
Measures of Dispersion and Variability: Range, QD, AD and SDMeasures of Dispersion and Variability: Range, QD, AD and SD
Measures of Dispersion and Variability: Range, QD, AD and SDThiyagu K
 
Arihant handbook biology for class 11 .pdf
Arihant handbook biology for class 11 .pdfArihant handbook biology for class 11 .pdf
Arihant handbook biology for class 11 .pdfchloefrazer622
 
BAG TECHNIQUE Bag technique-a tool making use of public health bag through wh...
BAG TECHNIQUE Bag technique-a tool making use of public health bag through wh...BAG TECHNIQUE Bag technique-a tool making use of public health bag through wh...
BAG TECHNIQUE Bag technique-a tool making use of public health bag through wh...Sapna Thakur
 
SOCIAL AND HISTORICAL CONTEXT - LFTVD.pptx
SOCIAL AND HISTORICAL CONTEXT - LFTVD.pptxSOCIAL AND HISTORICAL CONTEXT - LFTVD.pptx
SOCIAL AND HISTORICAL CONTEXT - LFTVD.pptxiammrhaywood
 
Russian Escort Service in Delhi 11k Hotel Foreigner Russian Call Girls in Delhi
Russian Escort Service in Delhi 11k Hotel Foreigner Russian Call Girls in DelhiRussian Escort Service in Delhi 11k Hotel Foreigner Russian Call Girls in Delhi
Russian Escort Service in Delhi 11k Hotel Foreigner Russian Call Girls in Delhikauryashika82
 
The Most Excellent Way | 1 Corinthians 13
The Most Excellent Way | 1 Corinthians 13The Most Excellent Way | 1 Corinthians 13
The Most Excellent Way | 1 Corinthians 13Steve Thomason
 
Activity 01 - Artificial Culture (1).pdf
Activity 01 - Artificial Culture (1).pdfActivity 01 - Artificial Culture (1).pdf
Activity 01 - Artificial Culture (1).pdfciinovamais
 
Key note speaker Neum_Admir Softic_ENG.pdf
Key note speaker Neum_Admir Softic_ENG.pdfKey note speaker Neum_Admir Softic_ENG.pdf
Key note speaker Neum_Admir Softic_ENG.pdfAdmir Softic
 
Kisan Call Centre - To harness potential of ICT in Agriculture by answer farm...
Kisan Call Centre - To harness potential of ICT in Agriculture by answer farm...Kisan Call Centre - To harness potential of ICT in Agriculture by answer farm...
Kisan Call Centre - To harness potential of ICT in Agriculture by answer farm...Krashi Coaching
 
Holdier Curriculum Vitae (April 2024).pdf
Holdier Curriculum Vitae (April 2024).pdfHoldier Curriculum Vitae (April 2024).pdf
Holdier Curriculum Vitae (April 2024).pdfagholdier
 
IGNOU MSCCFT and PGDCFT Exam Question Pattern: MCFT003 Counselling and Family...
IGNOU MSCCFT and PGDCFT Exam Question Pattern: MCFT003 Counselling and Family...IGNOU MSCCFT and PGDCFT Exam Question Pattern: MCFT003 Counselling and Family...
IGNOU MSCCFT and PGDCFT Exam Question Pattern: MCFT003 Counselling and Family...PsychoTech Services
 
microwave assisted reaction. General introduction
microwave assisted reaction. General introductionmicrowave assisted reaction. General introduction
microwave assisted reaction. General introductionMaksud Ahmed
 
BASLIQ CURRENT LOOKBOOK LOOKBOOK(1) (1).pdf
BASLIQ CURRENT LOOKBOOK  LOOKBOOK(1) (1).pdfBASLIQ CURRENT LOOKBOOK  LOOKBOOK(1) (1).pdf
BASLIQ CURRENT LOOKBOOK LOOKBOOK(1) (1).pdfSoniaTolstoy
 
The basics of sentences session 2pptx copy.pptx
The basics of sentences session 2pptx copy.pptxThe basics of sentences session 2pptx copy.pptx
The basics of sentences session 2pptx copy.pptxheathfieldcps1
 
Web & Social Media Analytics Previous Year Question Paper.pdf
Web & Social Media Analytics Previous Year Question Paper.pdfWeb & Social Media Analytics Previous Year Question Paper.pdf
Web & Social Media Analytics Previous Year Question Paper.pdfJayanti Pande
 
fourth grading exam for kindergarten in writing
fourth grading exam for kindergarten in writingfourth grading exam for kindergarten in writing
fourth grading exam for kindergarten in writingTeacherCyreneCayanan
 

Recently uploaded (20)

Advanced Views - Calendar View in Odoo 17
Advanced Views - Calendar View in Odoo 17Advanced Views - Calendar View in Odoo 17
Advanced Views - Calendar View in Odoo 17
 
Measures of Dispersion and Variability: Range, QD, AD and SD
Measures of Dispersion and Variability: Range, QD, AD and SDMeasures of Dispersion and Variability: Range, QD, AD and SD
Measures of Dispersion and Variability: Range, QD, AD and SD
 
Arihant handbook biology for class 11 .pdf
Arihant handbook biology for class 11 .pdfArihant handbook biology for class 11 .pdf
Arihant handbook biology for class 11 .pdf
 
BAG TECHNIQUE Bag technique-a tool making use of public health bag through wh...
BAG TECHNIQUE Bag technique-a tool making use of public health bag through wh...BAG TECHNIQUE Bag technique-a tool making use of public health bag through wh...
BAG TECHNIQUE Bag technique-a tool making use of public health bag through wh...
 
SOCIAL AND HISTORICAL CONTEXT - LFTVD.pptx
SOCIAL AND HISTORICAL CONTEXT - LFTVD.pptxSOCIAL AND HISTORICAL CONTEXT - LFTVD.pptx
SOCIAL AND HISTORICAL CONTEXT - LFTVD.pptx
 
Russian Escort Service in Delhi 11k Hotel Foreigner Russian Call Girls in Delhi
Russian Escort Service in Delhi 11k Hotel Foreigner Russian Call Girls in DelhiRussian Escort Service in Delhi 11k Hotel Foreigner Russian Call Girls in Delhi
Russian Escort Service in Delhi 11k Hotel Foreigner Russian Call Girls in Delhi
 
Mattingly "AI & Prompt Design: Structured Data, Assistants, & RAG"
Mattingly "AI & Prompt Design: Structured Data, Assistants, & RAG"Mattingly "AI & Prompt Design: Structured Data, Assistants, & RAG"
Mattingly "AI & Prompt Design: Structured Data, Assistants, & RAG"
 
The Most Excellent Way | 1 Corinthians 13
The Most Excellent Way | 1 Corinthians 13The Most Excellent Way | 1 Corinthians 13
The Most Excellent Way | 1 Corinthians 13
 
INDIA QUIZ 2024 RLAC DELHI UNIVERSITY.pptx
INDIA QUIZ 2024 RLAC DELHI UNIVERSITY.pptxINDIA QUIZ 2024 RLAC DELHI UNIVERSITY.pptx
INDIA QUIZ 2024 RLAC DELHI UNIVERSITY.pptx
 
Activity 01 - Artificial Culture (1).pdf
Activity 01 - Artificial Culture (1).pdfActivity 01 - Artificial Culture (1).pdf
Activity 01 - Artificial Culture (1).pdf
 
Key note speaker Neum_Admir Softic_ENG.pdf
Key note speaker Neum_Admir Softic_ENG.pdfKey note speaker Neum_Admir Softic_ENG.pdf
Key note speaker Neum_Admir Softic_ENG.pdf
 
Kisan Call Centre - To harness potential of ICT in Agriculture by answer farm...
Kisan Call Centre - To harness potential of ICT in Agriculture by answer farm...Kisan Call Centre - To harness potential of ICT in Agriculture by answer farm...
Kisan Call Centre - To harness potential of ICT in Agriculture by answer farm...
 
Holdier Curriculum Vitae (April 2024).pdf
Holdier Curriculum Vitae (April 2024).pdfHoldier Curriculum Vitae (April 2024).pdf
Holdier Curriculum Vitae (April 2024).pdf
 
IGNOU MSCCFT and PGDCFT Exam Question Pattern: MCFT003 Counselling and Family...
IGNOU MSCCFT and PGDCFT Exam Question Pattern: MCFT003 Counselling and Family...IGNOU MSCCFT and PGDCFT Exam Question Pattern: MCFT003 Counselling and Family...
IGNOU MSCCFT and PGDCFT Exam Question Pattern: MCFT003 Counselling and Family...
 
microwave assisted reaction. General introduction
microwave assisted reaction. General introductionmicrowave assisted reaction. General introduction
microwave assisted reaction. General introduction
 
BASLIQ CURRENT LOOKBOOK LOOKBOOK(1) (1).pdf
BASLIQ CURRENT LOOKBOOK  LOOKBOOK(1) (1).pdfBASLIQ CURRENT LOOKBOOK  LOOKBOOK(1) (1).pdf
BASLIQ CURRENT LOOKBOOK LOOKBOOK(1) (1).pdf
 
The basics of sentences session 2pptx copy.pptx
The basics of sentences session 2pptx copy.pptxThe basics of sentences session 2pptx copy.pptx
The basics of sentences session 2pptx copy.pptx
 
Código Creativo y Arte de Software | Unidad 1
Código Creativo y Arte de Software | Unidad 1Código Creativo y Arte de Software | Unidad 1
Código Creativo y Arte de Software | Unidad 1
 
Web & Social Media Analytics Previous Year Question Paper.pdf
Web & Social Media Analytics Previous Year Question Paper.pdfWeb & Social Media Analytics Previous Year Question Paper.pdf
Web & Social Media Analytics Previous Year Question Paper.pdf
 
fourth grading exam for kindergarten in writing
fourth grading exam for kindergarten in writingfourth grading exam for kindergarten in writing
fourth grading exam for kindergarten in writing
 

From Correctional Education to School Reentry How Formerly

  • 1. From Correctional Education to School Reentry: How Formerly Incarcerated Youth Can Achieve Better Educational Outcomes Sonia Pace* I. Introduction............................................................................ 128 II. Youth at Re e n t r y .................................................................. 128 III. Relevant Federal Po l ic ie s.................................................. 130 IV. Correctional Education...................................................... 131 V . Education Reentry Transition Services and Programs .133 VI. Obstacles to School Re e n t r y .............................................135 VII. Alternative Schools Offer an “Easy Out” .................... 138 VIII. Recommendations.................................................................1 39 1. Implement individualized, long-term educational planning from intake to discharge...................................................139
  • 2. 2. Encourage greater collaboration between state education agencies, local school districts, and juvenile justice facilities.............................................................................13 9 3. Align correctional education curricula and standards with local school districts......................................................... 140 4. Increase tracking and evaluation of academic outcomes. . 140 5. Place more social workers in public schools to support youth in transition....................................................................... 141 6. Mandate that schools accept formerly incarcerated students............................................................................. 141 7. Increase investment in and funding for correctional education and reentry programs............................... ........ 142 8. Implement best practices in the continuum of educational 128 Texas Journal on Civil Liberties & Civil Rights [Vol. 23:2 services.............................................................................. 143 Conclusion.............................................................................. ..........143 I. Introduction Though education may be essential to reducing the risk of
  • 3. recidivism, research shows that many formerly incarcerated youth still experience dismal educational outcomes.* 1 Each year, approximately 100,000 youths are discharged from juvenile justice facilities and return to their communities2 to face a myriad of challenges, including difficulties with high school reentry3 and diploma attainment.4 Many released juveniles do not return to school.5 By contrast, eighty- eight percent of the general U.S. population graduates from high school or has a GED.6 These outcomes suggest an ineffective continuum of correctional education and school-reentry processes. This Note seeks to identify how correctional education, school-reentry processes, and education-transition programs contribute to the educational outcomes of formerly incarcerated youth. This Note also provides recommendations on how stakeholders can achieve better educational outcomes for youths who have been in correctional settings. E. Youth at Reentry Formerly incarcerated youths are more likely to experience distinct personal and academic challenges at reentry. They are more likely have been involved in child welfare systems, as well as being relatively more likely to be a racial minority or male.7 They are more likely to have
  • 4. *Sonia Pace, M .P.A ff, The LBJ School of Public Affairs at The University of Texas at Austin, 2018; B .A ., University o f W isconsin-M adison, 2010. The author would like to thank Professor Michele Deitch for her guidance. 1 Jennifer Lowman & Shari A. Mamas, Educ. L. Ctr. - PA, Educational Aftercare & Reintegration Toolkit for Juvenile Justice Professionals 15 (2009). 2 Ashley Nellis & Richard Hooks Wayman, Youth Reentry Task Force of the Juv. Just, and Delinq. Prevention Coalition, Back on Track: Supporting Youth G entry from Out-of-Home Placement to the Community 5 (2009). 3 Infra Part II. 4 Infra Part IV. 5 Nat’l Conf. of State Legis., Reentry & Aftercare: Juvenile Justice Guide for Legislators 4 (2011). 6 Camille L. Ryan & Kurt Bauman, U.S. Census Bureau, Educational Attainment in the United States: 2015 1 (2016). 7 See Peter Leone & L ois Weinberg, Ctr. for Juv. Just. Reform, Addressing the Unmet Educational Needs of Children and Youth in the Juvenile Justice and Child Welfare Systems 6-7 (2012) ( “Over the course of a year, almost 800,000 abused or neglected
  • 5. 2018] From Correctional Education to School Reentry 129 experienced trauma and neglect before incarceration, and to have significant need for mental health services and substance abuse treatment.8 They are also more likely to experience poverty and to have financial responsibilities,9 with one in eleven reporting having children of their own.10 Formerly incarcerated youths also face academic challenges. Twenty-three percent of incarcerated youth have learning disabilities, though experts suspect the actual figure may be higher.* 11 These youths are likely to be behind in literacy and schooling when they enter the juvenile justice system; an estimated seventy-five percent of the 150,000 youth in detention in 2009 were high school dropouts, and many were not fully literate.12 Correctional education often does not get students up to speed, in part because it may lack sufficient services for special education, English Language Learner (ELL) programs, and remedial education.13 Furthermore, incarceration during youth—a crucial point of intellectual development—has a fundamentally disruptive effect on education attainment.14
  • 6. All of these factors place formerly incarcerated youth reentering their communities at a high risk of recidivism; over half are re- incarcerated within three years of release.15 In 2015, Former Attorney General Loretta Lynch said of the challenges facing formerly incarcerated people: “[T]oo often, justice-involved individuals who have paid their debt to society confront daunting obstacles to good jobs, decent housing, adequate health care, [and] quality education.”16 To successfully children in the United States are in the foster care system. . . . [S]tatistics show that 19.5 Black children per 1,000 [Black children] are in foster care compared to 16.5 American Indian and Alaskan Native children, 16.1 Pacific Islander children, 10.8 White children, and 10.7 Hispanic children. . . . [And d]ata suggest that girls are less likely to be detained and committed than boys for most categories of delinquent offenses[.]”). 8 U.S. De p’ts of Educ. & Just., Guiding Principles for Providing High-Quality Education in Juvenile Justice Secure Care Settings 1 (2014) (discussing trauma and neglect); Re-entry: Reform Trends, Juv. JUST. Info. Exchange, http://jjie.org/hub/reentry/reform-trends/ [https://perma.cc/5Y3R-M7PZ] (“Over half the youth in the justice system have been found to suffer from mental health or substance use disorders.”). 9 Nat’l Ct r. for Juv. Just. & U.S. Dep’t of Educ. Of f . of Juv. Just, and Delinq. Prevention, Juvenile Offenders and Victims: 2014 National
  • 7. Report 7 (Melissa Sickmund & Charles Puzzanchera eds., 2014). 10 Nat’l Conf. of State Legis. , supra note 5, at 4. 11 See U.S. Dep’t of Educ., Protecting the Civil Rights of Students in the Juvenile Justice System 3 (2016) (noting that students with disabilities represent 12% “of all students in public high schools served by the Individuals with Disabilities Education Act (IDEA)”). 12 Ed Risler & Tom O’Rourke, Thinking Exit at Entry: Exploring Outcomes o f Georgia’s Juvenile Justice Educational Programs, 60 J. Correctional Edu c. 225, 225-29 (2009). 13 See, e.g., U.S. Dep’t of Educ., supra note 11 (highlighting national issues in providing services to youths in correction and spotlighting San Ber nardino County). 14 See Amber Fern & Jill Adams, Ct r . for Juv. Just. Reform, Education and Interagency Collaboration: A Lifeline for Justice-Involved Youth 5 (2016) (“Juvenile justice involvement, such as attending court hearings during school hours, can disrupt students’ school experience.”). 15 David M. Altschuler et a l., The Urban Inst., The Sustainability of Juvenile Programs beyond Second Chance Act F unding: The Case of Two Grantees 1 (2016). 16 Department o f Justice to Launch Inaugural National
  • 8. Reentry Week, U.S. De p’t of Just. (Apr. 130 Texas Journal on Civil Liberties & Civil Rights [Vol. 23:2 divert from this pipeline, youth need the necessary knowledge and skills to secure employment, which will help them to reintegrate into their communities.17 Beyond the devastating effects of insufficient education experienced by formerly incarcerated youth, communities may face negative fiscal impact from low rates of high school graduation. A 2009 study by the Center for Labor Market Studies at Northeastern University found that each high school dropout costs taxpayers over $292,000 in lost tax revenues, incarceration costs, and social services.18 Investing in better correctional and reentry education is thus sound fiscal policy that may yield long-term savings. Indeed, in a 2014 joint letter to state education officials, the Attorney General and Secretary of Education encouraged states to prudently allocate taxpayer dollars to improve correctional education and expand access to vocational education to help improve educational outcomes for justice-involved youth.19
  • 9. in. Relevant Federal Policies There is no federal policy on school reentry regarding formerly incarcerated youth. Youth over the age of sixteen are not always required by state law to return to school.20 The Juvenile Justice and Delinquency Prevention Act of 1974 does not explicitly address the educational needs of students exiting the juvenile justice system.21 Other laws based on different federal policies may apply to students in or exiting the juvenile justice system. The McKinney-Vento Homeless Assistance Act of 1987 provides educational guarantees for any homeless youth.22 The protections of the Individuals with Disabilities Education Act of 1990 (IDEA) guarantee all youth with special needs a “free and 22, 2016), https://www.justice.gov/opa/pr/department-justice- launch-inaugural-national-reentry- week [https://perma.cc/B9KC-BA89]. 17 See id. (discussing formerly incarcerated persons generally). 18 Andrew Sum et a l., Ctr. for Labor Mkt. Studs., The Consequences of Dropping Out of High School 16 (2009). 19 Policy Letter, U.S. DEP’TS OF Educ. & JUST. (Dec. 8, 2014), https://www2.ed.gov/policy/elsec/guid/secletter/141208.html [https://perma.cc/T5BS-CAWX].
  • 10. 20 Compulsory school attendance laws, minimum and maximum age limits for required free education, by state: 2017, Nat’l Ctr. for Educ. Stats. (2015), https://nces.ed.gov/programs/statereform/tab5 l.asp [https://perma.cc/6LA9-KB47] (indicating some states do not require students to attend schools past age sixteen). 21 Re-entry: Reform Trends, supra note 8 (discussing the Juvenile Justice and Delinquency Prevention Act of 1974, Pub. L. No. 93-415, 88 Stat. 1109, and noting that “[w]hile JJDPA funds may be used by states for re-entry services, few states use it for that purpose because they need to direct the limited federal dollars available to comply with the core requirements”); Campaign for Youth Justice, Youth in the Adult System Fact Sheet 2 (2014) (“Although the federal Juvenile Justice and Delinquency Prevention Act (JJDPA) requires that youth in the juvenile justice system be removed from adult jails or be sight-and-sound separated from other adults, these protections do not apply to youth prosecuted in the adult criminal justice system.”). 22 Leone & Weinberg, supra note 7, at 23 (discussing the McKinney-Vento Homeless Assistance Act of 1987, Pub. L. 100-77, 101 Stat. 482). 2018] From Correctional Education to School Reentry 131 appropriate public education,”23 and require adult transition planning for
  • 11. youth with disabilities beginning at age fourteen.24 The No Child Left Behind Act of 2001 established standards for education that apply to the education received in the juvenile justice system.25 The Every Student Succeeds Act of 2015, which replaced the No Child Left Behind Act,26 requires states to ensure certain protections for students in or exiting the juvenile justice system.27 IV. Correctional Education Though juvenile justice facilities are legally required to educate youth in placement under age seventeen,28 the quality of correctional education may differ between jurisdictions. The oversight bodies for correctional education, for example, vary by state: in forty-one states, juvenile justice staff, public education agencies, and private education providers together oversee correctional education; in six states, juvenile justice staff solely oversee it; in three states, public education agencies solely oversee it.29 Education providers also vary by state and facility. Teachers from local school districts in some cases may deliver correctional education.30 In other cases, private contractors, education- department staff, or juvenile justice staff deliver it.31 Private providers frequently execute Memoranda of Understanding with state education
  • 12. departments to provide particular and limited services.32 Given the variations in delivery and oversight, the quality of correctional education likely varies by jurisdiction and site, and in some cases this variation may 23 Lauri Goldkind, A Leadership Opportunity for School Social Workers: Bridging the Gaps in School Reentry for Juvenile Justice System Youths, 33 Child. & Schs. 229, 232 (2011) (discussing the Individuals with Disabilities Education Act, Pub. L. 101- 476, 104 Stat. 1142 (1990)). 24 Healther M. Boltadano, et al., Transition o f Incarcerated Youth with Disabilities Across Systems and Into Adulthood, 13 Exceptionality 103, 104 (2005). 25 See, e.g., No Child Left Behind Act of 2001 § 1414(c)(19), Pub. L. No. 107-110, 115 Stat. 1425 (2002) (codified as amended at 20 U.S.C. § 6434 (2012)) (“ [T]he program under this subpart will be coordinated with any programs operated under the Juvenile Justice and Delinquency Prevention Act of 1974 (42 U.S.C. § 5601 et seq.) or other comparable programs, if applicable.”). 26 See, e.g., Jason P. Nance, Students, Police, and the School - to-Prison Pipeline, 93 WASH. U. L. Rev. 919, 940 n. 103 (2016) (noting replacement). 27 Every Student Succeeds Act § 1401(4)(A)(ii), Pub. L. No. 114-95, 129 Stat. 1802 (2015) (codified as amended at 20 U.S.C. § 6435) (noting the purpose of this part of the law is to “prevent
  • 13. at-risk youth from dropping out of school, and to provide dropouts, and children and youth returning from correctional facilities or institutions for neglected or delinquent children and youth, with a support system to ensure their continued education and the involvement of their families and communities”). 28 Lowman & Mamas, supra note 1, at 15. 29 Council of State Gov’ts Just. Ct r., Locked Ou t: Improving Educational and Vocational Outcomes for Incarcerated Youth 2 (2015). 30 Id. 31 Id. 32 Thomas G. Blomberg et a l., Fla. State U. Ct r. for Crim. and Pub. Pol’y Re s. The Juvenile Justice No Child Left Behind Collaboration Project 61 (2008). 132 Texas Journal on Civil Liberties & Civil Rights [Vol. 23:2 keep youth from closing the gap in their educational achievement relative to their peers. While correctional education curricula and standards might be most effective if aligned with state academic standards,33 this may not always be the case. Students frequently do not earn credit transferrable to public schools for courses completed in detention.34 Correctional
  • 14. education programs also offer fewer math and science courses than public secondary schools.35 Academic standards in correctional education may fall short because of the many challenges teachers face in shaping a curriculum for students with different situations and educational needs: students have different lengths of sentences; students may transfer detention facilities abruptly due to lack of space;36 many students need remedial and special education;37 and, due to limited staffing, students across grade levels and languages often share a classroom.38 Students in juvenile detention are also disadvantaged by lower attendance by and less interaction with their teachers. While technologies such as computer exercises are meant only to enhance correctional education,39 they may sometimes detrimentally replace in- person teacher instruction.40 In addition, a report by the Department of Justice’s Civil Rights Division found that correctional teachers are eight percent more likely to be absent from the classroom for over ten days than teachers in public high schools.41 Students may also face disciplinary measures that interfere with class attendance; for example, youth offenders with disabilities sued Contra Costa County Juvenile Hall in California for frequent use of solitary confinement that resulted in “miss[ing]
  • 15. hundreds of hours of education combined,” violating protections of IDEA.42 33 Paul Hirschfield, E ffective and Promising Practices in Transitional Planning and School Reentry, 65 J. CORRECTIONAL EDUC. 84, 87 (2014). 34 Id. 35 U.S. D e p ’t o f Ed u c ., supra note 11, at 1. 36 Blom berg et a l . , supra note 32, at 56. 37 C ouncil of Sta te Go v ’ts J u st. Ct r . , supra note 29, at 1 (“At least one in three incarcerated youth is identified as needing or already receiving special education services—a rate nearly four times higher than youth attending school in the community.”). 38 U.S. D e p ’ts o f Ed u c . & Ju s t ., supra note 8, at 3 ( “Secure care facilities typically do not have the capacity to provide a ‘traditional’ school setting with individual grade-level classrooms and core subject teachers. Instead, education staff often must provide instruction to students at a variety o f ages and academic levels in one room at the same tim e.”). 39 M ichelle Tolbert, U.S. De p ’t o f Ed u c ., A Reentry Education Mo d e l: Supporting Education and C areer Advancem ent for Low-Skill Individuals in Corrections 6 (2010). 40 Blom berg et a l ., supra note 32, at 51 (“ [0]ne state reported that the result of using the internet to address highly qualified teacher needs has been mixed. Although online classes have allowed each program to address its individual highly qualified
  • 16. teacher needs, one state found that the online instruction has not been as effective as in-person classroom instruction. Specifically, engaging students is more difficult in a virtual classroom .”); U.S. D e p ’ts o f Ed u c . & Ju s t ., supra note 8, at 4 ( “ [Tjechnology should not be used as a substitute for teachers and classroom instruction in a secure setting any more than it would replace classroom teaching and engagement in a regular educational setting.”). 41 5 e e U .S . De p ’t of Ed u c ., supra note 11, at 1 (“While 27% o f teachers nationally are absent more than 10 school days per year for reasons unrelated to school activities, 35% of teachers at justice facilities are absent more than 10 days per year.”). 42 Sarah Cate, The Politics of Prison Reform: Juvenile Justice Policy in Texas, California, and 2018] From Correctional Education to School Reentry 133 Data on student performance and educational outcomes while in correctional education programs is sparse and incomplete. One source of data stems from a mandate from the No Child Left Behind Act,43 which required states to report standardized test scores for youth who have been in custody for one academic year,44 but excludes the test scores of many other students.45 As of 2006, only thirty of forty-three states surveyed by the Center for Criminology and Policy Research had
  • 17. implemented the formal evaluations of their correctional education programs as required by the Act.46 Another source of data comes from efforts by some states to track attainment of transferable credits, high school diplomas, and GEDs by incarcerated youth in correctional education:47 as of 2015, twenty-seven states tracked attainment of transferrable post- secondary credits; forty-six tracked high school diploma attainment; and eighteen tracked attainment of post-secondary degrees.48 V . Education Reentry Transition Services a nd Programs Some states provide transition services to support youth reentering their communities. Research shows that engagement is the most important factor for youth during the transition process, and that the type of reentry program—educational, vocational, or community- oriented—is less important to diversion from recidivism than engagement.49 One of the earliest developed and most commonly used models for reentry programs is the Intensive Aftercare Program (IAP), developed in 1994 by researchers David Altschuler and Troy Armstrong.50 IAP includes reentry services commonly considered best practices today, such as continuity of care, family involvement, and cultural
  • 18. competency.51 Evaluations of IAP, however, still show relatively high recidivism rates for participating youth that are equivalent to rates of the control group.52 Pennsylvania 139 (Jan. 1, 2016) (Ph.D. dissertation, University of Pennsylvania), https://repository.upenn.edu/cgi/viewcontent.cgi?article=3425& context=edissertations. 43 No Child Left Behind Act of 2001, Pub. L. No. 107-110, 115 Stat. 1425 (2002). 44 Peter Leone & Candace Cutting, Appropriate Educations, Juvenile Corrections, and No Child L eft Behind, 29 Behavioral Disorders 260, 263 (2004). 45 Id. 46 BLOMBERG ET al. , supra note 32, at 17, 43. 47 Locked Out, supra 29, a l l . 48 Id. 49 William H. Barton & G. Roger Jarjoura, Applying a Developmental Lens to Juvenile Reentry and Reintegration, 1 J. of Juv. Just. 95, 97-98 (2012). 50 Id. at 95. 51 See, e.g., Re-entry: Reform Trends, supra note 8 (“The IAP model focused on ‘the identification, preparation, transition, and re-entry of ‘high- risk’ juvenile offenders from secure confinement back into the community in a gradual, highly structured, and closely monitored fashion. ’ This model was one of the first to acknowledge that effective aftercare planning must begin from the moment a young person enters a correctional
  • 19. facility.”). 52 Barton & Jarjoura, supra note 49, at 95-96. 134 Texas Journal on Civil Liberties & Civil Rights [Vol. 23:2 To work toward better educational outcomes, states must commit sufficient resources to reentry planning. Texas is among the states that appear to have invested significantly in such planning. The Texas Juvenile Justice Department’s (TJJD) education goal is to “provide each youth quality academic and vocational experiences in order to better equip them for a successful reentry into community life.”53 TJJD begins reentry planning at the moment of intake by creating the plan by doing “a comprehensive and accurate assessment,” and continues these assessments “at regular intervals during the youth’s time in” custody.54 TJJD also employs Education Reentry Liaisons and Workforce Development Re-entry Specialists in both its facilities and parole offices to assist with navigating the school reentry process, preparing for GED exams, finding vocational training opportunities, and otherwise achieving a post-secondary education.55 Texas has also pursued additional programs in the past, such as the now-discontinued Gang Intervention Treatment:
  • 20. Reentry Development for Youth (GitRedy) initiative in Houston that had some success in developing strategies for reentry services.56 A state may also use federal funding for its youth reentry services, though availability of such funding is limited. The Department of Labor formerly offered some funding through Youth Opportunity Grants as part of the Workforce Investment Act of 1998.57 The thirty-six grants under this program ranged in amount between $3.1 and $43.8 million and served more than 90,000 youths aged fourteen to twenty-one in high- poverty communities.58 In 2007, the Second Chance Act59 provided the Department of Justice with $53 million to fund state and local reentry programs and the evaluation of correctional education, meant to reduce recidivism among youth and adults.60 The federal government recently issued voluntary guidelines meant to help states decrease the school dropout rate and improve reentry transitions. In 2012, the Department of Education issued a Reentry Education model as an evidence-based approach to aligning correctional and educational services.61 The model recommends staff training, data 53 TJJD Strategic Plan 2015-2019, Tex. Juv. Just. De p’t (Apr.
  • 21. 11, 2017), https://www.tjjd.texas.gov/programs/education.aspx [https://perma.cc/67KB-EJVS] . 54 Tex. Juv. Just. Dep’t , Comprehensive Report: Youth Reentry and Reintegration 7 (2012). 55 TJJD Strategic Plan, supra note 53, at 52. 56 Altschuler et a l., supra note 15, at 5 (“Since the end of the Second Chance Act grant in September 2014, GitRedy has not continued funding the staff positions of project reentry specialist and gang intervention specialist, and as such the program has been formally terminated. ”). 57 Linda Harris, Ctr. for L. and Soc. Pol’y , Learning from the Youth Opportunity Experience 3 (2006); see also Workforce Investment Act of 1998 § 169, Pub. L. 105-220, 112 Stat. 936 (codified at 29 U.S.C. § 2811) (section entitled “Youth Opportunity Grants”). 58 Harris, supra note 57 at 3-4. 59 Second Chance Act of 2007, H.R. 1593, 110th Cong. (2008). 60 Attorney General Loretta E. Lynch Delivers Remarks at Second Chance A ct - Justice and Mental Health Collaboration Program National Conference, U.S. Dep’t of Just. (Dec. 16, 2015), https://www.justice.gov/opa/speech/attorney-general-loretta-e- lynch-delivers-remarks-second- chance-act-justice-and-mental [https://perma.cc/CF29-G7JU]. 61 Michelle Tolbert & Laura Rasmussen Foster, U.S. De p’t of
  • 22. Educ., Reentry 2018] From Correctional Education to School Reentry 135 tracking of long-term student outcomes, and formal evaluation of correctional education.62 The model’s stated goal is “long-term employment in living-wage occupation without recidivating.”63 State divisions may also directly collaborate on improving reentry services. The Family Court and the Department of Human Services in Philadelphia, for example, led a 2005 reintegration initiative to improve correctional education and reentry processes.64 Not long before the improvements, as little as ten percent of youth placed in the Philadelphia juvenile justice system graduated from Philadelphia public schools.65 As a result of the collaboration, the city established a “streamlined” record transferal process, created a dual-credit program with a local community college, accelerated high schools for older youth, and evening programs for students with daytime jobs.66 By 2008, thirty-one percent of the youth released from placement received a high school diploma, GED, or both.67 VI. Obstacles to School Reentry
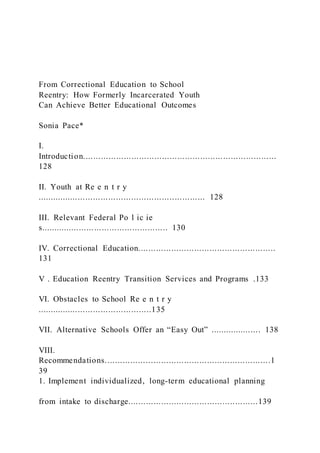
  • 23. Certain state laws can hinder or disincentivize reenrollment. The maximum age until which free public education is guaranteed, for example, is lower in some states than others; as of 2015, the maximum age was seventeen in one state, nineteen in two states, twenty in nine states, and twenty-one or older in thirty-one states.68 See Figure 1. The age until which school attendance is compulsory is higher in some states than others; as of 2015, this age was sixteen in fifteen states, seventeen in eleven states, and eighteen in twenty-four states.69 See Figure 2. Education Framework: Guidelines for Providing High-Quality Education for Adults Involved in the Criminal Justice System 6 (2016). 62 Tolbert, supra note 39, at 5. 63 Tolbert, supra note 61, at 5. 64 Robert G. Schwartz, Juv. L. Ct r., Pennsylvania and MacArthur’s Models for Change: The Story of a Successful Public-P rivate Partnership 18 (2013); Patrick Griffin & Mary Hunninen, Nat’l Ct r. for Juv. Just. , Pennsylvania Progress: Preparing Youth for Productive Futures 2 (2008). 65 Griffen & HUNNINEN, supra note 64, at 3 (noting that a study between 2000 and 2005 found that “in one cohort analyzed, 90% of those with a juvenile justice placement never graduate from
  • 24. the Philadelphia School system, [with] some of them compietfing] school in placement [but with] the vast majority simply dropping] out”). 66 Id. at 3, 6. 67 Re-entry: R eform Trends, supra note 8. 68 Compulsory school attendance law s, supra note 20 (noting that Texas has the highest age until which free education is offered, at twenty-six). 69 Id. 136 Texas Journal on Civil Liberties & Civil Rights [Vol. 23:2 10 9 8 7 6 5 4 3 2 1 0 Age Until Which Free Public Education is Guaranteed by Number of States, 2015 Figure 1 Age Until Which School Attendance is Compulsory by Number of States, 2015
  • 25. 16 17 18 Figure 2 Administrative practices within local school districts may also be complicated. Some local school districts do not always grant students course credit for correctional education.70 More difficult record transfer procedures, in place partly due to the privacy protections of student 70 Hirschfield, supra note 33, at 87. 2018] From Correctional Education to School Reentry 137 records under the Family Educational Rights and Privacy Act of 1974,71 can create unintended complications. Long and complex registration procedures can result in postponement of reenrollment until the start of the next school semester.72 Certain documentation requirements, such as proof of age, residence, and immunizations, can pose barriers to reenrollment.73 These difficulties and delays can have a dramatic effect on the likelihood that released youths will return to school. Public school districts may also be reluctant to accept formerly incarcerated youth.74 These schools perhaps fear that accepting formerly incarcerated youth will negatively affect standardized test score
  • 26. averages, graduation rates, and school attendance rates. These kinds of concerns may be some of the major issues today in policy discussions around school reentry. Public school districts may also be concerned about the safety implications of enrolling formerly incarcerated youth,75 despite the fact that the majority of the released youth committed only nonviolent offenses.76 Some school districts will narrowly elect to not reenroll youth convicted of a sex offense.77 More broadly, other school districts may not enroll students who have been expelled for any reason from a school within the system.78 These obstacles to school reentry, combined with conditions of release, can push youth into alternatives. Regular school attendance may perhaps be a condition of probation, the violation of which can quickly result in re-incarceration. Such a condition may have the effect of pushing youth who cannot enroll in public schools into alternate education, discussed infra, and GED programs.79 Released youth, once enrolled, may also lack the means or incentives to stay in school or remain engaged in work. A longitudinal study in Oregon by the Transition Research on Adjudicated Youth in
  • 27. Community Settings (TRACS) project, for example, found a significant drop in continuing enrollment or work engagement shortly after release; findings indicated that at six months after release, forty-seven percent of 71 Leone & Weinberg, supra note 7, at 22 (discussing the Family Educational Rights and Privacy Act of 1974, Pub. L. No. 93-380, 88 Stat. 5). 72 Id. at 25. 73 Lowman & Mamas, supra note 1, at 26. 74 See infra Part VII. 75 5e,e, e.g., Michael Bullisetal., L ife o n th e “O uts”— Examination o f the Facility-to-Community Transition o f Incarcerated Youth, 69 Exceptional Child. 7,19 (2016) (noting that “there is reason to incarcerate youth who commit certain crimes for the reason of public safety”). 76 NELLIS & Wayman, supra note 2, at 13 (“Nearly two-thirds of juveniles in out-of-home placements are held for nonviolent offenses.”). 77 Ashley Nellis, A ddressing the Collateral Consequences o f Convictions for Young Offenders, The Champion, 24 July/August 2011, at 24. 78 Juv. L. Ct r., Justice for Juveniles: Youth Recommendations to Improve Educational Outcomes for Youth in the Juvenile Justice System 11 (2015) (discussing zero tolerance policies).
  • 28. 79 Lowman & Mamas, supra note 1, at 21. 138 Texas Journal on Civil Liberties & Civil Rights [Vol. 23:2 the 531 youth participants were engaged in school or work, but at one year after release, only thirty-one percent of the participants remained engaged.80 The study also found that participants with learning disabilities experienced worse educational and employment outcomes.81 VII. Alternative Schools Offer an “Easy Ou t ” Some school districts may recommend released youth enroll in or transfer to alternative schools. According to a 2008 survey by the Department of Education, forty-two percent of public school districts administered alternative schools and programs meant for students previously arrested or involved in the juvenile justice system.82 Some states have no protections limiting the ability of school districts to refuse to enroll previously incarcerated youth in their main school systems.83 Other states may only have certain procedural protections. Alternative schools and programs are controversial. Some commentators celebrate the success of prominent programs such as the Maya Angelou Public Charter Schools in Washington, D .C .84 Others
  • 29. question if alternative school programs consistently provide sufficient educational quality.85 On this point, a former director of the Maya Angelou Charter Schools said, “If you want to see really dysfunctional schools, just go visit the designated alternative schools in any city around the country. These schools are just dumping grounds where schools throw kids they don’t want to deal with. . . . [Their] presence just gives everybody an easy o u t.”86 80 Bullis et al., supra note 75, at 7 (summarizing the Transition Research on Adjudicated Youth in Community Settings (TRACS) project, a longitudinal study published in 2002 that tracked 531 youth released from juvenile justice facilities in Oregon over five years and sought to identify factors that contributed to success upon community reentry). 81 S e e id. at 18 (“[It] is clear that participants with special education disabilities fared worse than their peers without disabilities.”). 82 Priscilla R. Carver et al., Nat’l Ct r. For Educ. Stats., Alternative Schools and Programs for Public School Students At Risk of Educational F ailure: 2007-08 11 (2010). 83 JUV. L. CTR., su/ranote 78, at 11. 84 See Amber Farn & Jill Adams, Ctr. for Juv. Just. Reform, Education and
  • 30. Interagency Collaboration: A Lifeline for Justice-Involved Youth 10-11 (2016) (discussing the successes of students at Maya Angelou Academy at New Beginnings). 85 S e e Melinda D. Anderson, Learning Behind Bars, The Atlantic (Jun. 6, 2016), https://www.theatlantic.com/education/archive/2016/06/learning -behind-bars/485663/ [https://perma.cc/86CJ-SYWX] (discussing the fact that education quality in correctional settings can vary greatly). 86 See Forever Board, Maya Angelou Schools See Forever Foundation, http://www.seeforever.org/the-foundation/see-forever-board/ [https://perma.cc/BQ5M-GNAF] (quoting David Domenici, Director of the Center for Educational Excellence in Alternative Settings). 2018] From Correctional Education to School Reentry 139 vm. Recommendations 1. Implement individualized, long-term educational planning from intake to discharge. From the moment of intake, correctional staff should develop and implement an individualized educational plan for each student that both targets specific educational outcomes and contains possible routes for school reentry. One example of a model for this approach is Georgia’s
  • 31. Student Transition Model, which includes a four-stage timeline for correctional education: intake, ongoing educational activities, review for release, and a formal exit interview.87 Correctional staff compiles important documents in a student portfolio, which contains official documentation of previous academic records, completed correctional education, and information on next steps for reenrollment.88 To further facilitate education reentry, correctional staff should give the student a transition portfolio consisting of official documentation of completed correctional education and information on next steps for reenrollment, including application timeliness and credit equivalency charts, to facilitate knowledge about the reenrollment process. 2. Encourage greater collaboration between state education agencies, local school districts, and juvenile justice facilities. Policymakers should encourage greater collaboration on correctional education between state and local education agencies, local school districts, and juvenile justice facilities. Policymakers should help standardize and streamline the education reenrollment process, including increased use of integrated electronic systems. Juvenile justice facilities should work directly with home school districts to timely transfer records
  • 32. and place students immediately upon release. They should also connect the released youth with probation departments, child welfare systems, mental health agencies, and community organizations to help initiate wraparound aftercare services. In particular, similarly focused probation departments may aid the reentry process; Pennsylvanian probation officers, for example, improved their rates of reenrolling youth under their supervision in public school after training to advocate education reentry.89 87 Ed Risler & Tom O ’Rourke, Thinking Exit at Entry: Exploring Outcomes o f Georgia’s Juvenile Justice Education Programs, 60 J. Correctional Educ. 225, 230 (2009). 88 Id. 89 See Schwartz, supra note 64, at 21 ( “Probation officers became education advocates. They 140 Texas Journal on Civil Liberties & Civil Rights [Yol. 23:2 Some private parties help create the necessary connection between education and justice departments. A New York City nonprofit organization, for example, supports reentry by assessing current levels of student education, expediting school reenrollment and record transfer
  • 33. where possible, and tutoring students in reading.90 Program data on student outcomes indicate a sixty-six percent student retention rate, on average, from one academic year to the next.91 3. Align correctional education curricula and standards with local school districts. Policymakers should align correctional education curricula and standards with those of local school districts. Students should always be able to earn transferrable course credit for schooling completed in detention. State correctional education standards, when fully aligned with local school district standards, could provide benchmarks of quality related to minimum daily hours of classroom instruction, maximum student-teacher ratios, and minimum teacher credentials. Aligned educational standards could also make available professional development opportunities, instruction for English Language Learners in their native language, services for students with learning disabilities and remedial needs, and a more complete offering of core courses. 4. Increase tracking and evaluation o f academic outcomes. Long-term academic outcomes for students who formerly attended correctional education should be tracked. Thi s tracking should include data points that measure performance and completion in
  • 34. correctional courses as well as subsequent secondary and post- secondary courses, attainment rates for high school diplomas and General Education Development (GED) certificates, performance and completion in any vocational training programs, and results from evaluations of the efficacy of local correctional education led by State juvenile justice departments. Policymakers can then use this information to inform and develop policy change and reform. State juvenile justice departments may vary in evaluation methods for their correctional education programs. If cost permits, state were much more successful with school enrollment when youth left placement.”). 90 Cora Roy-Stevens, U.S. Dep’t of Just. , Overcoming Barriers to School Reentry 1- 2 (2004) (discussing services available at Community Prep High School, a transitional school for students who are ready to attend community schools on release from custody). 91 Id. 2018] From Correctional Education to School Reentry 141 juvenile justice departments may develop their own evaluation methods
  • 35. for correctional education and perform these evaluations on a regular and formal basis; if budgets are constrained, they should at a minimum implement wider use of already available evaluation tools modeled after publicly available options. The State Correctional Education Self- Assessment (SCES) tool developed by the Department of Education, for example, is publicly accessible online to help state governments complete voluntary self-assessments of special education within correctional programs.92 5. Place more social workers in public schools to support youth in transition. Policymakers should place more social workers in public schools to emphasize transition services around release and to provide integral support to youths. The process of school reenrollment frequently throws youth off-track.93 Social workers can act as liaisons between schools and correctional staff at juvenile justice facilities to smooth the transition and increase reenrollment. 6. Mandate that schools accept formerly incarcerated students. Due to the poor educational quality of many alternative programs,94 state legislators should support legislation to remove barriers
  • 36. to school reenrollment for formerly incarcerated youth. States should follow the lead of Connecticut95 and Washington,96 which have laws favorable to youths that may allow them to be more easily readmitted or otherwise protect them from being expelled in certain circumstances. 92 U.S. Dep’t of Educ. Of f . of Spec. Ed u . Programs (OSEP), State Correctional education Self-Assessment (SCES) (2014) (“The Office of Special Education Programs (OSEP) has developed a voluntary State Correctional Education Self- Assessment (SCES) to assist States in self-assessing their systems for providing special education and related services to students with disabilities in correctional facilities.”). 93 See supra Part IV. 94 See Anderson, supra note 85 (discussing the fact that education quality in correctional settings can vary greatly). 95 See Conn. Gen. Stat. § 10-233d (2017) (requiring boards of education to readmit students to the district if such student has been in an out-of-district placement in lieu of expulsion). 96 See, e.g., Wash. Rev. Code § 28A.635.020 (protecting students’ freedom of speech while in school).
  • 37. 142 Texas Journal on Civil Liberties & Civil Rights [Vol. 23:2 7. Increase investment in and funding for correctional education and reentry programs. States and the federal government should increase investment and funding for correctional education. This investment may be needed for adequate staffing97 and will likely yield long-term savings. A 2009 study by the RAND Corporation found that each dollar invested in adult correctional education returns five dollars in savings during the first three years following release.98 Given the importance of education for youth in transition, it seems likely that similar investments in juvenile correctional education would yield similar, if not greater, benefits. Availability of federal funding should be revisited and increased. For example, the Department of Education in 2016 allocated a small federal grant of $5.6 million to only four secondary and post- secondary grantees across the country.99 Many more programs likely need this kind of funding to improve their correction education. A 2012 report by educational foundations and stakeholders recommended that policymakers amend the Elementary and Secondary Education Act (ESEA) to require states and localities to use ESEA funding in part for
  • 38. educational services for reentering youth, with accountability to the Department of Education.100 Policymakers could also revisit federal funding formulas101 for state and local education to incentivize spending on reentry services, and expand eligibility for federal Pell grants102 that support post-secondary education to include funding at the secondary school level. 97 SeeU.S. Dep’t OF EDUC., supra note 11, at 1 (“While 27% of teachers nationally are absent more than 10 school days per year for reasons unrelated to school activities, 35% of teachers at justice facilities are absent more than 10 days per year.”). 98 Lois M. Davis et a l., Rand Corp., How Effective Is Correctional Education, and Where Do We Go from Here?: The Results of a Comprehensive Evaluation 78 (2014) (“Our meta-analysis results . . . suggest that . . . for every dollar spent on correctional education programs, five dollars are saved in three-year reincarceration costs.”). 99 Education Department Announces New Tools to Support Successful Reentry for Formerly Incarcerated Youth and Adults, U.S. De p’t of Educ. (Apr. 25, 2016), https://www.ed.gov/news/press-releases/education-department- announces-new-tools-support- successful-reentry-formerly-incarcerated-youth-and-adults [https://perma.cc/BY37-6NMT].
  • 39. 100 Juv. Law Ct r. et al., TOOL IX: Federal Policy Recommendations 10 (2013) (discussing the Elementary and Secondary Education Act (ESEA), Pub. L. 89-10, 79 Stat. 27 (1965)). 101 For more information on federal funding formulas, see How Do School Funding Formulas Work?, Urban Inst. (Nov. 29, 2017), https://apps.urban.org/features/funding-formulas/ [https: //perma. cc/YWN 3-2R4F]. 102 For more information of federal Pell grants, see Federal Pell Grant Program, U.S. Dep’t of Educ. , https://www2.ed.gov/programs/fpg/index.html [https://perma.cc/VD2X-HHL9]. 2018] From Correctional Education to School Reentry 143 8. Implement best practices in the continuum o f educational services. States should consider implementing the following best practices in the continuum of educational services: First, states should ensure sufficient reentry planning. States should start planning at intake and continue planning through release, identify skill-building opportunities, complete a transition portfolio, and collaborate and share information between agencies during the process.
  • 40. Second, states should ensure quality correctional education. Sates should create an individualized case plan with defined outcomes; align curricular with local school districts; offer remedial, ELL, and special education services; offer sufficient core courses; and conduct regular and formal evaluations of their programs. Third, states should give proper emphasis to transitional services. Sates should coordinate with probation departments, emphasize engagement, provide access to affordable GED testing and preparation, and provide access to vocational training. Lastly, states should focus on school reentry services. States should transfer records in a timely manner, reenroll students within two days of release, ensure students earn transferable credits, and provide classes with evening and weekend hours offered at alternative schools. Conclusion Central to juvenile justice reform are the principles that the rights and welfare of youth in the system matter and that this population is not expendable. Strengthening correctional education and reentry services will provide a powerful and desperately needed means to mend the damage caused by the school-to-prison pipeline and
  • 41. criminalization of underprivileged minorities in the criminal justice system in the United States. 103 Education must become a higher priority for stakeholders, as it represents a crucial component of how youth involved in the juvenile justice system may work toward better life outcomes and reduce their likelihood of recidivism. The evidence outlined in this Note points to the need for increased investment and innovative solutions that strengthen correctional education, remove barriers to school reentry, and provide released youth with the support and tools they need to succeed. 103 See Christopher A. Mallett, The School-to-Prison Pipeline, 49 Educ. & Urban Soc’y 563, 572-73 (2017) (referencing the connection between race and juvenile corrections). 144 Texas Journal on Civil Liberties & Civil Rights [Vol. 23:2 Copyright of Texas Journal on Civil Liberties & Civil Rights is the property of University of Texas at Austin School of Law Publications and its content may not be copied or emailed to multiple sites or posted to a listserv without the copyright holder's express written permission. However, users may print, download, or email articles for individual use.
  • 42. Vol.:(0123456789)1 3 Child and Adolescent Social Work Journal (2018) 35:577–585 https://doi.org/10.1007/s10560-018-0549-1 School, Social-Communicative, and Academic Challenges Among Delinquents and Juvenile Sexual Offenders Kevin Tan1 · Adam Brown2 · George Stuart Leibowitz3 Published online: 30 May 2018 © Springer Science+Business Media, LLC, part of Springer Nature 2018 Abstract This study explores the association between student factors and delinquency by comparing two groups of adjudicated youth in six Midwestern residential facilities: 331 young men committed for a sexual offense, and 171 committed for a nonsexual offense. Statistically significant findings include juvenile sexual offenders exhibiting a greater number of delinquent behaviors and greater academic and social difficulties compared with their counterparts adjudicated for a nonsexual offense. Addition- ally, path analysis revealed that school experience was negatively associated with delinquency for both groups. For juvenile sexual offenders, academic difficulties were associated with delinquency through their school experience. Among general delinquents, delinquency was directly associated with social
  • 43. difficulties and school experience. Implications for interven- tions and future research are discussed. Keywords Adolescent sexual offending · Delinquency · School experience · Academic difficulties · Social difficulties A range of school-related stressors, such as poor school experience and social communicative and academic dif- ficulties are strongly associated with crime among youth (Agnew, 2009). Youth who have committed sexual offenses (juvenile sexual offenders, JSOs) tend to have high levels of co-occurring general delinquency (Brown & Burton, 2010; van Wijk et al., 2006) and share many characteristics with youth offenders who have committed nonsexual offenses (general delinquents, GDs; Seto & Lalumière, 2010). Fail - ures in school bonding and academic achievement during early adolescence are well established correlates of prob- lem behaviors and delinquency in late adolescence (Hoff- mann, Erickson, & Spence, 2013; Welsh & Harding, 2015). Strong evidence also associates lack of school-related social competencies such as communication abilities with delin- quency (Gottfredson, 2017). This study therefore compares school-related stressors between JSOs and GDs, an area past research has ignored. A recent study comparing JSOs to GD shows that gen- eral delinquency and property damage significantly pre- dicted membership in the JSO group (Leibowitz, Akakpo, & Burton, 2016). However, to the best of our knowledge, only one study has compared JSOs to GDs using a school- based indicator. This study relies on population-based data from Sweden (Kjellgren, Priebe, Svedin, & Långström, 2010). It found that GDs were more likely than JSOs to be in a vocational school as opposed to an academic-based program (Kjellgren et al., 2010). However, the authors did
  • 44. not hypothesize as to the significance of this finding. This finding might suggest that the relationship between school- based factors and delinquency looks different for JSOs than GDs. If so, school-based delinquency interventions for JSOs might benefit from different approaches than those designed for GDs. Hence, the purpose of this study is to compare the role of school experience and social communicative and academic difficulties on delinquency among JSOs and GDs. Findings have implications for practice with children and adolescents in understanding and preventing delinquency, especially among JSOs. The literature refers to school experience by many terms, including “school bonding,” “school engagement,” and “school connectedness” (Blum, 2005; Jonson-Reid, 2009). * Kevin Tan [email protected] 1 School of Social Work, University of Illinois at Urbana- Champaign, Urbana, USA 2 Silberman School of Social Work, Hunter College, The City University of New York, New York, USA 3 School of Social Welfare, Stony Brook University, Stony Brook, New York, USA 578 K. Tan et al. 1 3 All have a strong inverse link with negative behaviors by adolescents (Blum, 2005; Fredricks, Blumenfeld, & Paris, 2004; Jonson-Reid, 2009; Maddox & Prinz, 2003; McNeely,
  • 45. Nonnemaker, & Blum, 2002). For example, having the abil- ity to make and maintain friendships in school and/or the experience of academic success may contribute to a positive school experience (Blum, 2005; Jonson-Reid, 2009). Such positive encounters are important, as failure to cultivate encouraging experiences might result in young people turn- ing to crime as a means of alleviating the negative emotions associated with school (Agnew, 2009). As such, in order to foster positive feelings of school among JSOs and GDs, it is important to identify potential sources of school stressors and to understand how they may relate to delinquency. A number of factors can influence a student’s experience at school. For instance, strong evidence shows that race/ ethnicity affects a student’s overall experience in school, as African American youth proportionally encounter more academic struggles in school than White youth (Rocque & Paternoster, 2011). African American youth tend to be over - represented in juvenile detention settings (Pettus-Davis & Epperson, 2015). However, White youth tend to represent the greatest number of JSOs (Burton & Ginsberg, 2012; Kernsmith, Craun, & Foster, 2009); African-American GDs are more likely than white GDs to have committed nonsexual violence (Felson & Kreager, 2014). A deeper understanding of how race/ethnicity functions in the connection between delinquency and the school expe- rience might highlight some important differences between JSOs and GDs. An understanding of the impact of educa- tional disability and the attending risk of being victimized in school than their peers is also a significant contribution to the literature (Rose, Monda-Amaya, & Espelage, 2010). Often, a learning disability diagnosis is associated with aca- demic abilities and social communicative skills (Espelage, Rose, & Polanin, 2015). Findings with respect to both race and learning disabilities have important implications for
  • 46. social workers, particularly school practitioners. First, the over-representation of African-American youth in juvenile detention settings requires a social work ethical response (Pettus-Davis & Epperson, 2015). Second, findings with respect to all of these factors can support early interventions to prevent delinquency among students who display signifi - cant needs in their school social-communicative abilities. In light of the association between a young person’s aca- demic ability and school success (Blum, 2005; Jonson-Reid, 2009), social communicative skills, which include the abil- ity to resolve conflicts and maintain relationships in school (Merrell & Gimpel, 2014) are important. Despite being con- ceptually distinct constructs, academic and communicative deficits are highly correlated; students with poor communi- cative skills are very likely to have lower academic abilities and vice versa (Riggio, Messamer, & Throckmorton, 1991). Furthermore, both poor communicative skills and lower aca- demic abilities are highly associated with delinquent behav- iors (Clegg, Stackhouse, Finch, Murphy, & Nicholls, 2009; Katsiyannis, Ryan, Zhang, & Spann, 2008). The inability to achieve positively valued goals, such as academic success, or the loss of positively-valued stimuli, such as having friends at school, are likely to be great sources of strain in a young person’s life that could lead to delinquency (Agnew, 2009). The extent to which academic abilities and social com- munication are associated with delinquency may differ between JSOs and GDs. For instance, while researchers have not explored the link between school experience and delinquency among JSOs, JSOs tend to have lower measures of general intelligence and memory functioning than GDs (Cantor, Blanchard, Robichaud, & Christensen, 2005; Seto & Lalumière, 2010), which would likely affect academic ability. Very little attention has been paid to how levels of
  • 47. social competence might distinguish these groups. If young people with lower cognitive and communicative function- ing tend to struggle in their academics and social interac- tions, it makes sense that they might experience school less positively than those without these issues might. The addi - tional strains they experience as a consequence of this type of school experience may, in turn, expose them higher risk of engaging in criminological activities (Agnew, 2009; Ben- nett, Farrington, & Huesmann, 2005; Hawkins, Catalano, Kosterman, Abbott, & Hill, 1999). Given the potential for quality of school experience, aca- demic abilities, and social communication and background factors to differ between JSOs and GDs, this study seeks to compare how these student factors may differ. Based on the literature, we hypothesize that academic and communicative difficulties correlate with each other for both groups, but that JSOs will report higher levels of academic and com- municative difficulties and lower levels of positive school experience than GDs. We also hypothesize that, after taking race and special education status into account, the quality of school experience is inversely associated with delinquency in both groups. Lastly, we believe that academic and com- municative difficulties are inversely associated with positive school experience and positively linked with delinquency for the two groups. Methods School Experiences Participants and Procedures Participants were incarcerated male juveniles, ages 12–20 (n = 502), recruited from six residential facilities in a
  • 48. 579School, Social-Communicative, and Academic Challenges Among Delinquents and Juvenile Sexual… 1 3 Midwestern state. Juvenile sexual offenders are likely to be male (Barbaree & Marshall, 2008). Among our sample, 331 (66%) were adjudicated for sexual offenses and 171 (34%) for non-sexual crimes. Among these participants, 321 JSOs and 155 GDs’ responses were suitable to be used for this study’s analyses, as the other participants had a high degree of missing values on some measures used in this study, and it was not possible to impute. There was no difference between juveniles left out due to missing responses and those used in this study. After approval from the State Department of Youth Services Institutional Review Board (IRB), self-reported measures were administered using pencil and paper surveys in a small group format (6–8 participants) in classrooms. Youths were separated to ensure that they could not view one another’s responses. A trained graduate student research assistant read the survey aloud individually to those youths who struggled with reading. Participants received no incen- tive to complete the survey. Those youths who refused to participate (approximately 30%) were proportionately dis- tributed across the six facilities. It was not possible to com- pare data on those who declined vs. those who consented to participate. Measures Academic Difficulties
  • 49. Academic difficulties were based on the sum of five ques- tions that assessed problems in reading, writing and math, such as “how difficult is/was reading for you?” and “how dif- ficult is/was math for you?” “How difficult was/is penman- ship (writing letters or numbers) for you?” “How difficult was/is spelling for you?” “How difficult was/is it for you to write your thoughts on paper?” These are standard ques- tions used to assess academic difficulties (Johnston, 1985). Cronbach’s alpha for this measure was 0.75. Participants chose from five responses ranging from “1” = no difficulties at all to “5” = a great degree of difficulty. A higher overall score would suggest more struggles in academic difficulties. Social Communicative Difficulties The measure for communicative difficulties was constructed from the sum of six questions that examined struggles in understanding and communicating thoughts and feelings. The following questions were asked: “How much difficulty did/do you have understanding what others were saying to you?” “How difficult was/is it for you to communicate with others?” “How difficult was/is it for you to communicate your feelings to others?” “How difficult was/is it for you to communicate your ideas/thoughts to others?” “How dif- ficult was/is it for you to understand spoken directions?” and “How difficult was/is it for you to understand written direc- tions?” These are frequently used questions to assess social- communicative difficulties (Kaczmarek, 2002). Cronbach’s alpha = 0.78. Similar to academic difficulties, participants chose from five responses ranging from “1” = no difficulties at all to “5” = a great degree of difficulty. School Experience The quality of school experience was measured using a sin-
  • 50. gle item asking respondents to rate the degree to which they liked school during their elementary and secondary school years up until the time of their incarceration. Participants chose from a scale of 1 to 5, with a higher score indicating a more positive school experience. Delinquency Delinquent behaviors were assessed using the Self-Reported Delinquency (SRD) scale (Elliott, Huizinga, & Menard, 1989), which measured delinquent behaviors based on 32 questions, such as “before I was arrested, I sold marijuana/ pot/weed/hash,” and “I hit or threatened to hit one of my par - ents.” For each question, respondents were asked to rate on a scale of “1,” indicating that they did not exhibit that behav- ior, to “7,” which indicated that they displayed the behavior “two to three times a day.” Responses from the 32 questions were added together to provide a measure of delinquency. A higher overall score would suggest a higher involvement or greater intensity in delinquent behaviors. Cronbach’s alpha was 0.97. Race/Ethnicity and Special Education Status Race/ethnicity and special education status were based on youths’ self-reports. For race/ethnicity, participants chose from one of these categories: Black or African American, White or Caucasian, Hispanic or Latino, Asian/Pacific Islander, Native American / American Indian, Arab Ameri- can, Others. Special education status was based on the ques- tion “Did/do you attend Special Education classes?” Analyses SPSS version 24.0 was used to run descriptive statistics on the demographic variables and measures used in the study.
  • 51. To compare the differences between the JSOs and GDs, t tests for continuous variables and Chi square tests for cat- egorical variables were used. Pearson bivariate correlation analyses were also conducted to examine the strength and direction of the variables used in this study. Subsequently, Mplus version 7.4 was used to run path analysis models sep- arately for JSOs and GDs with the dummy coded variables 580 K. Tan et al. 1 3 for race (African American) and special education added as covariates in the models. For both JSOs and GDs, the same model that depicted the hypotheses of this study was applied and pathways not meeting statistical significance were removed from the model. The final model was assessed using the following goodness-of-fit indices: model Chi square, the comparative fit index (CFI), the Tucker–Lewis index (TLI) and the root mean square error of approximation (RMSEA). Chi square tests in the model assess the exact-fit hypothesis that there are no discrepancies between the co-variances of this study’s population and those predicted by the models, with an insig- nificant Chi square (p ≥ 0.05) suggesting that we would not reject the exact-fit hypothesis. CFI and TLI are incremen- tal fit indices that compare the improvement in fit over the baseline model, with values ≥ 0.95 being considered to be desirable; while the RMSEA is a parsimony-corrected index with a value of ≤ 0.05 suggesting a good model fit (Kline, 2011). The robust maximum likelihood robust (MLR) esti- mator under the analysis command in MPLUS was used to estimate the coefficients for the models. Missing data was
  • 52. handled using the default ML function in Mplus. Results Characteristics of the Sample Table 1 provides a descriptive summary of the sample. The mean age for JSOs was 16.70 (SD = 1.65) and for GDs, 16.49 (SD = 1.28). No statistically significant differences were noted between groups in terms of age. Differences were noted for race and special education status. JSOs tended to be mostly White and GDs were mostly African American (47.0 vs. 52.9%; p ≤ 0.001). JSOs had higher placement rates in special education (49.4 vs. 26.5%; p ≤ 0.001). JSOs were significantly more likely than GDs to have reported academic difficulties (M = 11.01, SD = 4.78 vs. M = 9.84, SD = 4.54; p ≤ 0.05) and communicative difficulties (M = 12.83, SD = 5.31 vs. M = 10.19, SD = 4.34; p ≤ 0.001). No statisti- cal difference was observed between groups in the quality of school experience reported (JSOs: M = 3.09, SD = 1.39 vs. GDs: M = 2.88, SD = 1.33). Finally, JSOs reported sig- nificantly higher levels of delinquent behaviors (M = 64.61, SD = 34.07) than GDs (54.31, SD = 24.46; p ≤ 0.001). Bivariate Relationships The Pearson correlation matrix (Table 2) showed that com- municative difficulties were positively correlated with delinquency for both JSOs (r = 0.113, p ≤ 0.05) and GDs (r = 0.228, p ≤ 0.01); while academic difficulties were posi - tively correlated with delinquency for JSOs only (r = 0.117, p ≤ 0.05). As expected, school experience was inversely correlated with delinquency for both JSOs (r = − 0.149, p ≤ 0.01) and GDs (r = − 0.222, p ≤ 0.01), while commu- nicative difficulties and academic difficulties were posi -
  • 53. tively correlated for both JSOs (r = 0.533, p ≤ 0.001) and GDs (r = 0.464, p ≤ 0.001). School experience was not significantly correlated with academic and communicative difficulties for either group. Special education status was significantly correlated with all other variables for JSOs. However, for GDs, special education was only significantly correlated with race, academic difficulties, and communica- tive difficulties. Path Analysis Models and Overall Hypotheses After removing the insignificant pathways, the two final models (Figs. 1, 2) reported satisfactory overall model-fit statistics (JSOs: χ2 p = 0.260; CFI = 0.990; TLI = 0.977; RMSEA = 0.030; GDs: ML χ2 p = 0.908; CFI = 1.00; TLI = 1.136; RMSEA = 0.001). Both models show a num- ber of similarities. Firstly, school experience is inversely Table 1 Descriptive summary for JSOs and GDs Characteristics JSOs (n = 321) GDs (n = 155) Test of significance difference (p-value) Age, mean (SD) 16.70 (1.65) 16.49 (1.28) 0.114 Race, no. (%) White 156 (47.00) 60 (35.30) 0.001 African American 90 (27.10) 90 (52.90)
  • 54. Others 85 (25.70) 21 (11.80) Attended special education classes, no. (%) 164 (49.40) 45 (26.50) 0.001 School experience, mean (SD) 3.09 (1.39) 2.88 (1.33) 0.112 Academic difficulties, mean (SD) 11.01 (4.78) 9.84 (4.54) 0.009 Communicative difficulties, mean (SD) 12.83 (5.31) 10.19 (4.34) 0.001 Self-reported delinquency scale (SRD), mean (SD) 64.61 (34.07) 54.31 (24.46) 0.001 581School, Social-Communicative, and Academic Challenges Among Delinquents and Juvenile Sexual… 1 3 associated with delinquency for JSOs (− 0.171; p ≤ 0.01) and GDs (− 0.230; p ≤ 0.01). In addition, being African Ameri- can is inversely correlated with special education status for JSOs (− 0.145; p ≤ 0.05) and GDs (− 0.171; p ≤ 0.05). In both models, special education status is positively associated with academic difficulties (JSOs 0.415; p ≤ 0.001; GDs 0.458; p ≤ 0.001) and communicative difficulties (JSOs 0.259; ≤ 0.001; GDs 0.169; p ≤ 0.05). In addition to their similarities, the two groups showed some disparate relationships with the dependent variables Table 2 Pearson correlation matrix for academic difficulties, communicative difficulties, school experience and delinquency for JSOs and GDs The correlations for JSOs (n = 321) are below the 1.00, and the
  • 55. correlations for GDs (n = 155) are above ***p ≤ 0.001; **p ≤ 0.01; *p ≤ 0.05 African American Special education Academic difficulties Communica- tive difficul- ties School experience SRD African American 1.00 − 0.175* − 0.079 0.004 0.067 − 0.040 Special education status − 0.144* 1.00 0.454*** 0.175* 0.080 0.032 Academic difficulties − 0.105 0.370*** 1.00 0.464*** − 0.048 0.145 Communicative difficulties − 0.198*** 0.287*** 0.533*** 1.00 − 0.084 0.228** School experience − 0.050 0.167** − 0.081 − 0.074 1.00 − 0.222** Self-reported delinquency scale (SRD) 0.066 0.122* 0.117* 0.113* − 0.149** 1.00 Special Education Status African American School Experience 0.226 *** 0.142 ** -0.171 ** -0.164 **
  • 56. 0.520 ***-0.145 ** 0.259 *** Academic Difficulties Communicative Difficulties Delinquency Fig. 1 Final Model for JSOs (n = 321). ***p ≤ 0.001, **p ≤ 0.01, *p ≤ 0.05. Estimates are standardized coefficients. Large circles rep- resent latent variables; rectangles represent single-item indicators. Single-headed arrows represent regression coefficients; two- headed arrows represent correlations. Fit indices: χ2 (6) = 7.706, p = 0.260, CFI = 0.990 TLI = 0.977, RMSEA = 0.030 Special Education Status African American School Experience -0.230 * 0.230 * 0.433 ***-0.171 *
  • 57. 0.169 * Communicative Difficulties Academic Difficulties Delinquency Fig. 2 Final Model for GDs (n = 155). ***p ≤ 0.001, **p ≤ 0.01, *p ≤ 0.05. Estimates are standardized coefficients. Large circles rep- resent latent variables; rectangles represent single-item indicators. Single-headed arrows represent regression coefficients; two- headed arrows represent correlations. Fit indices: χ2 (8) = 3.380, p = 0.908, CFI = 1.000 TLI = 1.136, RMSEA = 0.001 582 K. Tan et al. 1 3 studied. For JSOs, only academic difficulties were signifi - cantly associated with school experience (− 0.164; p ≤ 0.01). GDs did not exhibit this relationship. While communicative difficulties points to academic difficulties for JSOs (0.520; p ≤ 0.001). For GDs, this relationship was observed to be bidirectional (0.433; p ≤ 0.001). Other relationships distinct to the JSOs included an inverse relationship between being African American and communicative difficulties (− 0.128;
  • 58. p ≤ 0.01), a positive association between special education status and school experience (0.226; p ≤ 0.001), and a posi- tive link between special education status and delinquency (0.142; p ≤ 0.01). For GDs, the only relationship that was distinct was a positive association between communicative difficulties and delinquency (0.230; p ≤ 0.05). Discussion Findings support the hypothesis that JSOs report more aca- demic difficulties, social communicative difficulties, and delinquency than GDs. Furthermore, as expected, school experience was inversely associated with delinquency for both groups. However, contrary to expectations, there was no significant difference in the quality of school experience between the groups. Additionally, after taking into account race and special education status, the pathways from aca- demic difficulties to school experience and delinquency were significant among JSOs. Adolescent development researchers have found low academic achievement and having antisocial peers is associated with lower levels of school experience (Oelsner, Lippold, & Greenberg, 2011). In Seto and Lalumiere’s (2010) meta-analysis, intelligence was not associated with the commission of a sexual offense among youth, although JSOs showed lower mean IQs than GDs. In this study, there was no direct association between academic and communicative difficulties on delinquency. For GDs, communicative difficulties and school experience were both significantly associated with delinquency in the hypothesized directions. This study supports findings from the extant literature which highlights both an overlap and significant distinctions in the characteristics of juvenile JSOs and GDs (Leibowitz et al., 2016; Seto & Lalumière, 2010; Wijk et al., 2005). Specifically, JSOs display more delinquent behaviors than
  • 59. GDs. This study also shows the groups have distinct risk fac- tors: JSOs are significantly more likely to have an underlying educational disability, exhibit more academic difficulties, and have greater communicative difficulties. These results provide evidence suggesting that JSOs might have greater underlying deficits in cognitive and interactional processes than GDs. Research investigating executive functioning among JSOs have found impairments in activities associated with frontal lobe functioning (Burton, Demuynck, & Yoder, 2016; Veneziano, Veneziano, LeGrand, & Richards, 2004). These deficits are a potential source of strain for young peo- ple in schools and could elicit negative emotions, such as frustration, anger, and fear which, in turn, could diminish their consideration of the costs of deviant behavior (Agnew, 2009). Both groups show noteworthy bivariate relationships. Race/ethnicity was significantly negatively correlated with special education status in both groups. African American youth were more likely than Whites to be diagnosed with an educational disability, which was unexpected given the con- trary findings in the literature (Rocque & Paternoster, 2011). Interestingly, for JSOs only, being African American was also negatively correlated with communicative difficulties. The finding that African American JSOs struggle less with communication and report less special education involve- ment than Whites might suggest that race plays a significant role in the etiology of JSOs. This is an area in dire need of further investigation, as we only found one study that has investigated race directly in youth sexual abuser etiology: Burton and Ginsberg (2012) show that African American JSOs have significantly lower levels of deviant sexual inter - est than their White counterparts. Study findings might suggest that race/ethnicity plays a
  • 60. significant role in who gets incarcerated for sexual offenses. In this sample of youth placed in residential treatment, Whites are more likely to be JSOs and African American are more likely to be GDs, reflecting the fact that African American are overrepresented among GDs but not JSOs nationally. However, race was not correlated with level of delinquency for either group. Therefore, if African Ameri - can youths incarcerated for sexual abuse are presenting with fewer indicators for being a sexual abuser than White youths, it seems possible that the threshold for incarcerating a Afri - can American youth for a sexual offense is lower than it is for a White youth. Thus, White youth in an incarcerated sample may represent a more severe type of youth sexual perpetrator than the African American youth in the same sample. These findings have important implications to the broader conversations on the overall discourse of the racial disproportionality in the juvenile justice system. Efforts must be made to identify and implement appropriate strate- gies to address complex social justice issues (Pettus-Davis & Epperson, 2015). Findings suggest that social workers should address systemic and structural issues that pertain to the racial/ethnicity disparities and that future studies should attempt to better understand what contributes to racial dif- ference in the schooling experience of racial minority JSOs and GDs. Another noteworthy finding from the bivariate analyses is the observed positive association between special education status and school experience for JSOs. Results suggest that JSOs who are diagnosed with an educational disability are 583School, Social-Communicative, and Academic Challenges Among Delinquents and Juvenile Sexual…
  • 61. 1 3 more likely to report enhanced levels of school experience. This finding is inconsistent with the schooling experience literature in general, as students diagnosed with an educa- tional disability experience more victimization than their peers (Rose et al., 2010). However, this is the first study of schooling experience that compares JSOs to GDs. As has been noted, JSOs tend to demonstrate higher levels of problematic behavior than GDs. Therefore, it seems plausi- ble that JSOs might receive proportionally higher levels of individualized attention and support from special education teachers than GDs. Thus, for JSOs in special education, their positive school experience may be a function of their special education status. Among the aspects of student factors examined in this study, the quality of school experience is associated with delinquency for both JSOs and GDs. This finding is con- sistent with the General Strain Theory’s proposition on the importance of cultivating positive experiences of school for young people to serve as a deterrent against crime (Agnew, 2009). Results are also consistent with literature, which highlights the importance of one’s time in school as a deter- rent against delinquency (Blum, 2005; Jonson-Reid, 2009; Maddox & Prinz, 2003; McNeely et al., 2002). Given this, we expected JSOs to have a poorer experience of school. However, the analyses showed no significant difference between JSOs and GDs. Given that JSOs have greater defi- cits in academics and communicative abilities, this result might indicate that the overall school experience is similar for both groups because neither of these factors affect it. However, path analysis showed that, despite a significant correlation for both groups between participation in special education and academic difficulties, the overall school expe- rience was only positively associated with these factors for
  • 62. JSOs. Furthermore, special education participation only had a direct correlation with delinquency for JSOs. Therefore, it is possible that, for JSOs only, special education status and academic difficulties have a unique association with school experience and the severity of delinquent behavior. Given the dearth of research on understanding the student factors of juvenile JSOs, this study contributes new knowledge to the field by drawing attention to the importance of the qual - ity of student factors as a possible protective factor against sexual offending. Two different patterns of the relations among academic difficulties, communicative difficulties, and school experi - ence emerged for JSOs and GDs. For JSOs, academic dif- ficulties have a stronger correlation with delinquency than communicative difficulties. Further, the correlation between academic deficits and delinquency seems to be indirect in that both relate to the quality of their time in school. In other words, for JSOs, the school experience mediates the effects of academic strains on delinquent behavior. A medi- tational influence of school experience between academic difficulties and delinquency is plausible, as General Strain Theory highlights the function of social institutions, such as schools, to serve as a form of social control against crime (Agnew, 2009). Although a meditational analysis was not part of the original focus of this study, the finding that help- ing to attain positively-valued goals, such as academic suc- cess, could be associated with a more positive experience of time in school and thereby lower individual risk of devi - ant behaviors might guide future interventions. Similarly, the suggestion that positive school experiences buffer the strains JSOs who are academically challenged experience as a result of their academic deficits might guide preventative programs. Findings suggest that professionals working with JSOs should consider targeting levels of academic abilities
  • 63. and school experience together, as both strategies effectively reduce delinquency. Future research may also explicitly test for a mediating effect of school experience in the pathway between academic difficulties and delinquency. On the contrary, for GDs, delinquency does not appear to be related to impaired intellectual functioning. One possible explanation is that GDs struggle less than JSOs to reflect on the consequences of their actions. These findings are consist- ent with the literature, which highlights that GDs are more likely to have higher cognitive abilities than JSOs (Cantor et al., 2005; Seto & Lalumière, 2010). Findings also suggest that GDs with strong communicative abilities are more likely to be delinquent. Based on this, interventions should address the different developmental pathways to delinquenc y, includ- ing improving the quality of relationships in school, as posi - tive school experience is inversely associated with negative behaviors. Implications for Practice There are many strategies that child and adolescent profes- sionals can utilize to promote positive school experiences, social communicative abilities, and academic performance. Blum (2005) discusses multiple best practices that pro- fessionals may use to promote positive school experience among the young people they serve. For instance, GDs showed a greater liking for school if they had more partici - pation in school activities and/or leadership opportunities in school. Programs to foster delinquents’ social communica- tive abilities may adopt a social-emotional learning approach in which specific social skills deficits can be screened, iden- tified, and addressed. The Social Skills Improvement System is an intervention in which practitioners and educators iden- tify specific social skills in need of attention and participants can undertake particular intervention modules to address
  • 64. their needs (Gresham & Elliott, 2008). Young people’s read- ing and mathematics abilities can also be screened, and those who perform at or below grade level can undergo targeted academic programs to enhance their academic abilities. For 584 K. Tan et al. 1 3 instance, randomized clinical trials of Read 180, an aca- demic intervention program, have shown improvements in reading achievements among low-achieving incarcerated youth (Zhu, Loadman, Lomax, & Moore, 2010). Limitations There are limitations to this study that may affect the gener - alizability of the findings. Although a strength of the study is that data were collected from multiple facilities, all of them were in a single state and findings may not generalize to youth in facilities across different geographic locations. As well, all participants were male, so findings may not gen- eralize to females. This study is also based on retrospective self-reported data from young people who were incarcerated at the time of data collection, which may lead to a response bias. We also recognize some limitations of the use of our measure of school experience. In this study, we based this construct on a single question asking participants to rate the degree to which they liked school. Although such a ques- tion provides an overall scale of the quality of one’s school encounters, the question subsumes specific factors such as the quality of their teachers and peer relationships as well as their perceptions of school environment. The lack of details limits the understanding of the richness of the school
  • 65. encounters of JSOs and GDs. Additionally, special educa- tion status was measured by attendance in special education classes. It is possible that students will have unaddressed special education needs that were not identified. Thus, spe- cial education status may be under-identified in this study’s sample. Lastly, this is a simple cross-sectional study and as such, has the lowest confidence in explaining causality. Studies that have secondary sources, such as school grade reports or psychological assessment reports, as well as longitudinal data, could further strengthen the conclusions drawn from this study. However, the availability of such data on samples of JSOs and GDs are a challenge to access due to a vari - ety of social and legal constraints. Nonetheless, in spite of these limitations, given the relative lack of research on the educational experience of young offenders, this research is among the first to provide valuable insights into their school - ing experience. Conclusion Few studies have examined the link among school-related factors and delinquency among JSOs and GDs. Findings highlight the need for child and adolescent work to focus on promoting youth school experiences and social-communica- tive and academic abilities. Results illustrate that these have varying relations with delinquency among JSOs and GDs. Furthermore, we recommend that future studies build on this study to examine more deeply the relations among race, school factors, and delinquency among JSOs and GDs. Stud- ies are also needed to explicitly test and compare the poten- tial for school experience to mediate the relations among social-communicative and academic factors and delinquency among JSOs and GDs. Findings advance the limited research
  • 66. on school-based factors and delinquency on youth who com- mitted sexual offenses. Acknowledgements The authors would like to acknowledge the Social Work Academic Criminality Collaboratory (SWACC) for data sharing and consultation on this project. References Agnew, R. (2009). General strain theory: Current status and direc- tions for future research. In F. T. Cullen, J. P. Wright, & K. R. Blevins (Eds.), Taking stock: The status of criminological theory. Advances in criminology theory (Vol. 15, pp. 101–123). New Brunswick, NJ: Transaction Publishers. Barbaree, H. E., & Marshall, W. L. (2008). The juvenile sex offender. New York: Guilford Press. Bennett, S., Farrington, D. P., & Huesmann, L. R. (2005). Explain- ing gender differences in crime and violence: The importance of social cognitive skills. Aggression and Violent Behavior, 10(3), 263–288. https ://doi.org/10.1016/j.avb.2004.07.001. Blum, R. W. (2005). A case for school connectedness. Educational Leadership, 62(7), 16–20. Brown, A., & Burton, D. L. (2010). Exploring the overlap in male juve- nile sexual offending and general delinquency: Trauma, alcohol
  • 67. use, and masculine beliefs. Journal of Child Sexual Abuse, 19(4), 450–468. https ://doi.org/10.1080/10538 712.2010.49504 4. Burton, D., Demuynck, S., & Yoder, J. R. (2016). Executive dysfunc- tion predicts delinquency but not characteristics of sexual aggres- sion among adolescent sexual offenders. Sexual Abuse, 28(8), 707–721. Burton, D., & Ginsberg, D. (2012). An exploration of racial differ- ences in deviant sexual interests among male adolescent sexual offenders. Journal of Forensic Social Work, 2(1), 25–44. https :// doi.org/10.1080/19369 28X.2011.60976 6. Cantor, J. M., Blanchard, R., Robichaud, L. K., & Christensen, B. K. (2005). Quantitative reanalysis of aggregate data on IQ in sexual offenders. Psychological Bulletin, 131(4), 555. Clegg, J., Stackhouse, J., Finch, K., Murphy, C., & Nicholls, S. (2009). Language abilities of secondary age pupils at risk of school exclu- sion: A preliminary report. Child Language Teaching and Ther - apy, 25(1), 123–139. Elliott, D. S., Huizinga, D., & Menard, S. W. (1989). Multiple problem youth: Delinquency, substance use, and mental health problems. New York: Springer.
  • 68. Espelage, D. L., Rose, C. A., & Polanin, J. R. (2015). Social - emotional learning program to reduce bullying, fighting, and victimization among middle school students with disabilities. Remedial and Special Education, 36(5), 299–311. Felson, R. B., & Kreager, D. A. (2014). Group differences in delinquency. Race and Justice, 5(1), 58–87. https ://doi. org/10.1177/21533 68714 54695 3. Fredricks, J. A., Blumenfeld, P. C., & Paris, A. H. (2004). School engagement: Potential of the concept, state of the evidence. 585School, Social-Communicative, and Academic Challenges Among Delinquents and Juvenile Sexual… 1 3 Review of Educational Research, 74(1), 59–109. https ://doi. org/10.3102/00346 54307 40010 59. Gottfredson, D. C. (2017). Prevention research in schools. Criminol- ogy & Public Policy, 16(1), 7–27. https ://doi.org/10.1111/1745- 9133.12280 . Gresham, M., & Elliott, S. (2008). Social skills improvement system. Minneapolis: Pearson. Hawkins, J. D., Catalano, R. F., Kosterman, R., Abbott, R. D., &
  • 69. Hill, K. (1999). Preventing adolescent health-risk behaviors by strengthening protection during childhood. Archives of Pediatrics & Adolescent Medicine, 153(3), 226–234. https ://doi.org/10.1001/ archp edi.153.3.226. Hoffmann, J. P., Erickson, L. D., & Spence, K. R. (2013). Modeling the association between academic achievement and delinquency: An application of interactional theory. Criminology, 51(3), 629– 660. https ://doi.org/10.1111/1745-9125.12014 . Johnston, P. (1985). Understanding reading disability: A case study approach. Harvard Educational Review, 55(2), 153–178. Jonson-Reid, M. (2009). Redefining the outcome for education. Children & Schools, 31(3), 131–133. https ://doi.org/10.1093/ cs/31.3.131. Kaczmarek, L. A. (2002). Assessment of social-communicative com- petence: An interdisciplinary model. Towson: Paul H Brookes Publishing. Katsiyannis, A., Ryan, J. B., Zhang, D., & Spann, A. (2008). Juvenile delinquency and recidivism: The impact of academic achieve- ment. Reading & Writing Quarterly, 24(2), 177–196. Kernsmith, P. D., Craun, S. W., & Foster, J. (2009). Public attitudes toward sexual offenders and sex offender registration. Journal of
  • 70. Child Sexual Abuse, 18(3), 290–301. Kjellgren, C., Priebe, G., Svedin, C. G., & Långström, N. (2010). Sexually coercive behavior in male youth: Population survey of general and specific risk factors. Archives of Sexual Behavior, 39(5), 1161–1169. Kline, R. B. (2011). Principles and practice of structural equation modeling (3rd ed.). New York: The Guilford Press. Leibowitz, G. S., Akakpo, T., & Burton, D. L. (2016). Comparison of non-sexual crimes committed by juvenile sexual offenders and delinquent Youth in residential treatment in the USA. Journal of Sexual Aggression, 22(1), 66–81. Maddox, S. J., & Prinz, R. J. (2003). School bonding in children and adolescents: Conceptualization, assessment, and associated vari - ables. Clinical Child and Family Psychology Review, 6(1), 31– 49. https ://doi.org/10.1023/A:10222 14022 478. McNeely, C. A., Nonnemaker, J. M., & Blum, R. W. (2002). Promot- ing school connectedness: Evidence from the national longitudi - nal study of adolescent health. Journal of School Health, 72(4), 138–146. https ://doi.org/10.1111/j.1746-1561.2002.tb065 33.x. Merrell, K. W., & Gimpel, G. (2014). Social skills of children and adolescents: Conceptualization, assessment, treatment. Hove: Psychology Press.
  • 71. Oelsner, J., Lippold, M. A., & Greenberg, M. T. (2011). Factors influ- encing the development of school bonding among middle school students. The Journal of Early Adolescence, 31(3), 463–487. Pettus-Davis, C., & Epperson, M. (2015). Promote smart decarcer- ation—American Academy of Social Work and Social Welfare. Retrieved from http://aasws w.org/grand -chall enges -initi ative /12- chall enges /promo te-smart -decar cerat ion/. Riggio, R. E., Messamer, J., & Throckmorton, B. (1991). Social and academic intelligence: Conceptually distinct but overlapping con- structs. Personality and Individual Differences, 12(7), 695–702. Rocque, M., & Paternoster, R. (2011). Understanding the anteced- ents of the school-to-jail link: The relationship between race and school discipline. The Journal of Criminal Law and Criminology, 101, 633. Rose, C. A., Monda-Amaya, L. E., & Espelage, D. L. (2010). Bully- ing perpetration and victimization in special education: A review of the literature. Remedial and Special Education. https ://doi. org/10.1177/07419 32510 36124 7 Seto, M. C. & Lalumière, M. L. (2010). What is so special about male adolescent sexual offending? A review and test of explanations
  • 72. through meta-analysis. Psychological Bulletin, 136(4), 526–575. https ://doi.org/10.1037/a0019 700. van Wijk, A., Vermeiren, R., Loeber, R., Hart-Kerkhoffs, L. T., Dore- leijers, T., Bullens, R. (2006). Juvenile sex offenders compared to non-sex offenders: A review of the literature 1995–2005. Trauma, Violence & Abuse, 7(4), 227–243. https ://doi.org/10.1177/15248 38006 29251 9. Veneziano, C., Veneziano, L., LeGrand, S., & Richards, L. (2004). Neuropsychological executive functions of adolescent sex offend- ers and nonsex offenders. Perceptual and Motor Skills, 98(2), 661–674. Welsh, W. N., & Harding, C. (2015). School effects on delinquency and school-based prevention. In M.D. Krohn & J. Lane (Eds.), The handbook of juvenile delinquency and juvenile justice (pp. 181– 198). New York: Wiley. Wijk, V., Loeber, R., Vermeiren, R., Pardini, D., Bullens, R., & Dore- leijers, T. (2005). Violent juvenile sex offenders compared with violent juvenile nonsex offenders: Explorative findings from the Pittsburgh Youth Study. Sexual Abuse: A Journal of Research and Treatment, 17(3), 333–352. Zhu, J., Loadman, W. E., Lomax, R. G., & Moore, R. (2010). Evaluat-
  • 73. ing intervention effects of scholastic READ 180 on low - achieving incarcerated youth. Evanston, IL: Society for Research on Educa- tional Effectiveness. Retrieved from ERIC database. (ED514404). https ://eric.ed.gov/?id=ED514 404. Child & Adolescent Social Work Journal is a copyright of Springer, 2018. All Rights Reserved. Some of my Students are Prisoners: Issues and Dilemmas for Social Work Educators Beth R. Crisp & Philip Gillingham Higher education recruitment principles and procedures which seek to redress social exclusion have inadvertently resulted in the authors discovering that some of their students are incarcerated. Notwithstanding the important logistical issues which may emerge as a consequence of accepting prisoners into a programme of social work education, it would seem that the inclusion of prisoners is symbolic of a fundamental
  • 74. difference in philosophy with a risk management stance which expects that social work educators act as gatekeepers to the profession, especially in respect of students with criminal convictions. Keywords: Social Work Education; Social Work Students; Offenders; Prisoners; Social Inclusion; Risk Management Introduction The related questions of who is fit and proper to be a social worker, and consequently, who is suitable to undertake a course of study leading to qualification as a social worker, are perennial issues for a range of stakeholders in social work education. In some countries, including the US, UK and New Zealand, the desire to restrict who can practise as a social worker has resulted in systems of licensing or registration of the workforce. In the UK, registration has been further extended to include students in recognised programmes of qualifying studies in social work. In
  • 75. stark contrast to these overseas developments, the authors, who teach social work at Deakin University, which is one of the leading providers of distance education in Australia, have discovered that an inadvertent outcome of offering a social work degree in distance education mode is that some prisoners are choosing to study social work. Correspondence to: Beth R. Crisp, School of Health and Social Development, Deakin University, 1 Gheringhap Street, Waterfront Campus, Geelong, Victoria 3217, Australia. Email: [email protected] Beth R. Crisp & Philip Gillingham, Deakin University, Australia. Social Work Education Vol. 27, No. 3, April 2008, pp. 307–317 ISSN 0261-5479 print/1470-1227 online # 2008 The Board of Social Work Education DOI: 10.1080/02615470701380360 In this paper, after describing the key features of the Bachelor of Social Work (BSW) degree at Deakin, we will explore arguments for and
  • 76. against allowing current prisoners to become social work students using two seemingly competing contemporary discourses that are shaping social work, namely social inclusion and risk management. Social Work Education at Deakin Despite being a profession which claims actively to be about promoting social inclusion, social work education in Australia has traditionally been somewhat socially exclusive. Prior to the early 1990s, there were relatively few opportunities to study social work which did not require full-time study on a metropolitan campus. The last 15 years have seen an enormous growth in social work education, with an increase from 13 to 23 providers, with the majority of these new courses in regional centres. However, an even more fundamental change has been the introduction of off-campus (distance education) programmes, and there are now a number of Australian
  • 77. universities offering the Bachelor of Social Work (BSW) fully or partially in this mode of delivery. The BSW is the approved entry level qualification for social workers in Australia. Deakin University is one of the accredited providers of the BSW by distance mode and Deakin’s BSW is an undergraduate degree which requires the equivalent of four years of full-time study. Deakin places a high priority on offering educational opportunities to potential students who demonstrate aptitude for university study but due to various reasons require a flexible mode of delivery in order to access higher education. Hence, students can study either full- or part- time and in on- or off-campus modes, with the possibility of changing mode of study as their needs change. However, there is no difference in academic expectations of students between different modes of study. All students are expected to attend an intensive practice skills workshop for a few days at the Waterfront campus of the