SlideShare a Scribd company logo
1 of 63
Why Should I learn Six Sigma?
(A Hypothetical Office Simulation to Demonstrate the
Merits of Statistical Analysis in Continuous Improvement)
Jim McCarthy - 4/28/15
©Product Ventures, Inc., March, 2015 1
Agenda
1. CEO wants customer quoting issues resolved fast
2. I am selected to get it done
3. Initial known facts & data
4. Conventional thinking & methods
5. Capability Study
6. Analysis of Variance (ANOVA) & Std. Dev. Test
7. Charter: Deliverables, Team, Gantt Chart, Scope,
Dates, Report-Out/s, Process Analyses, etc.
8. Design of Experiments (DOE)
9. Possible solutions
©Product Ventures, Inc., March, 2015 2
How It Started
CEO receives phone calls from customers:
“You are not providing quotes in a timely manner!”
Customers threaten to go to a competitor
©Product Ventures, Inc., March, 2015 3
Global
Customer Base
(All Time Zones)
I Get The Job to “Fix Quoting”
All I know is:
• Customers unhappy with quoting lead time
• CEO wants this fixed “Fast”
• No other direction is given
©Product Ventures, Inc., March, 2015 4
Initial Investigation
(Discussion with Department Supervisor)
1. Quoting Department composed of six stations
2. Stations serve all customers at random (not
region specific)
3. Supervisor compiled data - last 1,200 quotes (200
from each of six stations) to check lead time
4. Company Lead Time policy expectation has been
72 hours – (24/7 basis)
5. Supervisor is adamant that policy is being met!
©Product Ventures, Inc., March, 2015 5
How Did Supervisor Know?
1. Compiled a bar chart depicting the
performance over the last 1,200 quotes
2. Average of all six stations = 68.1185 Hrs.
3. “See I told you we were meeting the company
policy!” (Said the supervisor)
4. We are 5.4% better than the 72 hr. policy!
5. Supervisor carried out to four decimal places
just to show how precise the data was!
©Product Ventures, Inc., March, 2015 6
©Product Ventures, Inc., March, 2015 7
Station FStation EStation DStation CStation BStation A
70
60
50
40
30
20
10
0
LeadTimeQuotingHours(24/7basis)
68.5326
66.0853
68.5282 69.5961 68.8705
67.0983
Average Quoting Lead Times, Jan.- March, 2015 - 200 Quotes/Station
Where Do I Go From Here?
1. Customer complaints (Why?–averages look good)
2. How to respectfully challenge data?
3. Supervisor is taking it personal
4. Need specific data on quotes associated with
customer complaints, but data is not available.
©Product Ventures, Inc., March, 2015 8
I am Very Nervous!
&
the Clock is Ticking!
Can Six Sigma Help?
1. Averages are only one way to measure
2. What are the variations around average/s?
3. How stable/predictable is the process?
4. Are all quoting stations statistically similar?
5. Does system “Capability” = 72 hours or less?
©Product Ventures, Inc., March, 2015 9
A Typical “Normal
Distribution”
Looks Like This
©Product Ventures, Inc., March, 2015 10
Data Shown = 24/7 Lead Times (in
hours) for (Jan. – March, 2015)
1,200 quotes (200 per Station)
Data are “Time Ordered” per
individual Station (42.0 Hrs. is first
completed quote for Station A)
How Bad could It be from Customer’s View?
• Capability study - compare to 72 hr. max.
• What is the % of late quotes
• Analyze all six stations as “one system” (1st)
©Product Ventures, Inc., March, 2015 11
©Product Ventures, Inc., March, 2015 12
Choose
“Continuous”
©Product Ventures, Inc., March, 2015 13
©Product Ventures, Inc., March, 2015 14
Natural Process width (NPW) = 6
x Std. Dev = 6 x 15.197= 91.98
39.9%
Ouch!
Ppk = Difference between mean & closest
spec. ÷ 1/2 NPW (Long Term)
Z Bench = metric of normal distribution with
same PPM level as that shown (close to
sigma level) - Closest spec. ÷ Std. dev. (ST)
Why?
©Product Ventures, Inc., March, 2015 15
1
0
5
01
51
02
52
03
53
02 04 06 08 001 021 04
68.53 12.84 200
66.09 14.02 200
68.53 12.92 200
69.60 13.28 200
68.87 12.41 200
67.10 22.90 200
Mean StDev N
D
tnecreP
ata
S
elbairaV
FnoitatS
EnoitatS
DnoitatS
CnoitatS
BnoitatS
Anoitat
H
lamroN
...,DnoitatS,CnoitatS,BnoitatS,AnoitatSfomargotsi
©Product Ventures, Inc., March, 2015 16
What Else Do We Know?
 Quoting is a 1st shift, Monday-Friday operation
 1,200 completed quotes (Jan.– March, 2015)
 90 days & 68 hours (2.833 calendar days - lead Time)

1,200
90
= 𝟏𝟑. 𝟑𝟑 𝑸𝒖𝒐𝒕𝒆𝒔 (𝒄𝒐𝒎𝒑𝒍𝒆𝒕𝒆𝒅) /𝑐𝑎𝑙𝑒𝑛𝑑𝑎𝑟 𝑑𝑎𝑦 (TH)
From Little’s Law:
 Cycle Time (24/7)=
𝑊𝐼𝑃 (𝑊𝑜𝑟𝑘 𝑖𝑛 𝑝𝑟𝑜𝑐𝑒𝑠𝑠)
𝑇𝐻 (𝑇ℎ𝑟𝑜𝑢𝑔ℎ𝑝𝑢𝑡)
 2.833 Days/Quote x 13.33 Quotes/Day = 𝟑𝟖 𝑾𝑰𝑷
 90 Calendar days = 65 work days:
1,200
65
=
18.5
𝑞𝑢𝑜𝑡𝑒𝑠
𝑑𝑎𝑦
𝑜𝑟 𝑎 𝑙𝑖𝑡𝑡𝑙𝑒 𝑜𝑣𝑒𝑟
3
𝑠𝑡𝑎𝑡𝑖𝑜𝑛
/𝑤𝑜𝑟𝑘𝑑𝑎𝑦
©Product Ventures, Inc., March, 2015 17
Need to Be “Data Driven”!
1. What is present incoming rate from customer?
2. Visual daily metrics & “stand-up” meetings (10
minutes) for: Cycle Time, Throughput, & WIP
3. Can’t improve (or manage) what we don’t measure!
©Product Ventures, Inc., March, 2015 18
Let’s Dig Deeper
Analysis of Variance (ANOVA)
• 6 Sigma tool (comparison-multiple data sets)
• ANOVA tries to determine if all data sets are from the
same population
• Looks at both the mean (average) & variation of all data
sets
• Develops a ratio of the “between” data groups to “within”
each data group.
• Calculates an “F” ratio & compares it to a critical value to
determine if the null hypothesis (data is statistically the
same) can be rejected
• 1st – ANOVA assumes “Normal” data – need to check
©Product Ventures, Inc., March, 2015 19
ANOVA
• Between-Groups Variance (BGV)
• Within Groups Variance (WGV)
• "𝐹" 𝑅𝑎𝑡𝑖𝑜 =
𝐵𝐺𝑉
𝑊𝐺𝑉
• If the “F” ratio is larger than “F critical” then
we reject the null hypothesis because we
cannot be sure that all data sets are from the
same population.
• ANOVA requires significant calculations and is
best done using software.
©Product Ventures, Inc., March, 2015 20
©Product Ventures, Inc., March, 2015 21
We have 6
samples to
compare so
use “One
Way Anova”
A Hypothesis
test is testing to
see if all data
are of the same
population.
Null hypothesis
assumes all data
are from the
same population
©Product Ventures, Inc., March, 2015 22
©Product Ventures, Inc., March, 2015 23
©Product Ventures, Inc., March, 2015 24
©Product Ventures, Inc., March, 2015 25
Red dashed lines = α÷2 = 0.05÷2 significance level (95% probability)
α = .05 significance level
(critical value) 95%
probability- 2 tailed
(.025 per each tail)
©Product Ventures, Inc., March, 2015 26
©Product Ventures, Inc., March, 2015 27
β = 1- Power (Power is probability of being able to detect a 7 hour difference
β = Probability of making “Type 2 error”(not being able to detect 7 hr. difference
β =17.79% (Worst) to 0.42% (Best) – Power goes up with increase in sample size
©Product Ventures, Inc., March, 2015 28
Station F
Station E
Station D
Station C
Station B
Station A
28262422201816141210
P-Value 0.000
P-Value 0.000
Multiple Comparisons
Levene’s Test
Test for Equal Variances: Stations A-F - Customer Service Lead Time
Multiple comparison intervals for the standard deviation, α = 0.05
If intervals do not overlap, the corresponding stdevs are significantly different.
If “P” value is
low, the null
Hypothesis is
rejected
(We can’t say
that variances
are the same)
Observations, Questions, & Next Steps
1. Something is different about Station “F”
2. Although Station F has a mean of 67.098 hrs.,
it has large variability
3. What do the individual station outputs look
like with respect to 72 hours ( What is the
yield?)
©Product Ventures, Inc., March, 2015 29
©Product Ventures, Inc., March, 2015 30
©Product Ventures, Inc., March, 2015 31
What Next?
1. Station “F” has high variability & is not capable (41.53%
failure rate for 72 hr. Spec.)
2. “A-F” have a 39.92% (collective) failure rate (not capable)
3. “A-E” have 38.97 (collective) failure rate (not capable)
4. This requires a systemic change to reduce common cause
variability & reduce “mean” across all stations.
5. Write a charter, form a team, get understanding &
agreement from management , & write project plan
6. Spend some time investigating Station “F” variance in order
to better understand process. (DOE)
7. Do “Data Tagging” & value stream map (I.D. waste)
8. I.D. working hours, shifts, RFQ input rate, departments, etc.
9. Design & review daily metrics charts: WIP, Throughput, 24/7
Cycle Time, & Quality Issues
©Product Ventures, Inc., March, 2015 32
©Product Ventures, Inc., March, 2015 33
Touch Time
White Space
Working on Quotes 2.9% of time! :
𝟐 𝑯𝒓𝒔.
𝟔𝟖 𝑯𝒓𝒔.
= .029 x 100=2.9%
0.15 hrs. 1.0 hrs. 0.75 hrs. 0.10 hrs.

Station A-F
12 hrs.
Engineering
24 hrs.
Purchasing
18 hrs
Station A-F
14 hrs.
Total Lead Time = 68 Hours (24/7- Average)
Work on 97% or 3% to Reduce Overall Time?
Total Touch Time = 2.0 Hrs. (Ave.)
4 Operations in Our Quoting Example
[Initial guesses (no confirmed data) shown below]
Station “F” Design of Experiments
Observations About Station “F”:
1. Two, operators, not one, work in station “F”- usually
separately, but sometimes simultaneously- one
experienced & one new
2. They both use two separate processes “at will” –
manual or computerized (no standardized pattern)
3. The station gets incoming requests for quotes via
email (local) or Fax (remote)
©Product Ventures, Inc., March, 2015 34
Design of Experiments (DoE)
Controlled Experiments for Improvement
35©Product Ventures, Inc., March, 2015
What is “Design of Experiments”
• A controlled experiment in which the
experimenter is interested in both quantifying
and optimizing the effect of a number of
variables on one or more variables
• Input variables causing the variation = “factors”
• Output variables being measured = “responses”
36©Product Ventures, Inc., March, 2015
When Should it Be Used?
1. To identify factors which most affect responses
2. To identify those factors which act together on a
particular response - these are called interactions
3. To determine the optimum settings of factors to
satisfy a number of required responses
37©Product Ventures, Inc., March, 2015
DOE Basics
• Follows the 6 sigma transfer function:
𝑌 = 𝑓(𝑋)
Which means that “Y” (output or response) is equal
to a function of the “X” input/s (factors)
38©Product Ventures, Inc., March, 2015
A Typical DoE Application
• Determine how to get the best gas mileage
(response) based on factors (input variables)
of tire pressure & speed
39
Y = 𝑮𝒂𝒔 𝑴𝒊𝒍𝒆𝒂𝒈𝒆 𝑜𝑢𝑡𝑝𝑢𝑡 𝑜𝑟 𝑟𝑒𝑠𝑝𝑜𝑛𝑠𝑒
𝑋1 = 𝑻𝒊𝒓𝒆 𝑷𝒓𝒆𝒔𝒔𝒖𝒓𝒆 (𝑖𝑛𝑝𝑢𝑡 𝑜𝑟 𝑓𝑎𝑐𝑡𝑜𝑟)
𝑋2 = 𝑺𝒑𝒆𝒆𝒅 (𝑖𝑛𝑝𝑢𝑡 𝑜𝑟 𝑓𝑎𝑐𝑡𝑜𝑟)
©Product Ventures, Inc., March, 2015
What are Factor levels?
• Factors have agreed upon settings based on experience
& /or observation
• Settings typically “high” & “low”
• For gas mileage (MPG) example:
Tire pressure ; low = 25 Psi
Tire pressure ; high = 35 Psi
Speed ; low = 45 MPH
Speed ; High = 65 MPH
Output (Response) = Miles Per Gallon (MPG)
40©Product Ventures, Inc., March, 2015
One Factor at a Time (OFAT)
• OFAT experiments change one thing at a time
• This seems reasonable, but it is costly and does
not allow us to see interactions between inputs
DOE Enables:
1. logical Experiments
2. Minimal trials
3. Visible Interactions
©Product Ventures, Inc., March, 2015 41
Common Types of DOEs
• Fractional Factorials = 4 to 15 variables
Screening designs when product knowledge is
low – does not test all combinations
• Full Factorials = 2 to 5 Input variables
Used when necessary to fully understand effects
of interactions – not one factor at a time (OFAT)
• Response Surface Methods (RSM) = 2 to 4
input variables
Typical when response surface has significant
curvature
42©Product Ventures, Inc., March, 2015
DOE Notation
• General notation used to designate a full
factorial design is shown as:
2 𝑘
• Where k is the number of input variables or
factors
• 2 = the number of “levels” that will be used
for each factor
43©Product Ventures, Inc., March, 2015
Levels & Coding
• Typically uses coding: -1, +1 for low & high
respectively
44
Level
Factor 1
Pressure
(PSI)
Factor 1
Coding
Factor 2
Speed
(MPH)
Factor 2
Coding
Low 25 -1 45 -1
High 35 +1 65 +1
©Product Ventures, Inc., March, 2015
DOE - Full Factorial With 2 Factors & 2 Levels)
45
Pressure (PSI)
(Factor 1)
25 PSI
35 PSI
Speed (MPH)
(Factor 2)
45 65
(-1,+1) (+1,+1)
(-1,-1) (+1,-1)
©Product Ventures, Inc., March, 2015
DOE Full Factorial Combinations
For our example of 2 factors & 2 levels:
2 𝑘
46
Number of
factors;
In this case we
have 2 factors
“Pressure” &
“Speed”
Number of
Levels;
In this case we
have 2 levels
“high” & “low”
22
= 4 Combinations
©Product Ventures, Inc., March, 2015
Full Factorial Test Combinations
“Standard Order” – (not randomized & no replicates)
47
Test Run
No.
Factor 1
Pressure (PSI)
Factor 2
Speed
(MPH)
Factor 1,
Factor 2
Test
Coding
1 25 45 -1, -1
2 35 45 +1, -1
3 25 65 -1, +1
4 35 65 +1, +1
©Product Ventures, Inc., March, 2015
3 Factors & 2 Levels
Let’s add one more input variable (Fuel Type)
Type A & Type B
48
Level
Factor
1
Pres-
sure
(PSI)
Factor
1
Coding
Factor
2
Speed
(MPH)
Factor
2
Coding
Factor
3
Fuel
Factor
3
Coding
Low 25 -1 45 -1 A -1
High 35 +1 65 +1 B +1
©Product Ventures, Inc., March, 2015
DOE - Full Factorial With 3 Factors & 2 Levels
49
Pressure (PSI)
(Factor 1 = Y)
25 (-)
35 (+)
Speed (MPH)
(Factor 2 = X)
45(-) 65 (+)
(-1,+1,-1)
(+1,+1,+1)
(-1,-1,-1) (+1,-1,-1)
Fuel
(Factor 3 = Z)
A (-)
B (+)
(+1,-1,+1)(-1,-1,+1)
(+1,+1,-1)
(-1,+1,+1)X,Y,Z
(Respectively)
©Product Ventures, Inc., March, 2015
3 Factors & 2 Levels – (8 combinations)
50
Std. Run
Order
(Yates
Order)
Tire Pressure
25 PSI = -1
35 PSI = +1
Speed
45 MPH= -1
65 MPH= +1
Fuel
A=-1
B=+1
Response
(MPG)
1 -1 -1 -1 45
2 +1 -1 -1 55
3 -1 +1 -1 33
4 +1 +1 -1 32
5 -1 -1 +1 48
6 +1 -1 +1 49
7 -1 +1 +1 25
8 +1 +1 +1 33
©Product Ventures, Inc., March, 2015
DOE - Full Factorial - 3 Factors & 2 Levels
(MPG Responses Shown)
51
Pressure (PSI)
(Factor 1 = Y)
25 (-)
35 (+)
Speed (MPH)
(Factor 2 = X)
45(-) 65 (+)
(55 MPG)
(33 MPG)
(45 MPG) (33 MPG)
Fuel
(Factor 3 = Z)
A (-)
B (+)
(25 MPG)(48 MPG)
(32 MPG)
(49 MPG)
©Product Ventures, Inc., March, 2015
Back to Station “F” Quoting Issue
Factors & levels shown below
52
Level
Factor 1
Operator
Factor 2
Process
Type
Factor 3
Input
Method
Low New Computerized Fax
High Experienced Manual Email
©Product Ventures, Inc., March, 2015
©Product Ventures, Inc., March, 2015 53
©Product Ventures, Inc., March, 2015 54
©Product Ventures, Inc., March, 2015 55
©Product Ventures, Inc., March, 2015 56
Minitab
Populates
Columns C1-C7
After Design is
Completed
Experimenter
Populates the
“Response”
Column (C8)
After Tests are
Done
©Product Ventures, Inc., March, 2015 57
Then Select “Factorial plots” to get
Main Effects & Interaction Plots.
Select “Cube Plot” to Get Same.
©Product Ventures, Inc., March, 2015 58
Factors &
Interactions
(A,C,B, & BC) are
Statistically
Significant
©Product Ventures, Inc., March, 2015 59
©Product Ventures, Inc., March, 2015 60
©Product Ventures, Inc., March, 2015 61
Observations & Next Steps
1. Standardize “Computerized” process
2. Train operators to one (computerized) process
3. Do Data tagging - find out issues with the Fax
4. Populate value stream map to show waste
5. Show Value Added vs. Non Value Added time
6. Design Standard work for flow (all stations)
7. Consider “runner” to deliver FAXes or localize
8. Plot WIP, Lead Time, Rework & Throughput daily
9. Design a visual Queue to work FIFO & make it
easy to see “work in temporal jeopardy”
©Product Ventures, Inc., March, 2015 62
Lessons Learned
SIX Sigma Enabled:
1. Me to “get project started” with little data
2. My frustration level to be lowered significantly
3. Me to logically formulate “next steps” during project
4. Revelation of a “Systemic Problem”- didn’t lead the
team down wrong path chasing “Special Causes”
5. All involved to “rally around” logical process analyses
& not emotional “gut-feel” or “finger-pointing”
6. Us to see our system from the customer’s viewpoint
©Product Ventures, Inc., March, 2015 63

More Related Content

What's hot

7QC Tools By: Prem
7QC Tools By: Prem7QC Tools By: Prem
7QC Tools By: PremPrem Anand
 
Root Cause Analysis
Root Cause AnalysisRoot Cause Analysis
Root Cause Analysisjohnchuddle
 
Mini-Training: Using root-cause analysis for problem management
Mini-Training: Using root-cause analysis for problem managementMini-Training: Using root-cause analysis for problem management
Mini-Training: Using root-cause analysis for problem managementBetclic Everest Group Tech Team
 
7 QC Tools PowerPoint Presentation Slides
7 QC Tools PowerPoint Presentation Slides 7 QC Tools PowerPoint Presentation Slides
7 QC Tools PowerPoint Presentation Slides SlideTeam
 
ITTM: Troubleshooting Skill Manual
ITTM: Troubleshooting Skill ManualITTM: Troubleshooting Skill Manual
ITTM: Troubleshooting Skill ManualNoel Temena
 
Micro Task Interface Evaluation Method
Micro Task Interface Evaluation MethodMicro Task Interface Evaluation Method
Micro Task Interface Evaluation Methodmhilde
 
Compiling Analysis Results
Compiling Analysis ResultsCompiling Analysis Results
Compiling Analysis ResultsMatt Hansen
 
Quality tools and techniques- 7 tools of quality
Quality tools and techniques- 7 tools of qualityQuality tools and techniques- 7 tools of quality
Quality tools and techniques- 7 tools of qualityLallu Joseph
 
Quality tools-asq-london-may-10-2006
Quality tools-asq-london-may-10-2006Quality tools-asq-london-may-10-2006
Quality tools-asq-london-may-10-2006Omnex Inc.
 
Root Cause Analysis
Root Cause AnalysisRoot Cause Analysis
Root Cause Analysismtalhausmani
 
New Design of Experiments Features in JMP 11
New Design of Experiments Features in JMP 11New Design of Experiments Features in JMP 11
New Design of Experiments Features in JMP 11JMP software from SAS
 
CAPA, Root Cause Analysis and Risk Management
CAPA, Root Cause Analysis and Risk ManagementCAPA, Root Cause Analysis and Risk Management
CAPA, Root Cause Analysis and Risk ManagementJoseph Tarsio
 

What's hot (20)

7QC Tools By: Prem
7QC Tools By: Prem7QC Tools By: Prem
7QC Tools By: Prem
 
7 QC Tools Training
7 QC Tools Training7 QC Tools Training
7 QC Tools Training
 
Bad Metric, Bad!
Bad Metric, Bad!Bad Metric, Bad!
Bad Metric, Bad!
 
Root Cause Analysis
Root Cause AnalysisRoot Cause Analysis
Root Cause Analysis
 
The Finishing Line
The Finishing LineThe Finishing Line
The Finishing Line
 
Mini-Training: Using root-cause analysis for problem management
Mini-Training: Using root-cause analysis for problem managementMini-Training: Using root-cause analysis for problem management
Mini-Training: Using root-cause analysis for problem management
 
#8 Root Cause Analysis
#8 Root Cause Analysis#8 Root Cause Analysis
#8 Root Cause Analysis
 
7 QC Tools PowerPoint Presentation Slides
7 QC Tools PowerPoint Presentation Slides 7 QC Tools PowerPoint Presentation Slides
7 QC Tools PowerPoint Presentation Slides
 
ITTM: Troubleshooting Skill Manual
ITTM: Troubleshooting Skill ManualITTM: Troubleshooting Skill Manual
ITTM: Troubleshooting Skill Manual
 
7 qc tools.
7 qc tools.7 qc tools.
7 qc tools.
 
Root cause analysis
Root cause analysisRoot cause analysis
Root cause analysis
 
Micro Task Interface Evaluation Method
Micro Task Interface Evaluation MethodMicro Task Interface Evaluation Method
Micro Task Interface Evaluation Method
 
Spc overview mfg
Spc overview mfgSpc overview mfg
Spc overview mfg
 
Compiling Analysis Results
Compiling Analysis ResultsCompiling Analysis Results
Compiling Analysis Results
 
Quality tools and techniques- 7 tools of quality
Quality tools and techniques- 7 tools of qualityQuality tools and techniques- 7 tools of quality
Quality tools and techniques- 7 tools of quality
 
Quality tools-asq-london-may-10-2006
Quality tools-asq-london-may-10-2006Quality tools-asq-london-may-10-2006
Quality tools-asq-london-may-10-2006
 
Root Cause Analysis
Root Cause AnalysisRoot Cause Analysis
Root Cause Analysis
 
New Design of Experiments Features in JMP 11
New Design of Experiments Features in JMP 11New Design of Experiments Features in JMP 11
New Design of Experiments Features in JMP 11
 
7 qcdoe
7 qcdoe7 qcdoe
7 qcdoe
 
CAPA, Root Cause Analysis and Risk Management
CAPA, Root Cause Analysis and Risk ManagementCAPA, Root Cause Analysis and Risk Management
CAPA, Root Cause Analysis and Risk Management
 

Viewers also liked

Sifco Recommendation letters
Sifco Recommendation lettersSifco Recommendation letters
Sifco Recommendation lettersJames F. McCarthy
 
企業価値を見抜いて投資せよ!【有価証券報告書戦略的読解セミナー編】
企業価値を見抜いて投資せよ!【有価証券報告書戦略的読解セミナー編】企業価値を見抜いて投資せよ!【有価証券報告書戦略的読解セミナー編】
企業価値を見抜いて投資せよ!【有価証券報告書戦略的読解セミナー編】ValuationMatrix
 
WU-Crew Job Description 2014-2015
WU-Crew Job Description 2014-2015WU-Crew Job Description 2014-2015
WU-Crew Job Description 2014-2015Nathan York
 
Webb_Dicaire_774Final
Webb_Dicaire_774FinalWebb_Dicaire_774Final
Webb_Dicaire_774FinalSimon Webb
 
Kequshqyerja dhe semundjet
Kequshqyerja dhe semundjetKequshqyerja dhe semundjet
Kequshqyerja dhe semundjetSindi_haka
 
Yeison fabian
Yeison fabianYeison fabian
Yeison fabianJhohan Cx
 
Catálogo de las plantas existentes en el Jardín de Aclimatación de la Orotava...
Catálogo de las plantas existentes en el Jardín de Aclimatación de la Orotava...Catálogo de las plantas existentes en el Jardín de Aclimatación de la Orotava...
Catálogo de las plantas existentes en el Jardín de Aclimatación de la Orotava...Isla de Tenerife Vívela
 
Deutche Pop und elektronische
Deutche Pop und elektronischeDeutche Pop und elektronische
Deutche Pop und elektronischefylvalladolid
 
2017 0023 bases convocatoria md ecuador ind.aux.agricola.
2017 0023 bases convocatoria md ecuador ind.aux.agricola.2017 0023 bases convocatoria md ecuador ind.aux.agricola.
2017 0023 bases convocatoria md ecuador ind.aux.agricola.Reyes Farfán
 
María Pilar Diezhandino Nieto - Narraciones Gitanas
María Pilar Diezhandino Nieto -  Narraciones GitanasMaría Pilar Diezhandino Nieto -  Narraciones Gitanas
María Pilar Diezhandino Nieto - Narraciones GitanasPilar Diezhandino Nieto
 
NovaTec Company Overview
NovaTec Company OverviewNovaTec Company Overview
NovaTec Company Overviewmichaelhofbauer
 

Viewers also liked (20)

Sifco Recommendation letters
Sifco Recommendation lettersSifco Recommendation letters
Sifco Recommendation letters
 
23709008 smart-sensors
23709008 smart-sensors23709008 smart-sensors
23709008 smart-sensors
 
Kinematika pr.1
Kinematika pr.1Kinematika pr.1
Kinematika pr.1
 
Vinayak Susladkar
Vinayak SusladkarVinayak Susladkar
Vinayak Susladkar
 
resume 2
resume 2resume 2
resume 2
 
Irina Stefanova Resume
Irina Stefanova ResumeIrina Stefanova Resume
Irina Stefanova Resume
 
企業価値を見抜いて投資せよ!【有価証券報告書戦略的読解セミナー編】
企業価値を見抜いて投資せよ!【有価証券報告書戦略的読解セミナー編】企業価値を見抜いて投資せよ!【有価証券報告書戦略的読解セミナー編】
企業価値を見抜いて投資せよ!【有価証券報告書戦略的読解セミナー編】
 
WU-Crew Job Description 2014-2015
WU-Crew Job Description 2014-2015WU-Crew Job Description 2014-2015
WU-Crew Job Description 2014-2015
 
Webb_Dicaire_774Final
Webb_Dicaire_774FinalWebb_Dicaire_774Final
Webb_Dicaire_774Final
 
Kequshqyerja dhe semundjet
Kequshqyerja dhe semundjetKequshqyerja dhe semundjet
Kequshqyerja dhe semundjet
 
Trabajo final educar
Trabajo final educarTrabajo final educar
Trabajo final educar
 
Yeison fabian
Yeison fabianYeison fabian
Yeison fabian
 
Breton organic food know-how at BIOFACH
Breton organic food know-how at BIOFACHBreton organic food know-how at BIOFACH
Breton organic food know-how at BIOFACH
 
Catálogo de las plantas existentes en el Jardín de Aclimatación de la Orotava...
Catálogo de las plantas existentes en el Jardín de Aclimatación de la Orotava...Catálogo de las plantas existentes en el Jardín de Aclimatación de la Orotava...
Catálogo de las plantas existentes en el Jardín de Aclimatación de la Orotava...
 
Deutche Pop und elektronische
Deutche Pop und elektronischeDeutche Pop und elektronische
Deutche Pop und elektronische
 
2017 0023 bases convocatoria md ecuador ind.aux.agricola.
2017 0023 bases convocatoria md ecuador ind.aux.agricola.2017 0023 bases convocatoria md ecuador ind.aux.agricola.
2017 0023 bases convocatoria md ecuador ind.aux.agricola.
 
María Pilar Diezhandino Nieto - Narraciones Gitanas
María Pilar Diezhandino Nieto -  Narraciones GitanasMaría Pilar Diezhandino Nieto -  Narraciones Gitanas
María Pilar Diezhandino Nieto - Narraciones Gitanas
 
NovaTec Company Overview
NovaTec Company OverviewNovaTec Company Overview
NovaTec Company Overview
 
ReDiseñando Eros - Amar a Todos los Seres 1b
ReDiseñando Eros - Amar a Todos los Seres 1bReDiseñando Eros - Amar a Todos los Seres 1b
ReDiseñando Eros - Amar a Todos los Seres 1b
 
Cp orientation
Cp orientationCp orientation
Cp orientation
 

Similar to Why Six Sigma Can Help Improve Customer Quotes

A/B Testing Best Practices - Do's and Don'ts
A/B Testing Best Practices - Do's and Don'tsA/B Testing Best Practices - Do's and Don'ts
A/B Testing Best Practices - Do's and Don'tsRamkumar Ravichandran
 
Andrii Belas: A/B testing overview: use-cases, theory and tools
Andrii Belas: A/B testing overview: use-cases, theory and toolsAndrii Belas: A/B testing overview: use-cases, theory and tools
Andrii Belas: A/B testing overview: use-cases, theory and toolsLviv Startup Club
 
Better Living Through Analytics - Strategies for Data Decisions
Better Living Through Analytics - Strategies for Data DecisionsBetter Living Through Analytics - Strategies for Data Decisions
Better Living Through Analytics - Strategies for Data DecisionsProduct School
 
When in doubt, go live
When in doubt, go liveWhen in doubt, go live
When in doubt, go liveThoughtworks
 
Tale of Two Tests
Tale of Two TestsTale of Two Tests
Tale of Two TestsOptimizely
 
Intro to Data Analytics with Oscar's Director of Product
 Intro to Data Analytics with Oscar's Director of Product Intro to Data Analytics with Oscar's Director of Product
Intro to Data Analytics with Oscar's Director of ProductProduct School
 
Pin the tail on the metric v00 75 min version
Pin the tail on the metric v00 75 min versionPin the tail on the metric v00 75 min version
Pin the tail on the metric v00 75 min versionSteven Martin
 
Gerlof Hoekstra - OMG What Have We Done - EuroSTAR 2013
Gerlof Hoekstra - OMG What Have We Done - EuroSTAR 2013Gerlof Hoekstra - OMG What Have We Done - EuroSTAR 2013
Gerlof Hoekstra - OMG What Have We Done - EuroSTAR 2013TEST Huddle
 
Test Data Management: The Underestimated Pain
Test Data Management: The Underestimated PainTest Data Management: The Underestimated Pain
Test Data Management: The Underestimated PainChelsea Frischknecht
 
Critical Checks for Pharmaceuticals and Healthcare: Validating Your Data Inte...
Critical Checks for Pharmaceuticals and Healthcare: Validating Your Data Inte...Critical Checks for Pharmaceuticals and Healthcare: Validating Your Data Inte...
Critical Checks for Pharmaceuticals and Healthcare: Validating Your Data Inte...Minitab, LLC
 
Steve Lawrence - Agile Metrics
Steve Lawrence - Agile MetricsSteve Lawrence - Agile Metrics
Steve Lawrence - Agile MetricsAgileNZ Conference
 
Gap assessment Continuous Testing
Gap assessment   Continuous TestingGap assessment   Continuous Testing
Gap assessment Continuous TestingMarc Hornbeek
 
The ways to fuck up ab testing (from data products meetup)
The ways to fuck up ab testing (from data products meetup)The ways to fuck up ab testing (from data products meetup)
The ways to fuck up ab testing (from data products meetup)Data Products Meetup
 
Descriptive Statistics and Interpretation Grading GuideQNT5.docx
Descriptive Statistics and Interpretation Grading GuideQNT5.docxDescriptive Statistics and Interpretation Grading GuideQNT5.docx
Descriptive Statistics and Interpretation Grading GuideQNT5.docxtheodorelove43763
 
Introduction to Japan Business Model Competition 
Introduction to Japan Business Model Competition Introduction to Japan Business Model Competition 
Introduction to Japan Business Model Competition Takeru Ohe
 

Similar to Why Six Sigma Can Help Improve Customer Quotes (20)

A/B Testing Best Practices - Do's and Don'ts
A/B Testing Best Practices - Do's and Don'tsA/B Testing Best Practices - Do's and Don'ts
A/B Testing Best Practices - Do's and Don'ts
 
Andrii Belas: A/B testing overview: use-cases, theory and tools
Andrii Belas: A/B testing overview: use-cases, theory and toolsAndrii Belas: A/B testing overview: use-cases, theory and tools
Andrii Belas: A/B testing overview: use-cases, theory and tools
 
Better Living Through Analytics - Strategies for Data Decisions
Better Living Through Analytics - Strategies for Data DecisionsBetter Living Through Analytics - Strategies for Data Decisions
Better Living Through Analytics - Strategies for Data Decisions
 
When in doubt, go live
When in doubt, go liveWhen in doubt, go live
When in doubt, go live
 
Tale of Two Tests
Tale of Two TestsTale of Two Tests
Tale of Two Tests
 
Intro to Data Analytics with Oscar's Director of Product
 Intro to Data Analytics with Oscar's Director of Product Intro to Data Analytics with Oscar's Director of Product
Intro to Data Analytics with Oscar's Director of Product
 
Pin the tail on the metric v00 75 min version
Pin the tail on the metric v00 75 min versionPin the tail on the metric v00 75 min version
Pin the tail on the metric v00 75 min version
 
Lean Six Sigma
Lean Six SigmaLean Six Sigma
Lean Six Sigma
 
Gerlof Hoekstra - OMG What Have We Done - EuroSTAR 2013
Gerlof Hoekstra - OMG What Have We Done - EuroSTAR 2013Gerlof Hoekstra - OMG What Have We Done - EuroSTAR 2013
Gerlof Hoekstra - OMG What Have We Done - EuroSTAR 2013
 
1650 track2 anderberg
1650 track2 anderberg1650 track2 anderberg
1650 track2 anderberg
 
Test Data Management: The Underestimated Pain
Test Data Management: The Underestimated PainTest Data Management: The Underestimated Pain
Test Data Management: The Underestimated Pain
 
Critical Checks for Pharmaceuticals and Healthcare: Validating Your Data Inte...
Critical Checks for Pharmaceuticals and Healthcare: Validating Your Data Inte...Critical Checks for Pharmaceuticals and Healthcare: Validating Your Data Inte...
Critical Checks for Pharmaceuticals and Healthcare: Validating Your Data Inte...
 
Steve Lawrence - Agile Metrics
Steve Lawrence - Agile MetricsSteve Lawrence - Agile Metrics
Steve Lawrence - Agile Metrics
 
Hkwaw event 20100622
Hkwaw event   20100622Hkwaw event   20100622
Hkwaw event 20100622
 
Gap assessment Continuous Testing
Gap assessment   Continuous TestingGap assessment   Continuous Testing
Gap assessment Continuous Testing
 
The ways to fuck up ab testing (from data products meetup)
The ways to fuck up ab testing (from data products meetup)The ways to fuck up ab testing (from data products meetup)
The ways to fuck up ab testing (from data products meetup)
 
Six sigma[2]
Six sigma[2]Six sigma[2]
Six sigma[2]
 
Descriptive Statistics and Interpretation Grading GuideQNT5.docx
Descriptive Statistics and Interpretation Grading GuideQNT5.docxDescriptive Statistics and Interpretation Grading GuideQNT5.docx
Descriptive Statistics and Interpretation Grading GuideQNT5.docx
 
Introduction to Japan Business Model Competition 
Introduction to Japan Business Model Competition Introduction to Japan Business Model Competition 
Introduction to Japan Business Model Competition 
 
Business Model Competition october 24 final
Business Model Competition october 24 finalBusiness Model Competition october 24 final
Business Model Competition october 24 final
 

More from James F. McCarthy

Tescom letters from Boss & Machine Shop Mgr.
Tescom letters from Boss & Machine Shop Mgr.Tescom letters from Boss & Machine Shop Mgr.
Tescom letters from Boss & Machine Shop Mgr.James F. McCarthy
 
Aerospace Welding Dir. of QA Letter
Aerospace Welding Dir. of QA LetterAerospace Welding Dir. of QA Letter
Aerospace Welding Dir. of QA LetterJames F. McCarthy
 
Houston Presentation, April 2, 2014, Modified
Houston Presentation, April 2, 2014, ModifiedHouston Presentation, April 2, 2014, Modified
Houston Presentation, April 2, 2014, ModifiedJames F. McCarthy
 

More from James F. McCarthy (9)

Remmele Letter & Results
Remmele Letter & ResultsRemmele Letter & Results
Remmele Letter & Results
 
Net, Just hang it
Net, Just hang itNet, Just hang it
Net, Just hang it
 
Tescom letters from Boss & Machine Shop Mgr.
Tescom letters from Boss & Machine Shop Mgr.Tescom letters from Boss & Machine Shop Mgr.
Tescom letters from Boss & Machine Shop Mgr.
 
Aerospace Welding Dir. of QA Letter
Aerospace Welding Dir. of QA LetterAerospace Welding Dir. of QA Letter
Aerospace Welding Dir. of QA Letter
 
Houston Presentation, April 2, 2014, Modified
Houston Presentation, April 2, 2014, ModifiedHouston Presentation, April 2, 2014, Modified
Houston Presentation, April 2, 2014, Modified
 
Aeromet Letter from Boss
Aeromet Letter from BossAeromet Letter from Boss
Aeromet Letter from Boss
 
Williams Int'l. HR Letter
Williams Int'l. HR LetterWilliams Int'l. HR Letter
Williams Int'l. HR Letter
 
US Navy Letter
US Navy LetterUS Navy Letter
US Navy Letter
 
NWA Recommendation Letter
NWA Recommendation LetterNWA Recommendation Letter
NWA Recommendation Letter
 

Why Six Sigma Can Help Improve Customer Quotes

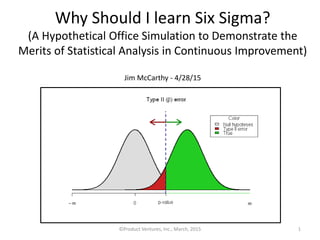
  • 1. Why Should I learn Six Sigma? (A Hypothetical Office Simulation to Demonstrate the Merits of Statistical Analysis in Continuous Improvement) Jim McCarthy - 4/28/15 ©Product Ventures, Inc., March, 2015 1
  • 2. Agenda 1. CEO wants customer quoting issues resolved fast 2. I am selected to get it done 3. Initial known facts & data 4. Conventional thinking & methods 5. Capability Study 6. Analysis of Variance (ANOVA) & Std. Dev. Test 7. Charter: Deliverables, Team, Gantt Chart, Scope, Dates, Report-Out/s, Process Analyses, etc. 8. Design of Experiments (DOE) 9. Possible solutions ©Product Ventures, Inc., March, 2015 2
  • 3. How It Started CEO receives phone calls from customers: “You are not providing quotes in a timely manner!” Customers threaten to go to a competitor ©Product Ventures, Inc., March, 2015 3 Global Customer Base (All Time Zones)
  • 4. I Get The Job to “Fix Quoting” All I know is: • Customers unhappy with quoting lead time • CEO wants this fixed “Fast” • No other direction is given ©Product Ventures, Inc., March, 2015 4
  • 5. Initial Investigation (Discussion with Department Supervisor) 1. Quoting Department composed of six stations 2. Stations serve all customers at random (not region specific) 3. Supervisor compiled data - last 1,200 quotes (200 from each of six stations) to check lead time 4. Company Lead Time policy expectation has been 72 hours – (24/7 basis) 5. Supervisor is adamant that policy is being met! ©Product Ventures, Inc., March, 2015 5
  • 6. How Did Supervisor Know? 1. Compiled a bar chart depicting the performance over the last 1,200 quotes 2. Average of all six stations = 68.1185 Hrs. 3. “See I told you we were meeting the company policy!” (Said the supervisor) 4. We are 5.4% better than the 72 hr. policy! 5. Supervisor carried out to four decimal places just to show how precise the data was! ©Product Ventures, Inc., March, 2015 6
  • 7. ©Product Ventures, Inc., March, 2015 7 Station FStation EStation DStation CStation BStation A 70 60 50 40 30 20 10 0 LeadTimeQuotingHours(24/7basis) 68.5326 66.0853 68.5282 69.5961 68.8705 67.0983 Average Quoting Lead Times, Jan.- March, 2015 - 200 Quotes/Station
  • 8. Where Do I Go From Here? 1. Customer complaints (Why?–averages look good) 2. How to respectfully challenge data? 3. Supervisor is taking it personal 4. Need specific data on quotes associated with customer complaints, but data is not available. ©Product Ventures, Inc., March, 2015 8 I am Very Nervous! & the Clock is Ticking!
  • 9. Can Six Sigma Help? 1. Averages are only one way to measure 2. What are the variations around average/s? 3. How stable/predictable is the process? 4. Are all quoting stations statistically similar? 5. Does system “Capability” = 72 hours or less? ©Product Ventures, Inc., March, 2015 9 A Typical “Normal Distribution” Looks Like This
  • 10. ©Product Ventures, Inc., March, 2015 10 Data Shown = 24/7 Lead Times (in hours) for (Jan. – March, 2015) 1,200 quotes (200 per Station) Data are “Time Ordered” per individual Station (42.0 Hrs. is first completed quote for Station A)
  • 11. How Bad could It be from Customer’s View? • Capability study - compare to 72 hr. max. • What is the % of late quotes • Analyze all six stations as “one system” (1st) ©Product Ventures, Inc., March, 2015 11
  • 12. ©Product Ventures, Inc., March, 2015 12 Choose “Continuous”
  • 13. ©Product Ventures, Inc., March, 2015 13
  • 14. ©Product Ventures, Inc., March, 2015 14 Natural Process width (NPW) = 6 x Std. Dev = 6 x 15.197= 91.98 39.9% Ouch! Ppk = Difference between mean & closest spec. ÷ 1/2 NPW (Long Term) Z Bench = metric of normal distribution with same PPM level as that shown (close to sigma level) - Closest spec. ÷ Std. dev. (ST) Why?
  • 15. ©Product Ventures, Inc., March, 2015 15 1 0 5 01 51 02 52 03 53 02 04 06 08 001 021 04 68.53 12.84 200 66.09 14.02 200 68.53 12.92 200 69.60 13.28 200 68.87 12.41 200 67.10 22.90 200 Mean StDev N D tnecreP ata S elbairaV FnoitatS EnoitatS DnoitatS CnoitatS BnoitatS Anoitat H lamroN ...,DnoitatS,CnoitatS,BnoitatS,AnoitatSfomargotsi
  • 16. ©Product Ventures, Inc., March, 2015 16
  • 17. What Else Do We Know?  Quoting is a 1st shift, Monday-Friday operation  1,200 completed quotes (Jan.– March, 2015)  90 days & 68 hours (2.833 calendar days - lead Time)  1,200 90 = 𝟏𝟑. 𝟑𝟑 𝑸𝒖𝒐𝒕𝒆𝒔 (𝒄𝒐𝒎𝒑𝒍𝒆𝒕𝒆𝒅) /𝑐𝑎𝑙𝑒𝑛𝑑𝑎𝑟 𝑑𝑎𝑦 (TH) From Little’s Law:  Cycle Time (24/7)= 𝑊𝐼𝑃 (𝑊𝑜𝑟𝑘 𝑖𝑛 𝑝𝑟𝑜𝑐𝑒𝑠𝑠) 𝑇𝐻 (𝑇ℎ𝑟𝑜𝑢𝑔ℎ𝑝𝑢𝑡)  2.833 Days/Quote x 13.33 Quotes/Day = 𝟑𝟖 𝑾𝑰𝑷  90 Calendar days = 65 work days: 1,200 65 = 18.5 𝑞𝑢𝑜𝑡𝑒𝑠 𝑑𝑎𝑦 𝑜𝑟 𝑎 𝑙𝑖𝑡𝑡𝑙𝑒 𝑜𝑣𝑒𝑟 3 𝑠𝑡𝑎𝑡𝑖𝑜𝑛 /𝑤𝑜𝑟𝑘𝑑𝑎𝑦 ©Product Ventures, Inc., March, 2015 17
  • 18. Need to Be “Data Driven”! 1. What is present incoming rate from customer? 2. Visual daily metrics & “stand-up” meetings (10 minutes) for: Cycle Time, Throughput, & WIP 3. Can’t improve (or manage) what we don’t measure! ©Product Ventures, Inc., March, 2015 18
  • 19. Let’s Dig Deeper Analysis of Variance (ANOVA) • 6 Sigma tool (comparison-multiple data sets) • ANOVA tries to determine if all data sets are from the same population • Looks at both the mean (average) & variation of all data sets • Develops a ratio of the “between” data groups to “within” each data group. • Calculates an “F” ratio & compares it to a critical value to determine if the null hypothesis (data is statistically the same) can be rejected • 1st – ANOVA assumes “Normal” data – need to check ©Product Ventures, Inc., March, 2015 19
  • 20. ANOVA • Between-Groups Variance (BGV) • Within Groups Variance (WGV) • "𝐹" 𝑅𝑎𝑡𝑖𝑜 = 𝐵𝐺𝑉 𝑊𝐺𝑉 • If the “F” ratio is larger than “F critical” then we reject the null hypothesis because we cannot be sure that all data sets are from the same population. • ANOVA requires significant calculations and is best done using software. ©Product Ventures, Inc., March, 2015 20
  • 21. ©Product Ventures, Inc., March, 2015 21 We have 6 samples to compare so use “One Way Anova” A Hypothesis test is testing to see if all data are of the same population. Null hypothesis assumes all data are from the same population
  • 22. ©Product Ventures, Inc., March, 2015 22
  • 23. ©Product Ventures, Inc., March, 2015 23
  • 24. ©Product Ventures, Inc., March, 2015 24
  • 25. ©Product Ventures, Inc., March, 2015 25 Red dashed lines = α÷2 = 0.05÷2 significance level (95% probability) α = .05 significance level (critical value) 95% probability- 2 tailed (.025 per each tail)
  • 26. ©Product Ventures, Inc., March, 2015 26
  • 27. ©Product Ventures, Inc., March, 2015 27 β = 1- Power (Power is probability of being able to detect a 7 hour difference β = Probability of making “Type 2 error”(not being able to detect 7 hr. difference β =17.79% (Worst) to 0.42% (Best) – Power goes up with increase in sample size
  • 28. ©Product Ventures, Inc., March, 2015 28 Station F Station E Station D Station C Station B Station A 28262422201816141210 P-Value 0.000 P-Value 0.000 Multiple Comparisons Levene’s Test Test for Equal Variances: Stations A-F - Customer Service Lead Time Multiple comparison intervals for the standard deviation, α = 0.05 If intervals do not overlap, the corresponding stdevs are significantly different. If “P” value is low, the null Hypothesis is rejected (We can’t say that variances are the same)
  • 29. Observations, Questions, & Next Steps 1. Something is different about Station “F” 2. Although Station F has a mean of 67.098 hrs., it has large variability 3. What do the individual station outputs look like with respect to 72 hours ( What is the yield?) ©Product Ventures, Inc., March, 2015 29
  • 30. ©Product Ventures, Inc., March, 2015 30
  • 31. ©Product Ventures, Inc., March, 2015 31
  • 32. What Next? 1. Station “F” has high variability & is not capable (41.53% failure rate for 72 hr. Spec.) 2. “A-F” have a 39.92% (collective) failure rate (not capable) 3. “A-E” have 38.97 (collective) failure rate (not capable) 4. This requires a systemic change to reduce common cause variability & reduce “mean” across all stations. 5. Write a charter, form a team, get understanding & agreement from management , & write project plan 6. Spend some time investigating Station “F” variance in order to better understand process. (DOE) 7. Do “Data Tagging” & value stream map (I.D. waste) 8. I.D. working hours, shifts, RFQ input rate, departments, etc. 9. Design & review daily metrics charts: WIP, Throughput, 24/7 Cycle Time, & Quality Issues ©Product Ventures, Inc., March, 2015 32
  • 33. ©Product Ventures, Inc., March, 2015 33 Touch Time White Space Working on Quotes 2.9% of time! : 𝟐 𝑯𝒓𝒔. 𝟔𝟖 𝑯𝒓𝒔. = .029 x 100=2.9% 0.15 hrs. 1.0 hrs. 0.75 hrs. 0.10 hrs.  Station A-F 12 hrs. Engineering 24 hrs. Purchasing 18 hrs Station A-F 14 hrs. Total Lead Time = 68 Hours (24/7- Average) Work on 97% or 3% to Reduce Overall Time? Total Touch Time = 2.0 Hrs. (Ave.) 4 Operations in Our Quoting Example [Initial guesses (no confirmed data) shown below]
  • 34. Station “F” Design of Experiments Observations About Station “F”: 1. Two, operators, not one, work in station “F”- usually separately, but sometimes simultaneously- one experienced & one new 2. They both use two separate processes “at will” – manual or computerized (no standardized pattern) 3. The station gets incoming requests for quotes via email (local) or Fax (remote) ©Product Ventures, Inc., March, 2015 34
  • 35. Design of Experiments (DoE) Controlled Experiments for Improvement 35©Product Ventures, Inc., March, 2015
  • 36. What is “Design of Experiments” • A controlled experiment in which the experimenter is interested in both quantifying and optimizing the effect of a number of variables on one or more variables • Input variables causing the variation = “factors” • Output variables being measured = “responses” 36©Product Ventures, Inc., March, 2015
  • 37. When Should it Be Used? 1. To identify factors which most affect responses 2. To identify those factors which act together on a particular response - these are called interactions 3. To determine the optimum settings of factors to satisfy a number of required responses 37©Product Ventures, Inc., March, 2015
  • 38. DOE Basics • Follows the 6 sigma transfer function: 𝑌 = 𝑓(𝑋) Which means that “Y” (output or response) is equal to a function of the “X” input/s (factors) 38©Product Ventures, Inc., March, 2015
  • 39. A Typical DoE Application • Determine how to get the best gas mileage (response) based on factors (input variables) of tire pressure & speed 39 Y = 𝑮𝒂𝒔 𝑴𝒊𝒍𝒆𝒂𝒈𝒆 𝑜𝑢𝑡𝑝𝑢𝑡 𝑜𝑟 𝑟𝑒𝑠𝑝𝑜𝑛𝑠𝑒 𝑋1 = 𝑻𝒊𝒓𝒆 𝑷𝒓𝒆𝒔𝒔𝒖𝒓𝒆 (𝑖𝑛𝑝𝑢𝑡 𝑜𝑟 𝑓𝑎𝑐𝑡𝑜𝑟) 𝑋2 = 𝑺𝒑𝒆𝒆𝒅 (𝑖𝑛𝑝𝑢𝑡 𝑜𝑟 𝑓𝑎𝑐𝑡𝑜𝑟) ©Product Ventures, Inc., March, 2015
  • 40. What are Factor levels? • Factors have agreed upon settings based on experience & /or observation • Settings typically “high” & “low” • For gas mileage (MPG) example: Tire pressure ; low = 25 Psi Tire pressure ; high = 35 Psi Speed ; low = 45 MPH Speed ; High = 65 MPH Output (Response) = Miles Per Gallon (MPG) 40©Product Ventures, Inc., March, 2015
  • 41. One Factor at a Time (OFAT) • OFAT experiments change one thing at a time • This seems reasonable, but it is costly and does not allow us to see interactions between inputs DOE Enables: 1. logical Experiments 2. Minimal trials 3. Visible Interactions ©Product Ventures, Inc., March, 2015 41
  • 42. Common Types of DOEs • Fractional Factorials = 4 to 15 variables Screening designs when product knowledge is low – does not test all combinations • Full Factorials = 2 to 5 Input variables Used when necessary to fully understand effects of interactions – not one factor at a time (OFAT) • Response Surface Methods (RSM) = 2 to 4 input variables Typical when response surface has significant curvature 42©Product Ventures, Inc., March, 2015
  • 43. DOE Notation • General notation used to designate a full factorial design is shown as: 2 𝑘 • Where k is the number of input variables or factors • 2 = the number of “levels” that will be used for each factor 43©Product Ventures, Inc., March, 2015
  • 44. Levels & Coding • Typically uses coding: -1, +1 for low & high respectively 44 Level Factor 1 Pressure (PSI) Factor 1 Coding Factor 2 Speed (MPH) Factor 2 Coding Low 25 -1 45 -1 High 35 +1 65 +1 ©Product Ventures, Inc., March, 2015
  • 45. DOE - Full Factorial With 2 Factors & 2 Levels) 45 Pressure (PSI) (Factor 1) 25 PSI 35 PSI Speed (MPH) (Factor 2) 45 65 (-1,+1) (+1,+1) (-1,-1) (+1,-1) ©Product Ventures, Inc., March, 2015
  • 46. DOE Full Factorial Combinations For our example of 2 factors & 2 levels: 2 𝑘 46 Number of factors; In this case we have 2 factors “Pressure” & “Speed” Number of Levels; In this case we have 2 levels “high” & “low” 22 = 4 Combinations ©Product Ventures, Inc., March, 2015
  • 47. Full Factorial Test Combinations “Standard Order” – (not randomized & no replicates) 47 Test Run No. Factor 1 Pressure (PSI) Factor 2 Speed (MPH) Factor 1, Factor 2 Test Coding 1 25 45 -1, -1 2 35 45 +1, -1 3 25 65 -1, +1 4 35 65 +1, +1 ©Product Ventures, Inc., March, 2015
  • 48. 3 Factors & 2 Levels Let’s add one more input variable (Fuel Type) Type A & Type B 48 Level Factor 1 Pres- sure (PSI) Factor 1 Coding Factor 2 Speed (MPH) Factor 2 Coding Factor 3 Fuel Factor 3 Coding Low 25 -1 45 -1 A -1 High 35 +1 65 +1 B +1 ©Product Ventures, Inc., March, 2015
  • 49. DOE - Full Factorial With 3 Factors & 2 Levels 49 Pressure (PSI) (Factor 1 = Y) 25 (-) 35 (+) Speed (MPH) (Factor 2 = X) 45(-) 65 (+) (-1,+1,-1) (+1,+1,+1) (-1,-1,-1) (+1,-1,-1) Fuel (Factor 3 = Z) A (-) B (+) (+1,-1,+1)(-1,-1,+1) (+1,+1,-1) (-1,+1,+1)X,Y,Z (Respectively) ©Product Ventures, Inc., March, 2015
  • 50. 3 Factors & 2 Levels – (8 combinations) 50 Std. Run Order (Yates Order) Tire Pressure 25 PSI = -1 35 PSI = +1 Speed 45 MPH= -1 65 MPH= +1 Fuel A=-1 B=+1 Response (MPG) 1 -1 -1 -1 45 2 +1 -1 -1 55 3 -1 +1 -1 33 4 +1 +1 -1 32 5 -1 -1 +1 48 6 +1 -1 +1 49 7 -1 +1 +1 25 8 +1 +1 +1 33 ©Product Ventures, Inc., March, 2015
  • 51. DOE - Full Factorial - 3 Factors & 2 Levels (MPG Responses Shown) 51 Pressure (PSI) (Factor 1 = Y) 25 (-) 35 (+) Speed (MPH) (Factor 2 = X) 45(-) 65 (+) (55 MPG) (33 MPG) (45 MPG) (33 MPG) Fuel (Factor 3 = Z) A (-) B (+) (25 MPG)(48 MPG) (32 MPG) (49 MPG) ©Product Ventures, Inc., March, 2015
  • 52. Back to Station “F” Quoting Issue Factors & levels shown below 52 Level Factor 1 Operator Factor 2 Process Type Factor 3 Input Method Low New Computerized Fax High Experienced Manual Email ©Product Ventures, Inc., March, 2015
  • 53. ©Product Ventures, Inc., March, 2015 53
  • 54. ©Product Ventures, Inc., March, 2015 54
  • 55. ©Product Ventures, Inc., March, 2015 55
  • 56. ©Product Ventures, Inc., March, 2015 56 Minitab Populates Columns C1-C7 After Design is Completed Experimenter Populates the “Response” Column (C8) After Tests are Done
  • 57. ©Product Ventures, Inc., March, 2015 57 Then Select “Factorial plots” to get Main Effects & Interaction Plots. Select “Cube Plot” to Get Same.
  • 58. ©Product Ventures, Inc., March, 2015 58 Factors & Interactions (A,C,B, & BC) are Statistically Significant
  • 59. ©Product Ventures, Inc., March, 2015 59
  • 60. ©Product Ventures, Inc., March, 2015 60
  • 61. ©Product Ventures, Inc., March, 2015 61
  • 62. Observations & Next Steps 1. Standardize “Computerized” process 2. Train operators to one (computerized) process 3. Do Data tagging - find out issues with the Fax 4. Populate value stream map to show waste 5. Show Value Added vs. Non Value Added time 6. Design Standard work for flow (all stations) 7. Consider “runner” to deliver FAXes or localize 8. Plot WIP, Lead Time, Rework & Throughput daily 9. Design a visual Queue to work FIFO & make it easy to see “work in temporal jeopardy” ©Product Ventures, Inc., March, 2015 62
  • 63. Lessons Learned SIX Sigma Enabled: 1. Me to “get project started” with little data 2. My frustration level to be lowered significantly 3. Me to logically formulate “next steps” during project 4. Revelation of a “Systemic Problem”- didn’t lead the team down wrong path chasing “Special Causes” 5. All involved to “rally around” logical process analyses & not emotional “gut-feel” or “finger-pointing” 6. Us to see our system from the customer’s viewpoint ©Product Ventures, Inc., March, 2015 63