
Recommended
More Related Content
Similar to Business Game, final presentation (thesis)
Similar to Business Game, final presentation (thesis) (20)
More from Jacopo Farina
More from Jacopo Farina (11)
Recently uploaded
Recently uploaded (20)
Business Game, final presentation (thesis)
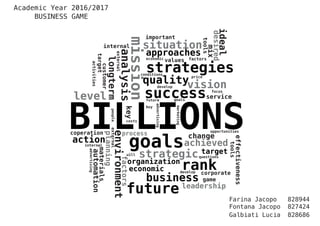
- 1. internal mission analysisexternal longterm customer target activities level BILLIONS quality success vision future develop goals conditions strategies situation approacheseconomic values key buy advertising costs people marketing price important ideal desired tools mix factors service focus goals process change achieved opportunities coperation action environment planning external strategicwill organization factors economic target questions rank materials internal automationadvertising business develop tools effectiveness future leadership game corporate Farina Jacopo Fontana Jacopo Galbiati Lucia 828944 827424 828686 Academic Year 2016/2017 BUSINESS GAME
- 2. AGENDA > > Corporate strategy Marketing mix > Period analysis •first period •second period •third period •fourth period •fifth period > Final results > To be
- 3. CORPORATE STRATEGY Cost leadership or differentiation DIFFERENTIATION “Provide quality, provide excellence” MISSION:
- 5. • Automation technlogy • Local raw materials MARKETING MIX
- 6. • Automation technlogy • Local raw materials • Premium price MARKETING MIX
- 7. • Automation technlogy • Local raw materials • Advertising • Customer service • Premium price MARKETING MIX
- 8. • Automation technlogy • Local raw materials • Advertising • Customer service • Premium price • Focus on central stores MARKETING MIX
- 9. • Automation technlogy • Local raw materials • Advertising • Customer service • Max effectiveness with min costs • Premium price • Focus on central stores MARKETING MIX
- 10. FIRST PERIOD •price > average •-35 employers •training >> average •custserv >> average •advertising > average •greeninv < average •-20 machines •automation technology: 5 MLNs •+17 vehicles •+5,8 MLNs
- 11. FIRST PERIOD •price > average •-35 employers •training >> average •custserv >> average •advertising > average •greeninv < average •-20 machines •automation technology: 5 MLNs •+17 vehicles •+5,8 MLNs RESULTS EBIT SHARE QUALITY + % % - -3,9MLNs -50 % +6,4 % €
- 12. SECOND PERIOD •price > average •-20 employers •training >> average •custserv >> average •advertising > average •greeninv > average •automation technology: 3 MLNs •+1 outlet //
- 13. SECOND PERIOD •price > average •-20 employers •training >> average •custserv >> average •advertising > average •greeninv > average •automation technology: 3 MLNs •+1 outlet // RESULTS EBIT SHARE QUALITY % % +-€ +5,9MLNs +113 % +1,1 %
- 14. THIRD PERIOD •price > average •-15 employers •training > average •custserv > average •advertising > average •greeninv >> average •+40 machines •automation technology: 4 MLNs •-2 MLNs //
- 15. THIRD PERIOD •price > average •-15 employers •training > average •custserv > average •advertising > average •greeninv >> average •+40 machines •automation technology: 4 MLNs •-2 MLNs // RESULTS EBIT SHARE QUALITY % % +-€ +4,1MLNs +37 % +1,5 %
- 16. FOURTH PERIOD •price > average •+60 employers •training > average •custserv > average •advertising > average •greeninv > average •automation technology: 4,5 MLNs •+5 vehicles •+2 outlets •-3,5 MLNs
- 17. FOURTH PERIOD •price > average •+60 employers •training > average •custserv > average •advertising > average •greeninv > average •automation technology: 4,5 MLNs •+5 vehicles •+2 outlets •-3,5 MLNs RESULTS EBIT SHARE QUALITY % % +-€ +6,8MLNs +10,5 % +1,3 %
- 18. FIFTH PERIOD •price > average •+60 employers •training > average •custserv > average •advertising >> average •greeninv > average •+30 machines •automation technology: 5 MLNs •+5 vehicles •+2 outlets •-5,8 MLNs
- 19. FINAL RESULTS € 0,00 €(3.958.855,00) €1.976.975,00 €6.106.338,00 €12.884.860,00 €14.207.713,00 €6.454.640,00 -‐€ 6.000.000,00 -‐€ 4.000.000,00 -‐€ 2.000.000,00 € 0,00 € 2.000.000,00 € 4.000.000,00 € 6.000.000,00 € 8.000.000,00 € 10.000.000,00 € 12.000.000,00 € 14.000.000,00 € 16.000.000,00 0 1 2 3 4 5 CUMULATIVE PROFIT PERIOD Cumulative Profit Billions Biley Furniture • market leader •cumulative EBIT accounts for over 14.000.000 € •Market share in volume reached on average 20% After 5 periods:
- 20. 14,4 7,3 15,6 21,5 23,8 27,5 22,49 0 5 10 15 20 25 30 0 1 2 3 4 5 SHARE VALUE PERIOD Share value Billions Biley Furniture FINAL RESULTS the value of the company shares increased by 90%
- 21. FINAL RESULTS 69,5 72,9 74,9 75,7 73,8 74,2 69,5 69,8 69,9 71,1 72,1 71,7 65 67 69 71 73 75 77 0 1 2 3 4 5 QUALITY [%] PERIOD Quality of finished goods Billions Biley Furniture our products, with a 74.2% quality level, are market leaders in terms of quality Quality is the focus of our stategy and our main strenght: quality of production process quality of finished goods12% 8,7%
- 22. •Increasing attractiveness and competitiveness of our products (competitiveness index increased by 5% ) •Higher financial soundness, resulting from a gradual reduction of the bank debts •Competence of staff and sales people •The available production and distribution capacity for the whole year •High distribution costs because of the purchase of central shops •The worsening of the local raw material quality which would affect the quality target of our finished goods •The uncertainty of the market development and of the competitor’s strategies •The entry of new potential competitors S W O T •Investiments in technological progress and environmental sustainability in order to pursue the exclusivity of our products and brand TO BE...