
Recommended
More Related Content
What's hot
What's hot (18)
Viewers also liked
Viewers also liked (20)
Similar to Mann-Whitney U Test Reveals Skin Ointment Results
Similar to Mann-Whitney U Test Reveals Skin Ointment Results (20)
More from JJkedst
More from JJkedst (20)
Recently uploaded
Recently uploaded (20)
Mann-Whitney U Test Reveals Skin Ointment Results
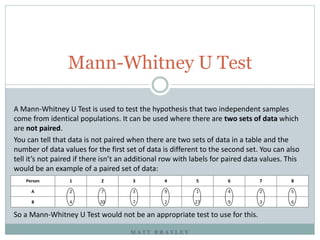
- 1. M A T T B R A Y L E Y Mann-Whitney U Test A Mann-Whitney U Test is used to test the hypothesis that two independent samples come from identical populations. It can be used where there are two sets of data which are not paired. You can tell that data is not paired when there are two sets of data in a table and the number of data values for the first set of data is different to the second set. You can also tell it’s not paired if there isn’t an additional row with labels for paired data values. This would be an example of a paired set of data: So a Mann-Whitney U Test would not be an appropriate test to use for this. Person 1 2 3 4 5 6 7 8 A 2 7 3 9 1 4 2 5 B 4 20 7 2 27 9 3 6
- 2. Outpatients attending a clinic for a specific skin disease were asked to take part in a trail of a new ointment. Of these patients, 22 were selected at random and listed in alphabetical order. The first 12 were treated with the new ointment and the remaining 10 were treated with the standard ointment. The percentage improvement observed after six weeks of treatment was as follows: Example Question New Ointment 34 29 18 25 36 21 42 50 38 26 31 41 Standard Ointment 18 20 12 40 27 22 35 15 28 51 Carry out a Mann-Whitney U test, using the 5% significance level, to investigate whether patients who used the new ointment achieved a greater percentage improvement.
- 3. 1. The first step is to write your hypotheses: H0 is always: Samples are taken from identical populations H1 is always: Samples are not taken from identical populations, the two averages are different (two tailed test) OR one average is greater than the other (one tailed test) 2. Rank the table of numbers in order from smallest to largest, like this: Steps 14 12 3.5 8 16 6 20 21 17 9 13 19 New Ointment 34 29 18 25 36 21 42 50 38 26 31 41 Standard Ointment 18 20 12 40 27 22 35 15 28 51 3.5 5 1 18 10 7 15 2 11 22
- 4. 3. Add the ranks of the New Ointment and the ranks of the Standard Ointment: TN = 158.5 TS = 94.5 4. Calculate the test statistic for each of your totals. The formula is: This is given to you in the formula booklet, so there’s no need to remember it! Steps 14 12 3.5 8 16 6 20 21 17 9 13 19 New Ointment 34 29 18 25 36 21 42 50 38 26 31 41 Standard Ointment 18 20 12 40 27 22 35 15 28 51 3.5 5 1 18 10 7 15 2 11 22 ‘T’ means total; in this question, I have used ‘N’ to represent the New Ointment and ‘S’ to represent the Standard Ointment. You should set it out in the same way.
- 5. The Test Statistic is the smaller of these two values: 39.5. 5. Use Page 33 in the Formula Booklet and determine which table you need to use. This is the second table for this question because we are doing a two tailed test at the 5% significance level. Use the values you’ve written down for m and n to find your Critical Value. This is 30, for our example. Steps TN = 158.5 TS = 94.5 U1 = 158.5 – 12(13) ÷ 2 = 80.5 U2 = 94.5 – 10(11) ÷ 2 = 39.5
- 6. Conclusion If the Test Statistic is ≤ the Critical Value, then you Reject H0. 6. You can now conclude in context. The Test Statistic for this example is 39.5 The Critical Value for this example is 30 As 39.5 is > 30, accept H0. There is significant evidence at the 5% level that there is a difference between the percentage improvement and the use of the new ointment. Notice that the same wording has been used to write the conclusion.