
Recommended
Recommended
More Related Content
Similar to basims Nutrients Report 092616 - 122616Your personal Ca.docx
Similar to basims Nutrients Report 092616 - 122616Your personal Ca.docx (16)
More from JASS44
More from JASS44 (20)
Recently uploaded
Recently uploaded (20)
basims Nutrients Report 092616 - 122616Your personal Ca.docx
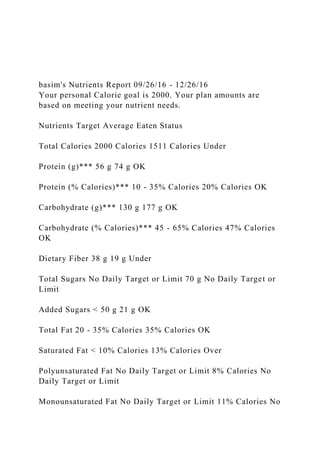
- 1. basim's Nutrients Report 09/26/16 - 12/26/16 Your personal Calorie goal is 2000. Your plan amounts are based on meeting your nutrient needs. Nutrients Target Average Eaten Status Total Calories 2000 Calories 1511 Calories Under Protein (g)*** 56 g 74 g OK Protein (% Calories)*** 10 - 35% Calories 20% Calories OK Carbohydrate (g)*** 130 g 177 g OK Carbohydrate (% Calories)*** 45 - 65% Calories 47% Calories OK Dietary Fiber 38 g 19 g Under Total Sugars No Daily Target or Limit 70 g No Daily Target or Limit Added Sugars < 50 g 21 g OK Total Fat 20 - 35% Calories 35% Calories OK Saturated Fat < 10% Calories 13% Calories Over Polyunsaturated Fat No Daily Target or Limit 8% Calories No Daily Target or Limit Monounsaturated Fat No Daily Target or Limit 11% Calories No
- 2. Daily Target or Limit Linoleic Acid (g)*** 17 g 11 g Under Linoleic Acid (% Calories)*** 5 - 10% Calories 7% Calories OK Linolenic Acid (% Calories)*** 0.6 - 1.2% Calories 0.7% Calories OK Linolenic Acid (g)*** 1.6 g 1.1 g Under Omega 3 - EPA No Daily Target or Limit 86 mg No Daily Target or Limit Omega 3 - DHA No Daily Target or Limit 209 mg No Daily Target or Limit Cholesterol < 300 mg 380 mg Over Minerals Target Average Eaten Status Calcium 1000 mg 740 mg Under Potassium 4700 mg 2631 mg Under Sodium** < 2300 mg 2212 mg OK Copper 900 µg 1231 µg OK Iron 8 mg 12 mg OK Magnesium 400 mg 229 mg Under Phosphorus 700 mg 1176 mg OK
- 3. Selenium 55 µg 117 µg OK Zinc 11 mg 9 mg Under Vitamins Target Average Eaten Status Vitamin A 900 µg RAE 861 µg RAE Under Vitamin B6 1.3 mg 1.5 mg OK Vitamin B12 2.4 µg 3.0 µg OK Vitamin C 90 mg 92 mg OK Vitamin D 15 µg 8 µg Under Vitamin E 15 mg AT 8 mg AT Under Vitamin K 120 µg 157 µg OK Folate 400 µg DFE 394 µg DFE Under Thiamin 1.2 mg 1.5 mg OK Riboflavin 1.3 mg 1.8 mg OK Niacin 16 mg 15 mg Under Choline 550 mg 333 mg Under Information about dietary supplements. *** Nutrients that appear twice (protein, carbohydrate, linoleic acid, and linolenic acid) have two separate recommendations:
- 4. 1) Amount eaten (in grams) compared to your minimum recommended intake. 2) Percent of Calories eaten from that nutrient compared to the recommended range. You may see different messages in the status column for these 2 different recommendations. javascript:void%20window.open('http://ods.od.nih.gov/'); basim's Nutrients Report 09/25/16 - 09/25/16 Your personal Calorie goal is 2000. Your plan amounts are based on meeting your nutrient needs. Nutrients Target Average Eaten Status Total Calories 2000 Calories 1674 Calories Under Protein (g)*** 56 g 65 g OK Protein (% Calories)*** 10 - 35% Calories 16% Calories OK Carbohydrate (g)*** 130 g 197 g OK Carbohydrate (% Calories)*** 45 - 65% Calories 47% Calories OK Dietary Fiber 38 g 14 g Under Total Sugars No Daily Target or Limit 90 g No Daily Target or Limit Added Sugars < 50 g 52 g Over
- 5. Total Fat 20 - 35% Calories 38% Calories Over Saturated Fat < 10% Calories 13% Calories Over Polyunsaturated Fat No Daily Target or Limit 11% Calories No Daily Target or Limit Monounsaturated Fat No Daily Target or Limit 10% Calories No Daily Target or Limit Linoleic Acid (g)*** 17 g 17 g OK Linoleic Acid (% Calories)*** 5 - 10% Calories 9% Calories OK Linolenic Acid (% Calories)*** 0.6 - 1.2% Calories 1.2% Calories OK Linolenic Acid (g)*** 1.6 g 2.3 g OK Omega 3 - EPA No Daily Target or Limit 18 mg No Daily Target or Limit Omega 3 - DHA No Daily Target or Limit 78 mg No Daily Target or Limit Cholesterol < 300 mg 134 mg OK Minerals Target Average Eaten Status Calcium 1000 mg 1074 mg OK Potassium 4700 mg 2014 mg Under Sodium** < 2300 mg 3756 mg Over
- 6. Copper 900 µg 867 µg Under Iron 8 mg 10 mg OK Magnesium 400 mg 164 mg Under Phosphorus 700 mg 1331 mg OK Selenium 55 µg 112 µg OK Zinc 11 mg 8 mg Under Vitamins Target Average Eaten Status Vitamin A 900 µg RAE 381 µg RAE Under Vitamin B6 1.3 mg 0.8 mg Under Vitamin B12 2.4 µg 4.7 µg OK Vitamin C 90 mg 16 mg Under Vitamin D 15 µg 2 µg Under Vitamin E 15 mg AT 7 mg AT Under Vitamin K 120 µg 107 µg Under Folate 400 µg DFE 404 µg DFE OK Thiamin 1.2 mg 0.8 mg Under Riboflavin 1.3 mg 1.0 mg Under
- 7. Niacin 16 mg 14 mg Under Choline 550 mg 147 mg Under Information about dietary supplements. *** Nutrients that appear twice (protein, carbohydrate, linoleic acid, and linolenic acid) have two separate recommendations: 1) Amount eaten (in grams) compared to your minimum recommended intake. 2) Percent of Calories eaten from that nutrient compared to the recommended range. You may see different messages in the status column for these 2 different recommendations. javascript:void%20window.open('http://ods.od.nih.gov/'); 89 Name ___________________________ NUR 223 Nutrition Project Questions- Fall 2016 According to Table 1 analysis which nutrient(s) were you deficient (fiber, vitamin C, calcium, iron) or did you overconsume (calories, fat, saturated fat, trans fat, cholesterol, sodium)? (2 points) According to Table 1, which food’s nutrient content surprised you? List food and nutrient. (1 point) Using the information from Table 1, determine your % of calories from carbohydrate, protein and fat. Also determine
- 8. your personal goals for % of calories from carbohydrate, protein and fat. (4 points) Table 1 RDI % Goals Your Personal % Goals % calories from carbohydrate 45-65% % calories from protein 10-35% % calories from fat 20-35% Should total 90-110% 100% Using Table 1, evaluate your distribution of calories from CHO, PRO and FAT (result on above table). Is it just right or do you think you should make some changes? Explain. (3 points) Based on Table 1 analysis, write 1 specific, measurable goal. (2 points) 1. Based on Table 2, what conclusions do you make regarding your eating behaviors? (3 points)
- 9. Based on Table 3- Vegetable Variety analysis, write 1 specific, measurable goal. (2 points) 1. Name ___________________________________ According to the My Daily Food Plan and Food Tracker evaluate your food group intake: (4 points) Grains Group: Fruit Group: Dairy Group: Protein Group: According to the Food Tracker analysis evaluate added sugar intake from the Nutrient Report: (2 points) Based on My Daily Food Plan/Food Tracker analysis, write 1 specific, measurable goal. (2 points) 1. According to the Food Tracker - Nutrient Report analysis evaluate your intake AND the balance of your fat intake. (3 points)
- 10. Intake in grams and/or % Goal High-Low-Just Right Total Fat 20-35% of total calories Saturated Fat 10% or less of total calorie Polyunsaturated Fat 10% of total calories Monounsaturated Fat Up to 15% of total calories Linoleic (Omega-6) Linolenic (Omega-3 What is your assessment of the balance of your saturated, polyunsaturated and monounsaturated fat intake: Based on your analysis of your fat intake, write 1 specific, measurable goal. (2 points) 1.
- 11. What are your conclusions about your diet based on your method of choice analysis? (3 points) Name _____________________________ Looking at all the methods of analysis, what conclusions do you make about your dietary intake? Were some nutrients always high or low? What trends do you see? (2 points) What was the most surprising/amazing thing you learned about your diet from this analysis project and why? (1 point) Choose a word or phrase from the 2015 Dietary Guidelines. Use that word or phrase to assess/compare/set a goal for your diet. (2 points)Which method of dietary analysis would you most likely use? What did you like about it, what didn’t you like about it? (2 points) Choose one product or food that you typically eat and find a similar food that would be healthier or would help you to meet your nutrition goals. Give the names of both products and then describe what makes the replacement product nutritionally better. (2 points) Example: Product to replace: Skippy Peanut Butter Product to purchase or try: Whole Foods 365 Creamy Peanut Butter Product Attribute: peanuts and salt only ingredients, no hydrogenated fats; price is comparable. Product to replace: New product to purchase or try: New product attribute(s): PAGE 1
- 12. Name ______________________________ Behavioral Influences on Food Choices- Table 2 Food Consumed Reason(s) For Eating Hunger Level Location Eating Style
- 16. Reason For Eating- Examples may be: flavor/texture, convenience, emotions (boredom, depression, happy, comfort, stress, etc.), available, advertisement, health reason, hunger, family/cultural/religious, peers, cost, nutrition knowledge, prepared for you, etc. There may be more than one reason for making a food choice. Hunger Level- Rate how hungry you were when you ate this food, 1- not hungry, 2 moderately hungry, 3 – regular meal/snack time, 4- very hungry Location- home (kitchen, family room, t.v., dining room, bedroom, deck, etc.), restaurant, car, school, gym, friend’s home, parent’s home, etc. Eating Style- Convenience, fast food, restaurant, homemade, cafeteria, fresh, frozen, etc. Name__________________ Diet Analysis Using Food Composition Tables/Food Labels
- 17. Form - Table 1 Food Amount Consumed Calories CHO (gm) Protein (gm) Total Fat (gm) Saturated Fat (gm) Trans Fat (gm) Sodium (mg) Fiber (gm) Cholesterol (mg) Calcium (mg) Iron (mg) Vitamin C (mg)
- 26. Your Totals
- 27. Your Goals 45-65% of calories .8 gm/kg or 10-35% calories 20-35 % of calories < 10% of calories 1% of calories < 2300 or < 1800 mg mg > 25 or 38 grams < 300 mg 100% or mg 100% or mg 100% or mg My Plate Vegetable Variety Analysis- Table 3 Estimate cup amounts consumed each day. Dark Green Red and Orange Beans and Peas Starchy Other Sunday
- 29. Total Intake Recommended Intake Use ChooseMyPlate Weekly Vegetable Subgroup Table recommendations to complete the chart (2 points). What conclusions do you make from your week of vegetables? (3 points) NUR 223 NUTRITION PROJECT DIRECTIONS Objectives: 1. To provide practical experience in diet assessment and evaluation. 2. To provide opportunity to set goals in relation to assessed diet intake and diet goals. 3. To provide opportunity to evaluate various methods of diet assessment. 4. To provide experience in using food composition tables, the My Plate and Daily Food Plan, the Recommended Dietary Allowances.
- 30. 5. Identify foods that would help to achieve a lower sodium, lower saturated fat, high fiber and high calorie, high protein diet. 6. To provide an opportunity to evaluate and improve, if necessary, current dietary habits. Project Components: ● 1 day of diet analysis using food composition tables and food labels (5 points) - Table 1 ●1 day of behavioral influences on food choices (5 points) - Table 2 ● Completion of 1 week of Vegetable Variety Analysis – (5 points) – Table 3 ●1 day of diet analysis using the Daily Food Plan and FoodTracker. For full credit print and submit the following: (8 points) 1. Daily Food Plan Printout- (1 point) 2. Completed My Daily Food Plan Worksheet (3 points) 3. SuperTracker using Food Tracker – one day (3 points) 4. My Reports- Nutrient Report (1 point) ●1 day of diet analysis using any diet analysis program- on line, app, etc. (5 points) ● Diet Analysis Questions (42 points) ● 70 total points General Directions: 1. Select a typical day of dietary intake to record. Write down
- 31. everything you eat and drink for the day. Do NOT choose fasting or sick days. Try to choose a day in which you ate a reasonable amount of foods to analyze. 2. Use different days for each method of analysis, Table 1, 2, Supertracker and “my choice”. 3. Carefully try to estimate portion sizes and describe the food. (i.e. 1 ½ cups skim milk). Remember condiments, beverages and snacks. 4. Do not include vitamin-mineral supplements. You may include food based supplements such as shakes, beverages, bars. 5. You will not be graded on what you ate. Eating to impress or shock the instructor defeats the purpose of this assignment. 6. Do not turn in project in binders or pages inserted into page covers. Write your name on each page and staple or clip together. Review of Project Components 1.Diet Analysis Using Food Composition Tables and Food Labels (Table 1) Using the nutrient intake form provided to you (Table 1) calculate the nutrient intake for each item consumed. You may use information from the food label, or any nutrition reference that provides the nutrition content of foods. The following websites are fun data bases that can be used as well: www.nutritiondata.com or www.nal.usda.gov/fnic (click on Food Composition icon). I do not recommend using www.calorieking.com, it does not have all the nutrients required on table 1. Choose the closest food option to what you ate. For example, if you ate a cheese enchilada, but can only find data for a chicken enchilada, use the chicken enchilada data or breakdown the food into tortilla, cheese, enchilada sauce.
- 32. Record data in appropriate columns, then total. Recommendations or Your DRI’s At the bottom of the form, fill in your nutrient intake goals, nutrient recommendations and DRI’s. If you have specific needs, such as a protein intake at 40% of total calories, feel free to calculate and use your specific needs as a part of this analysis. There are no right or wrong answers here. You will find nutrition information for the vitamins and minerals as either a % or in a mg/IU measure. Choose one way to analyze. % should add up to 100% or you may need to convert to an actual measure as outlined below: A. Calculating Nutrient Intake for Vitamins A and C and Iron and Calcium from the Food Label i. These nutrients are listed by % of Daily Value. The Daily Value for Vitamin A = 5000 IU; Vitamin C= 60 mg; Iron= 18 mg, Calcium = 1000 mg ii. To calculate the actual amount of a nutrient consumed, multiply the Daily Value by the % listed on the package. For example, if you ate 1 cup of cereal that provided 10% of the Daily Value for Vitamin C: 60 mg x .10 = 6 mg vitamin C consumed 2. Behavioral Influences on Eating (Table 2) Complete Table 2 describing the behavioral influences related to food using key at the bottom of the page. 3. Complete the Vegetable Variety analysis. (Table 3)
- 33. a. Track vegetable intake for one week using Vegetable Variety chart. Your Daily Food Plan will tell you how much is needed from each vegetable group for the week. You can also find information about where vegetables fit at www.choosmyplate.gov, on the green bar at the top of the homepage select “MyPlate”, the vegetables. 4. ChooseMyPlate Daily Checklist: a. Log onto www.choosemyplate.gov b. In the top blue section select “Online Tools”, then select “Daily Checklist”. Either select a calorie level (from grid on the bottom” or click on the light blue “daily checklist” enter personal information to calculate a food plan. Open and print off the two (2) My Daily Checklist documents. Complete the worksheet for one (1) day. Submit both documents with your project. 5. SuperTracker analysis using ChooseMyPlate. a. Log onto www.choosemyplate.gov b. In the top blue bar select “Online Tools”, then ”Supertracker”. c. Click on the d. Click on “Track Food and Activity” then “Food Tracker”. e. Create a Profile or log in if you want to save your work/day intake. f. Analyze your days intake by 1. Search food group/type and select, then Type in food consumed, hit “Go”, then
- 34. choose amount, meal, then +Add 2. Enter all foods and beverages consumed. 3. Print out the Food Tracker page for the day (see print icon at the top of the page) and submit with project. . 6. Under My Reports tab at the top of the page, select date entered and create reports. Print the Nutrient Intake Report . 6. Student Choice computer analysis a. Analyze one day of dietary intake using any program. Programs available online include, but are not limited to: www.myfitnesspal.com, www.livestrong.com (MyPlate tracker), www.myfoodrecord.com, www.fitday.com, etc. My Fitness Pal (app) is a great free app! Join on-line programs for a free week such as www.calorieking.com or use SuperTracker for a second day. 7. Complete Diet Analysis Questions a. Answer all questions for full credit. Be specific and thorough. Grading1. Grading Guidelines a. Nutrition projects are due on Monday, October 31st, 2016. c. The project will be graded on the completeness of work and correct calculations. College level writing for grammar, spelling, sentence structure and organization of thought is expected. Points will be deducted for not meeting these criteria. d. Incomplete charts, questions or missing components of the project will result in deduction of points. e. Answers will be graded on the logic of conclusions. Conclusions about your diet must be consistent with the
- 35. evidence and goals must be based on conclusions. f. Nutrition Projects may NOT BE TURNED in by e-mail or through Blueline for the live class. 2. Early Grading a. Completed projects may be turned in on October 10th (at class) or October 11th-14thth to Mary Watson’s mailbox, CON office, Criss Building 1st floor to be included in the mid-term grade, without corrections. b. Projects may also be turned in on October 24th at class to Mary Watson for early grading. Early projects will be graded and returned to the student to make corrections. Corrections need to be completed and turned in on or before December 5th, 2016. 3. Late Projects a. Projects turned in after October 31st will be penalized 10 points for each late week. Late projects may only to turned in to Mary Watson on Monday’s at class. Grading Rubric Nutrition Project Points Table 1- Hand Calculated Diet Analysis 5 Table 2- Behavioral Influences 5 Table 3- Vegetable Variety Analysis 5 ChooseMyPlate.gov
- 36. My Plate Daily Checklist- printout (1 point) Completed My Plate Daily Checklist Worksheet (3 points) SuperTracker diet analysis printout, 1 day (3 points) MyReports- Nutrient Report (1 point) 8 Student Choice Diet Analysis, printout, 1 day 5 Nutrition Project Questions 42 Total 70 PAGE 5