SlideShare a Scribd company logo
1 of 14
Assessing the accuracy
of remote sensing of
land cover change
detection for urban
ecosystem accounting
Introduction
Time-series of satellite imagery have a large potential for the
continuous monitoring of urban land cover changes. Slow and
fragmented land cover change in urban ecosystems pose a
challenge for urban ecosystem extent and condition accounting.
Little research has been done on the accuracy of high-resolution
open source data such as Copernicus Sentinel-2 for this
purpose. Assessment of uncertainty and confidence in trend
detection is rare in ecosystem accounting applications
Objectives
• Quantify the accuracy of change detection depending on the
type of land cover change
• Assess recommended size of a basic spatial unit and length
of accounting period as a function of type of landcover
change and the change detection accuracy of the remote
sensor
Methods
Results
• Change patches of 50 m2 (i.e. half of the size of the Sentinel-2 pixel) allowed detection of
changes smaller than the pixel size and maximized the number of classes with producer’s
accuracy > 50%.
• Different accuracy levels are associated with different land cover change types due to different
frequencies of occurrence in the area, average size of the patches, and different spectral signal.
• A four year accounting period was sufficient to detect significant trends in almost all land cover
changes
Implications for ecosystem accounting
• Direct land cover change classification allows for greater trend detection accuracy than
classifying opening and closing landcover extents
• Detection of trends in ecosystem extent and condition can have higher spatial resolution than
ecosystem service and asset accounting based on opening extents.
Authors
Megan Sarah Nowell *,
Stefano Puliti ¤, Zander
Venter*, and David N. Barton*
Affiliations
*Norwegian Institute of Nature
Research(NINA); ¤Norwegian
Institute for Bioeconomy
Research (NIBIO)
1. manual delineation of land cover change polygons 2015-
2019 for a sample of 93 square plots in Oslo, Norway.
2. train random forest classifiers iteratively by reducing the
sample size based on a minimum area threshold (5 – 100
m2)
3. calculate the overall and class-specific producer’s accuracy.
4. produce a wall-to-wall map of land cover type change for the
entire municipality using the classifier trained using all
change patch sizes > 50 m2
Source: Nowell et al. (forthcoming) Direct change mapping of urban land cover: how remote sensing can inform ecosystem accounting
GROUND TRUTHING
CHANGE MAPPING CHANGE DETECTION ACCURACY LANDCOVER CHANGE ACCOUNT
Objectives
Demonstrate the integration of extent-condition accounts for urban
trees with modeling of regulating ecosystem services and their asset
values for different urban planning and policy purposes
Test value generalization in urban ecosystem accounting - infer asset
value for a whole city accounting area with only partial asset
condition data, using machine learning and Bayesian networks
Methods
Conclusions
• Combined ecosystem extent-condition accounts can represent vegetation’s 3D structure needed to
predict regulating services using iTree Eco.
• Machine learning and Bayesian networks (BN) can be used to tackle missing data in value transfer /
generalization from a known sample to partial data on assets in a wider accounting area. BNs provide
documentation of inference uncertainty in ecosystem accounting.
• Small net aggregate changes in ecosystem extent during an accounting period may conceal large
variation in ecosystem condition affecting the spatial distribution of ecosystem services and their benefits
Authors
David N. Barton, Zofie
Cimburova, Frank Hanssen
Affiliations
Norwegian Institute of Nature
Research(NINA)
Bayesian network emulation of iTree
Eco model input-output variables
Results
Awareness raising
Estimated median
asset value of
regulating services
provided by all tree
canopy of Oslo’s
built zone ca. NOK
5,4 billion (2014)
(€ 635 million, or equivalent to
ca. 0.4% of total residential
asset value in Oslo)
iTree Eco regulating services model
estimates per tree
Source: Cimburova and Barton 2021
Regulation plan assessment
Insignificant net loss in tree canopy extent in suburban plan area 2011-2017 due to
loss of taller trees being compensated in extent (but not condition) by smaller tree
plantings. Municipal regulation of suburban infill and tree felling permits were
insufficient to avoid the loss of greenviews from large trees, while the net effect on
regulating services was negligeable.
Source: https://transect.org/
Extents
(crown
cover)
Condition
(tree height)
Thematic urban ecosystem accounts:
asset value of the regulating services
from trees in Oslo
Source: Hanssen et al. 2019
Methods
Figure 3. Distribution probability of Fucus spp. and zoomed-in example areas. Modelling and graphs: Elina
Virtanen, Finnish Environment Institute, October 2021
The capacity of a species or a habitat to provide ecosystem services (ES) depends on the area
covered (extent) and its state (condition).
Progress in marine ecosystem accounting has been hampered by the lack of information on (i)
linkages between ES and marine ecosystem components and on (ii) the influence of the state
of the marine environment on ES supply. Establishing such links will enable assessing the
costs of degradation of the marine ecosystem.
Data & models
• Underwater inventory data on species and
habitats (since 2004): 170,000 sites across
the entire Finnish sea area
(https://paikkatieto.ymparisto.fi/velmu/).
• Ca. 200 species distribution models (SDMs)
at 20 m resolution for the entire Finnish sea
area: algae, vascular plants, invertebrates
(cf. Virtanen et al. 2018; Fig. 1)
Extent
Because SDMs describe the probability
(p) of detecting a species at a given
modelling grid (400 m2), p needs to be
translated into spatial extent (E):
E = C * p * 100, where
C = median cover (0…1) for each
species, based on the VELMU inventory
data (assessed by a diver for 4 m2
sampling units)
Condition
Human activities may degrade
condition of species and habitats
producing ES. If the area covered by a
species is presently, e.g., 30 % smaller
than that projected by the SDMs, we
can hypothesize that direct human
impact decreases the ES production
by this species by 30 %.
Condition was estimated for species
and habitats affected by human
activities: dredging, dumping, landfill,
building of infrastructures (and artificial
shorelines), extraction of seabed
material and shipping lanes and
anchoring areas.
The geographical distribution (in km2)
of ES producing species was
calculated for species in the present
degraded condition and in a situation
projected by SDMs.
Results
• 48 habitats and 11 species were linked to ES (Fig. 2)
• By using SDMs, the geographical distribution (in km2) of
species producing ES was assessed
• The condition is reported for human activities which lead to
direct habitat loss per grid cell. The loss of an area is based
on the average extent (m2) of the activity in question,
estimated from aerial images (Fig. 3)
• For instance, small jetties which cover on average 20 m2,
were identified from 58 850 grid cells. In this case, the area
of habitats lost under the jetties totals 1.77 km2
Fig. 3. Degraded areas based on habitat
loss, degradation and severe disturbance in
an example area off the Capital City Helsinki
Fig. 1. Projected distribution probability of Fucus spp. In Finland and
zoomed-in examples.
• Extent of ES-producing areas can be estimated by
combining ES to species and habitats
• Condition of ES producing species (and habitats formed by
species) can be estimated by comparing the projected and
realized (current) distributions of species
Piloting Marine Ecosystem
Accounts in Finland
Background
Elina Virtanen*, Susanna Jernberg,
Soile Oinonen, Markku Viitasalo
Finnish Environment Institute SYKE
FI-00790 Helsinki
*elina.a.virtanen@syke.fi
Objectives
1. Link species and habitats to ecosystem
services
2. Use species and habitat modelling to
determine ecosystem extent and
condition
3. Use this information to develop
biophysical marine ecosystem accounts
in Finland
Conclusions
Regulating services
Provisioning services
Cultural services
Habitat
Habitat
Species
Species
Habitat
Fig. 2. Conceptual presentation of linking of species and habitats to ES (Jernberg et
al., in prep.).
Habitat forming eelgrass Zostera marina in
SW coast of Finland. Photo: Mats Westerbom
Modelling
aesthetic
ecosystem
services using
social media and
computer vision
Introduction
 The aesthetic quality of the landscape is a key source of cultural
value in Europe.
 However, capturing this value is difficult at large-scales due to the high
cost and complexity of survey methods.
 Now, the emergence of big data including social media and computer
vision techniques enable new approaches.
 We explore the potential of Flickr images and computer vision to
establish measures of aesthetic ecosystem service supply
Objectives
Aim: Develop aesthetic ecosystem service methods using big
data from social media and computer vision
Questions:
1. Does multiplying the quantity of images with their quality
capture peoples’ aesthetic enjoyment of the landscape?
2. Can computer vision capture the aesthetic quality of the
landscape in different European settings?
3. How does ecosystem service supply change at different
measurement scales?
Methods
Results
 Aesthetic ecosystem service model applied in Great Britain, Spain and the Netherlands.
 The ratings generated by the computer vision model are being validated using alternative datasets in
the Netherlands and Spain.
 Opportunity to re-train computer vision model using Spanish questionnaire results.
 Promising results show applying image filters methods better represents aesthetic utility such as only
using images with natural elements.
Conclusion
 Flickr data and computer vision can be used to establish measures of aesthetic ES.
 Higher resolution analysis better captures the aesthetic benefits generated by natural ecosystems in the
peri-urban environment.
 Strong experimental base on which to continue exploring aesthetic ES methods.
Authors
Ilan Havinga1,
Patrick Bogaart2,
Adrián García Bruzón3,
Fernando Santos Martín3,
Lars Hein1
Affiliations
1Wageningen University
2Statistics Netherlands
3Universidad Rey Juan Carlos
 Multiple scales: 1 and 25km2 grid cells.
 Aesthetic service (utility) = quantity (density of
Flickr images) * quality (image ratings).
 Image ratings generated using a computer
vision model trained on British image dataset.
 Questionnaire in Spain to test accuracy of
image ratings for Spanish landscapes.
 Filtering methods applied to only select
images related to aesthetic enjoyment
including non-urban filter, image rating filters
and image content analysis.
 Comparison to environmental indicator model
of landscape aesthetics in the Netherlands.
 Figure 1. Aesthetic ecosystem service supply for (a) the Netherlands at 25km2 and in (b) the Randstad area
at 1km2. Filters have been applied to exclude urban areas and only include images with natural attributes.
Flood regulation ecosystem
services accounting of
mountain watersheds in
Bulgaria
Introduction
Ecosystems’ ability to absorb and store water provide flood regulation services - one of their most important contributions, which yearly save
human lives and prevent property destruction. Accounting of flood prevention and mitigation effects allows for raising the efficiency and
effectiveness of the utilization and adaptation of specific ecosystem characteristics that can reduce the extent and intensity of flooding and
thus diminish the risks of loss of life and damage to build environments. In the case of river floods, the regulation functions include
prevention and mitigation. Their geospatial aspects can be represented by the, so-called, Service Providing Areas (SPA) and the Service
Demanding Areas (SDA). The geographic analysis of the interactions between SPA and SDA facilitates the development of a methodology
for flood regulation accounting at national scale. We focus on three modules of flood regulation ecosystem accounting, i.e. ES potential, ES
demand, and ES actual flow (AF), which are tested in three mountain watersheds.
Objectives
The main objective is to develop a methodology for accounting of
flood regulation ES at national scale in Bulgaria.
The account is planned in two stages: 1) account, based on three
case studies selected within the MAIA project; 2) national scale
account within the INES project, planned to start in November
2022.
The main task for the first stage are:
• Utilization of the results from KINEROS and SWAT models for
the ecosystem accounting
• Delineation of SPA, SDA, and AF for the test watersheds
• Generation of accounting tables for the test watersheds.
Methodological approach
Analysis
The main critical point of the approach involves the identification of
the SPA by hydrological modeling and, specifically, through
determining the threshold value which delineates the SPA.
The results make be a valuable contribution to the updates of the
Flood Risk Management Plans, which are among the main policy
instruments in flood regulation accounting.
Conclusion
The quantification of the flood regulation function of the ecosystems
is crucial for both ES assessment and accounting. The biophysical
modeling provides the much needed quantitative data for the entire
watershed, which is the main input, necessary for calculation of the
accounting tables’ parameters.
Authors
Stoyan Nedkov, Mariyana Nikolova,
Boian Koulov, Desislava Hristova,
Hristina Prodanova, Vanya Stojcheva
Affiliations
National Institute of Geophysics,
Geodesy, and Geography –
Bulgarian Academy of Sciences
Methods
The accounting of flood regulation is based on the assumption that
specific ecosystem characteristics can reduce the extent and
intensity of floods, thus avoiding or diminishing the risk of damage
to build environments and loss of life. The GIS-based AGWA tool,
which utilizes the KINEROS (Kinematic Runoff and Erosion)
hydrologic model, is applied in the Malki Iskar and Yantra
watersheds and the GIS-based ArcSWAT model is applied in the
Ogosta watershed. The actual flood regulation accounting is based
on the calculation of the Actual Flow (AF), as a function of SBA and
SDA.
Results
The SPA, SDA, and AF are
mapped in the three test
watershed, based on the
models’ results. Accounting
tables are prepared for 2000,
2006, 2012 and 2018. The
calculations are made for the
main ecosystem type, and
also at subtype level.
Flood regulation assessment
Flood regulation accounting
Natural Capital Accounts
in the Netherlands
Dutch accounts:
The following accounts are
regularly updated on a national
scale:
• Extent account
• Condition account
• Ecosystem services accounts
(physical and monetary)
• Ecosystem asset account
• Carbon account
• Biodiversity account
• Marine accounts (in
development)
Authors
StatNL: Jocelyn van Berkel, Chantal Blom, Patrick Bogaart, Corine Driessen, Rixt de Jong, Linda de Jongh, Redbad Mosterd, Sjoerd Schenau
WUR: Lars Hein, Marjolein Lof
Website: https://www.cbs.nl/en-gb/society/nature-and-environment/natural-capital
Valuing ecosystem services and ecosystem
assets for the Netherlands
We found that it is important to distinguish between techniques
that provide exchange values that are already incorporated in the
GDP of SNA and exchange values that are not.
In addition, we found that, from a conceptual and practical point of
view, the best valuation techniques to apply are:
• Provisioning services: Rent-based methods (e.g. stumpage
prices, rent prices for agricultural land)
• Regulating services: Replacement costs or avoided damage
costs methods
• Cultural services: consumer expenditure and hedonic pricing
Integration of biodiversity indicators into
SEEA EA
• Regionalization of farmland bird index
• Integration of farmland bird index and other relevant biodiversity
indicators in SEEA EA condition and biodiversity accounts
• Development of indicators on relation between landscape
structure and farmland bird populations
• Development of pressure indicators on farmland birds
Ecosystem services:
• Crop and fodder production
• Timber production
• Drinking water filtration
• Air filtration
• Carbon sequestration
• Pollination
• Protection against heavy rainfall
• Coastal protection
• Reduction of UHI
• Nature recreation and tourism
• Amenity service
Contributions to MAIA:
NKR Viewer (in development by SarVision):
• Viewer in Dutch with Dutch coordinate reference system
• Alignment with NKR as published by StatNL
• Plays role in upcoming stakeholder workshops
• Organization of user workshop end 2022
Natural capital accounting in the
Czech Republic
Introduction
In the Czech Republic, MAIA supported accounts include extent account and ecosystem
services accounts. Ecosystem services accounts has been focusing on carbon account
(biophysical and monetary), water purification account (biophysical and monetary) and
nature-based recreation account (monetary). Beside that, we tested the application of
value transfer approach to ecosystem accounting and water retention model. Ecosystem
accounting will become a component of the environmental-economic accounts reported
by the Czech Statistical Office.
Ecosystems extent
Authors
Davina Vačkářová, Eva Horváthová, Petr Krpec, Tomáš Baďura
Affiliation
Global Change Research Institute, Czech Academy of Sciences
Carbon account
• Carbon account presents
biocarbon supply and use
• Carbon stock in forest trees
from wood volume statistics
• Monetary carbon accounts
are based on value transfer,
SCC and MAC
Ecosystem
type
Urban
Cropland
Grassland
Woodland
and
forest
Heathland
and
shrub
Sparsely
vegetated
areas
Wetlands
Rivers
and
lakes
Total
Opening extent 509797 3703831 819866 2782873 1825 285 10689 57488 7886654
Additions to extent
Expansions 23118 32878 34230 100515 590 342 107 893 192673
Managed
expansion 23118 32878 33683 100515 51 155 88 887
Natural
expansion 0 0 547 0 539 187 19 6
Reductions to extent
Regressions 7523 62697 22331 99591 160 61 87 223 192673
Managed
regression 7523 62697 21769 98975 77 57 56 221
Natural
regression 0 0 562 616 83 4 31 2
Net change in extent 15595 -29819 11899 924 430 281 20 670
Closing extent 525392 3674012 831765 2783797 2255 566 10709 58158 7886654
Diagram of changes between ecosystem classes Ecosystem extent accounting table, 2012 - 2018
Main data source is Corine land cover
data set from Copernicus land
monitoring program
Water retention
• Testing of hydrological model
application for water budget
estimation on a national scale
• Main output is yearly retained
water in mm (avoided direct
runoff) for hydrological
response units
Value transfer
• We tested the applicability of value transfer approach to
ecosystem accounting
• Meta-analysis of forest valuation studies was performed for
Europe based on studies in the period 2000 - 2017
• We found that the total value of forest is approximately
2842 US$ ha−1 year−1, with regulation and maintenance ES
being the most valuable services
• These results were applied to monetary supply and use table
Nature motivated tourism
• Uses (i) Tourism Satellite Account data and (ii) two surveys conducted
with tourists in the Czech Republic
• Determines portion of tourism related spending in Czechia that could
be attributed to nature motivated trips
• Estimated for (a) all trips and (b) trips that were for recreation only
Water filtration – monetary account
• Based on replacement cost of drinking water treatment in
comparison of surface and groundwater sources
• The difference in production costs of drinking water from
groundwater and surface ranged between
0.078 and 0.093 EUR  m-3
Ecosystem types
Measurement
units
Cropland
Woodland
and
forest
Urban
Heathland
and
shrub
Grassland
Rivers
and
lakes
Wetlands
Sparsely
vegetated
a.
TOTAL
SUPPLY
Groundwater purification
K EUR/
year 9,533 6,746 2,626 2,274 1,806 274 31 2 23,293
Total 23,293
2018 2019 2020
Tourism spending total (EUR mil.) 11,915 12,330 5,432
Nature Motivated Spending
All trips 4,356 4,492 2,209
Proportion 51% 52% 56%
Recreation only trips 3,103 3,341 1,643
Proportion 36% 37% 42%
Institutional sector
Measurement
units
agriculture
forestry
fisheries
mining
and
quarrying
manufacturing
construction
electricity,
gas
supply
water
collection,
treatment,
supply
other
industries
households
TOTAL
USE
groundwater
purification K EUR/ year 23,293 23,293
Total 23,293 23,293
National Monitoring Data &
Accounting for Biodiversity
Introduction
There is now a growing group of countries producing SEEA Ecosystem Accounts for mainstreaming biodiversity into decision-making. The
core accounts of the SEEA EA allow for the broad measurement of ecosystem-level biodiversity and integration with standard economic
information. The SEEA EA also describes thematic accounting for biodiversity, as one of four themes in Chapter 13. Thematic accounting for
biodiversity opens up the potential for integrating information on ecosystems to better support decision-making.
In order to achieve the best representation of biodiversity in ecosystem accounts, account compilers need data that accurately describes the
distribution and condition of different components of biodiversity. National biodiversity monitoring programmes allow the collection and
integration of such data, both at the ecosystem and species level, for thematic accounting for biodiversity as described in the SEEA EA.
As part of the MAIA project, UNEP-WCMC has coordinated a ‘National Monitoring Data & Accounting for Biodiversity’ report. This provides a
synthesis of the Accounting for Biodiversity work being undertaken in MAIA countries and provides a rich overview of a range of practical
approaches for implementing biodiversity accounting across the European Union. The report is being currently updated to capture further
progress by MAIA countries. A preliminary version of the report can be accessed in the internal environment for consortium members of the
MAIA web portal.
Objectives
The report aims to answer two main research questions:
1. How can existing national biodiversity monitoring processes be adapted for informing Biodiversity and Ecosystem Condition Accounting?
2. What specific biodiversity data items could be included in SEEA EA accounts for better guiding decisions on biodiversity?
Contributors
Radoslav Stanchev (Bulgaria EEA), Peter Kullberg (SYKE), Jussila Tytti (SYKE), Adrien Comte
(University of Brest), Panayotis Dimopoulos (UPTRAS), Ioannis Kokkoris (UPTRAS), Burkhard
Schweppe-Kraft (BfN), Beyhan Ekinci (BfN), David Barton (NINA), Signe Nybø (NINA), Anders Kolstad
(NINA), Olav Skarpaas (University of Oslo), Pablo Campos (CSIC), Alejandro Caparros (CSIC).
Methods
• Interviews & email exchanges with MAIA country partners
• Literature review – Secondary research
• Follow up meetings with project partners
• Direct inputs to the draft from contributors
MAIA Countries Covered
• Bulgaria
• Finland
• France
• Germany
• Greece
• The Netherlands
• Norway
• Spain and Andalusia
Authors
Steven King (UNEP-WCMC),
Hashim Zaman (UNEP-WCMC),
Claire Brown (UNEP-WCMC),
Elise Belle (WCMC Europe)
Q1: Using National Biodiversity Monitoring for
Ecosystem Accounting
• Ecosystem established processes for organizing monitoring data
for reporting on the EU Nature Directives and National
Biodiversity Indexes can support ecosystem accounting.
• National IUCN Red List type assessments can be used to
compile thematic ‘Species Accounts’.
• Species abundance and richness accounts developed from
national biodiversity monitoring data can inform ecosystem
condition and cultural services accounts.
• Where spatial referencing for national biodiversity data is limited,
information on species can be assigned to different broad
ecosystem types based on habitat preferences.
• Structured frameworks such as Elite Index (Finland) and IBECA
index (Norway) can be adapted to inform SEEA EA Ecosystem
Condition Typology.
• Defining reference conditions for compiling ecosystem condition
accounts is very challenging.
Q2: Biodiversity data items for better decision-
making
• Integrating red list assessment data can help inform a more
integrated planning for achieving conservation objectives.
• Compositional state indicators need to be included in Ecosystem
Condition Accounts as other condition characteristics do not
adequately reflect trends in species assemblages.
• Extended analyses by France and Germany allow for a
“Biodiversity Debt”, Underinvestment, and Budgetary
investments to be determined.
• Integration of thematic ‘Protected Area Accounts’ into SEEA EA
can help decision-makers evaluating different land use and
sustainable development options.
• Biodiversity trends presented in ecosystem accounts need
reference thresholds for decision-makers to realise what is in
good or poor condition.
• Science-based policy targets provide reference levels to track
progress towards national biodiversity objectives.
MAIA-supported ecosystem
accounting in European
countries
Introduction
The overall objective of MAIAWP3 is to ensure mainstreaming of NCA(based on the SEEA-EAguidelines) and
alignment with identified policy needs (from MAIAWP2) within the 10 countries that are participating in MAIA, on the
basis of existing and newly initiated pilot account projects in each participating country. The basic rationale behind
WP3 is that testing and mainstreaming NCA approaches are most effectively done on the basis of concrete
accounts, where available methods (principally, but not limited to the SEEA-EAguidelines and the central
framework) are tested, applied and evaluated jointly by a range of relevant partners.
Overview accounting efforts in MAIA MS
• The tables on the right provides a summary of the NCAprogress per country
(focused on ecosystem core accounts) including an overview on
contributions (support and coordination) of MAIA.
• The table demonstrates that the WP3 activities of supporting and
mainstreaming NCA activities based on the assessment of the state-of-the- art
in the participating countries (MAIADeliverables D3.1. and D3.2) was useful in
order to create tailor-made solutions for each country and the
involved stakeholders.
• In the upcoming Deliverable (D3.3), the MAIA-supported NCAefforts on the
ecosystem core accounts are highlighted and for each MAIA-supported
ecosystem core account a detailed report including technical as well as
content related aspects is provided.
Challenges and future possibilities
Lack of
Authors and affiliations
Lead: Sabine Lange and Benjamin Burkhard (Leibniz University
Hannover); Fernando Santos-Martín andAdrián García-Bruzón (King
Juan Carlos University)
Contributing: Wageningen University, University Campus Rio Patras,
National Institute of Geophysics, Geodesy and Geography - Bulgarian
Academy of Sciences, Finnish Environment Institute, VITO, National
Statistical Institute of Bulgaria, EV INBO Research Institute Nature &
Forest, Norwegian Institute for Nature Research,Agencia Estatal
Consejo Superior de Investigaciones Científicas, Global Change
Research Institute CAS - The CzechAcademy of Sciences, Statistics
Netherlands, WCMC LBG, Paris Institute of Technology for Life, Food
& Environmental Sciences, Statistics Norway, SarVision, Executive
EnvironmentalAgency - Bulgarian Ministry of Environment & Waters
Core accounts
MAIA countries Status of the account Extent account Condition
account
Biophysical
ecosystem
services account
Monetary
ecosystem
services account
Ecosystem asset
account
Belgium Finished
On-going /planned
Bulgaria Finished
On-going /planned
Czech Republic Finished
On-going /planned
Finland Finished
On-going /planned
France Finished
On-going /planned
Germany Finished
On-going /planned
Greece Finished
On-going /planned * *
Netherlands Finished
On-going /planned
Norway Finished
On-going /planned
Spain Finished
On-going /planned
*Spatial scale uncertain
LEGEND: MAIA contribution & largest spatial scale achieved
MAIA-supported Account – sub-national scale
MAIA-supported Account - national scale
MAIA-independent Account -national scale MAIA-independent Account – sub-national scale
• Expert networks & enhanced
knowledge sharing
• More collaboration between
stakeholders
•Automated workflows
• Guide of applications and
dealing with uncertainties
•Political or policy support
•Financial resources or personal
Need for
• More/ stronger policy support
(official policy enforcement)
•Sustainable funding sources
• More training & capacity building
on the science-policy-practice
interface
• Increased level of awareness &
communication of results
•Knowledge & technical skills
•Data/ data access
Exemplary MAIA-supported ecosystem forest condition accounting in Spain
Set of indicators
Ecosystems
Reference areas
Good condition
Bad condition
Step 1: Selection
ecosystem types
Step 2: Selection
condition indicators
Step 3: Selection
reference areas Step 4: Aggregation
in a condition index
Step 5: Reporting
in accounting tables
50%
40%
30%
20%
10%
0%
40.000
20.000
0
80.000
60.000
Bad Regular Good High
Square
kilometers
Experimenting biophysical marine
accounts and economic accounts
based on maintenance cost in France
Introduction
Focus on marine ecosystems in the French Exclusive
Economic Zone (EEZ)
Benthic (seafloor) and pelagic (water column) ecosystems
Specific difficulties linked to the marine environment:
Context of poor datasets on habitats and species over
space and time
3Dimensions environment
Objectives
• Align the SEEA EA with the needs of ecosystem management and the principles of strong
sustainability
• Extent account + ecosystem condition account of marine ecosystems
• Produce condition account divided in three categories linked to management objectives (1)
Function: the maintenance of ecosystem overall functionality (2) Heritage: The
conservation of specific features or elements (3) Capacity: The capacity of ecosystems to
sustainably provide goods and services
• Define target conditions of good ecological status based on Marine Strategy Framework
Directive
• Assess Unpaid ecological cost from gap between observed costs and required costs for
the maintenance and restoration of natural capital. Net of incurred cost they allow to derive
a measure of unpaid ecological costs (Vanoli, 1995, 2015)
Analysis
Building ecosystem accounts allows helps to (1) assist in the
identification of data gap (2) harmonize and integrate existing
ecosystem monitoring processes (3) foster the development of
more integrated policies (4) relate state of ecosystems to economic
agents, but no spatial-explicit data on this link
Further work include (1) develop public architecture of spatial
datasets (2) institutional capacity to scale-up the project (3) limited
availability of spatial datasets for the marine environment and
temporal trends, (4) clearly define reference conditions
Authors
Adrien Comte1,2,3, Solène Legrand1, Félix Garnier1, Yann Kervinio1,
Clément Surun1, Pierre Scemama2, Rémi Mongruel2, Frédéric Quemmerais-
Amice4, Harold Levrel1
Affiliations
1CIRED, AgroParisTech, CIRAD, CNRS, EHESS, Ecole des Ponts
ParisTech, Université de Paris-Saclay, Campus du Jardin Tropical, Nogent-
sur-Marne, France 2Université de Brest, Ifremer, CNRS, UMR6308 AMURE,
IUEM, Plouzané, France 3 EcoAct, Paris, France 4 Office Français de la
Biodiversité, Brest, France
Methods
• Ecosystem accounting area : French EEZ, divided into four marine sub-
regions
• Ecosystem types : EUNIS classification (Figure 3)
• Unpaid ecological costs computed four steps (1) the correlation between
observed costs evolution and ecosystem condition trends (2) Application of
a dose-response model allowing the estimation of the change in ecological
state (3) estimation the cost required to reach reference level from current
condition (4) difference between required costs and observed cost to
calculate unpaid ecological cost
• Data sources : French biodiversity office (OFB), Ifremer, SIMM,
Quemmerais-Amice et al., (2020), CarpeDiem, INPN, MSFD reports
Results
• Extent: No-trend datasets available, composite map
• Contains multiple indicators that are all spatially explicit, but
with various timeframes available (Table 1)
• Target conditions, described for 2/9 indicators : eutrophication
(Figure 4) and fish stocks (Figure 5)
• Unpaid Ecological cost computed for several ecological
descriptors as yearly required costs to reach reference levels
of good ecological status (Table 2), broader than condition
indicators described above
Areas reaching good ecological status for Eutrophication (left) & number of fish stocks (right)
Unpaid Ecological Cost Descriptors ECNS CS BoB WM France
Heritage Biodiversity (D1 – OFB) 19,911,500€ 19,911,500€ 19,911,500€ 19,911,500€ 79,646,000€
Heritage Biodiversity (D1 –
DOCOBs)
2,834,750€ - 3,825,000€ 2,834,750€ - 3,825,000€ 2,834,750€ - 3,825,000€ 2,834,750€ - 3,825,000€ 11,339,000€ -
15,300,000€
Capacity Fishing (D3) – MSFD 28,287,000€ -
100,832,000€
26,144,000€- 94,145,000 81,054,000€ -
408,958,000€
58,724,000€ - 99,683,000€ 194,207,000€ -
703,618,000€
Capacity Fishing (D1 + D3 + D6 –
outing of trawlers)
91,534,000€ 35,164,000 € 144,486,000€ 16,008,000€ 287,192,000€
Function Eutrophication (D5 –
MSFD)
3,049,000€ - 8,209,000€ 29,074,000€ -
44,207,000€
2,164,000€ - 16,874,000€ 213,000€ - 10,320,000€ 34,500,000€ -
79,583,000€
Function Micropolluants (D8 –
MSFD)
153,651,000€ -
228,849,000€
36,256,000€ -
40,166,000€
21,553,000€ - 63,131,000€ 80,178,000€ -
118,476,000€
291,908,000€ -
450,622,000
Function Health (D9 – MSFD) 6,394,000€ -
583,867,000€
9,476,000€ -
641,179,000€
7,428,000€ - 300,804,000€ 25,981,000€ -
349,558,000€
49,279,000€ -
1,875,408,000€
Freshwater accounts at
river basin scale in
Peloponnese, Greece
Introduction
According to the EU’s Water Framework Directive (WFD) reporting obligations, Greece has completed two River Basin Management Plans
(RBMP) updates. These reports provide a wealth of spatial and temporal datasets for water resources. The System of Environmental-
Economic Accounts for Water (SEEA-Water) enables the connection between water ecosystems and the economy and utilise such water-
relevant datasets. In this work, the SEEA-EEA framework applies on freshwater resources, surface and groundwater, in terms of (a) extent
accounts, (b) condition accounts, (c) supply and use of provisioning ecosystem services, focusing on drinking and irrigation water supply and
use accounts for selected years from 2010 to 2021 depending on the availability of complete and reliable data. The case study for applying
the water ecosystem accounts is the Alfeios river basin in Western Peloponnese, Greece.
Objectives
• Implementation of SEEA-EEA framework for
freshwater ecosystems, including rivers, lakes
and groundwaters at river basin scale
• Extent accounts
• Condition accounts
• Drinking water supply and use accounts
• Irrigation water supply and use accounts
Analysis
Surface and groundwater bodies do not show any significant change as concerns extent.
A barely noticeable overall negative trend is observed in the river ecological condition
and no change to groundwater condition. In the Alfeios River basin, the use value for
drinking water in 2021 is approximately six million Euros, and the use value for irrigation
water in 2018 is close to 29 million. The results are experimental (tentative), considering
the number of necessary assumptions and the absence of detailed information.
Conclusion
The officially registered national and European datasets can serve as good initial basis
for mapping and compiling water ecosystem accounting at national and local scale in
Greece. The future WFD reporting cycles of the river basin management plans could be
structured in a way to enable a better and a more direct connection of the provided
dataset to ecosystem accounts.
Authors
Eleni S. Bekri 1,2
Ioannis P. Kokkoris 2
Maria K. Stefanidou1,2
Dimitrios Skuras 3
Panayotis Dimopoulos 2
Affiliations
1. Department of Civil Engineering, Environmental Engineering Laboratory, University
of Patras, Rion, Greece
2. Department of Biology, Laboratory of Botany, University of Patras, Rion, Greece
3. Department of Economics, Laboratory of Industrial, Innovation and Regional
Economics, University of Patras, Rion, Greece
Methods
• We follow the methodological framework proposed in SEEA-EEA.
• For the water accounts expressed in spatial units, we use the EEA
reference grid for Greece with cell size 1×1 km2.
• The spatial analysis is undertaken in ArcMap 10,8.
• Datasets from the two reporting WFD cycles, Corine LU/LC, Population
census, Eurostat Water database, IACS geodatabase, JRC Global
Surface Water, FADN standard output, Hellenic Statistical Authority.
Results
• Extent accounts at MAES level 3, identifying rivers, lakes and groundwater bodies from 1990 to
2018 and changes in lakes seasonality between 1984 and 2020.
• Condition accounts based on the freshwater condition, i.e (i) ecological condition reported for
river and lake water bodies & (ii) chemical, quantitative & total condition for groundwater bodies,
with opening period (2009-2015) and closing period (2016-2021).
• Drinking water supply and use maps in biophysical and monetary terms, as well as summary
accounting tables at river basin level, from 1991 to 2021. Valuation based on average financial
cost per m3 of supplied water since there is no competitive market.
• Annual irrigation water supply and use maps in biophysical and monetary terms, as well as
summary accounting tables at river basin level from 2015 to 2018. The residual valuation method
utilised the agricultural area from IACS, the standard output per cultivation from FADN and
regional agricultural accounts coefficients.
Case study area: Alfeios river basin
Greece
Annual irrigation water use (in m3) in 2018
Annual drinking water supply(in m3) in 2021
Summer drinking water supply (in m3) in 2021
Peloponnese
Water balance modelling for
monitoring groundwater storage
and valuing groundwater recharge,
a case-study for Flanders
Introduction
Especially during dry periods there is a high demand for data that gives insight in the status of the phreatic groundwater
system.
Current indicators are primarily based on scattered groundwater head observations and provide only limited insight in the
regional availability of groundwater. Although groundwater head observations are crucial for groundwater management,
individual head observations are often difficult to interpret.
Methods: Straightforward water balance calculation on catchment scale
To provide additional information about the groundwater storage dynamics we propose a water balance approach based on:
•catchment scale groundwater recharge simulations using the WetSpass-M model (Abdollahi et al. 2015),
•river discharge measurements at the outlet,
•groundwater abstraction data.
Additionally, a groundwater flow model could be used to allow validation of the simulations based on observed groundwater heads.
Analysis and conclusion
This study shows that the proposed groundwater balance
simulations could provide relevant insights in both the dynamics of
the groundwater system. The temporary results however indicate
that more information is required on local parameters (e.g. effect of
soil sealing and local drainage systems..) to correctly simulate the
groundwater recharge.
The spatially distributed groundwater recharge simulations also
allow to evaluate the impact of the land-use on the groundwater
recharge and as such also the relative contribution of the land-cover
to water storage in the sub-surface.
Authors
Dams J.1, De Nocker L. 1, Beckx C. 1, De Smet L. 2, Bronders J. 1
and Broekx S. 1
Affiliations
1Environmental Modelling Unit, Flemish Institute for Technological
Research (VITO), Boeretang 200, 2400 Mol, Belgium
2Nature and Society, Research Institute for Nature and Forest
(INBO), Havenlaan 88 bus 73, B-1000 Brussels, Belgium
Results
• Monthly maps of actual
evapotranspiration, runoff and
groundwater recharge
• The relative importance of certain land-
use types for groundwater
• Insight in the dynamics of groundwater
stored in the phreatic aquifer in different
catchments in Flanders. . Fig. shows the
temporary output of the calculations for the
Demer sub-catchment.
Groundwate
r Recharge
[mm/month]
Average runoff (blue), evapotranspiration (red) and
groundwater recharge (green) per land-use type
Groundwater recharge for Flanders simulated for January 2016
Monthly water balance for the phreatic groundwater
system of the Demer catchment. The bar plots show
the different components of the water balance. The
monthly dynamics in groundwater storage is shown
by the filled line. A positive change in groundwater
storage represents a net replenishment of the
groundwater storage while a negative value
represents a depletion of the groundwater storage.
Health benefits of urban green space,
Assessment and Valuation,
a case study in Flanders, Belgium
Introduction
Growing scientific evidence that exposure to (urban) green areas results into health benefits for physical and mental morbidity and mortality.
Different mechanisms explain these impacts (stress release, exercise,…).Although the health benefits of greenareas are widely
recognized, there are barely methods and tools available to assess these benefits in the context of natural capital accounting. Quantification
is challenging due to the wide variation in methods (indicators to define green areas and exposure to), scope (green areas, health
outcomes) and contexts. In addition, assessment of health benefits requires region specific health data for a wide range of health outcomes.
Economic valuation requires to account for a wide range of region specific data (costs of illness, labour productivity,…) and integration of
different methods (market data, valuation studies for longer life expectancy,…)
Objectives and scope
• Quantification and valuation of Health Benefits of Exposure to Greenspace
in Flanders
• Greenspace (% green area 1-3 km around place of residence),
green” areas = all green land use, including parks, forests, agriculture,
gardens (private and public), small informal green areas, surface waters.
• Exposure to = contact with = recreation + sport + view on green + …
• Health = avoided physical and mental illness and + longer life expectancy
• Benefits= avoided health care costs (e.g. hospitalization) + productivity
gains (less absenteeism) + welfare gains (life expectancy, suffering)
Add your
image here
Analysis and conclusion
Strengths
Methods in line with health impact assessments and economic valuation.
Results shows importance of urban and rural green areas for public health, and the
related economic impacts, esp. for health care and economy.
This is an important ecosystem service (average 3400 euro/ ha.year for Flanders).
Unknown overlap with ecosystem services for recreation, tourism and real estate values.
Results used to promote (urban) green infrastructure and preventive health care policy.
Limitations
Indicators to define exposure and green areas are too rough / uncertain for planning or
management at local level or assessment of impacts of short term trends or policies.
Authors
Leo De Nocker, Inge Liekens , Steven Broekx
Affiliations
Environmental Modelling Unit, Flemish Institute for Technological
Research (VITO), Boeretang200, 2400 Mol, Belgium
Contact: leo.denocker@vito.be
Methods and results
Exposure to green space
Share of greenspace in total land use
(1 km around place of residence)
Green Space: Vito land use map
10m x10 m ; 22 landuse categories
Example: city of Antwerp
Benefits: avoided health impacts
85.000 DALY’s (disability adjusted life years )
= 27% of burden of disease for these diseases
Economic valuation health benefits
Benefitsamount to:
3 billion euro.year for Flanders 2016
= 1,3 % of GDP Flanders
= 464 euro/inhabitant.year
Avoided health costs (36%) and Absenteeism
(52%) are most important benefit categories
1
2
3 Health impacts
Selected Doseeffect relationships
4
Median: 73% (m), 10% has less than 48%
MAIA Viewer
The MAIAviewer provides online analysis and reporting of EcosystemAccounts.
Data providers
CBS - Statistics Netherlands
Wageningen University (Netherlands)
NINA(Norway)
CSIC (Spain)
AgroParisTech (France)
National Institute of Geophysics, Geodesy and Geography, Bulgarian
Academy of Sciences (Bulgaria)
EcosystemAccounts can be analyzed and viewed.
Histograms, change matrices and extent accounts can be
produced in seconds for predefined areas, like provinces or
communities or for custom polygons.
Authors
Rob Luiken (SarVision)
Lars Hein (WUR)
Eco system types 2000 and 2018 compared to each other in Bulgaria Extent breakdown matrix for land cover 2015-2019 in the community of Oslo
(Norway)
Histogram chart for eco system types in the province of Gelderland (Netherlands) Account table for floriculture productivity 2015-2018 in the community of Lisse
(Netherlands)

More Related Content

What's hot

CROP MONITORING HILLARY
CROP MONITORING HILLARYCROP MONITORING HILLARY
CROP MONITORING HILLARYHillary Mugiyo
 
Assessing stress by using remote sensing
Assessing stress by using remote sensingAssessing stress by using remote sensing
Assessing stress by using remote sensingChongtham Allaylay Devi
 
Remote sensing application in agriculture & forestry_Dr Menon A R R (The Kera...
Remote sensing application in agriculture & forestry_Dr Menon A R R (The Kera...Remote sensing application in agriculture & forestry_Dr Menon A R R (The Kera...
Remote sensing application in agriculture & forestry_Dr Menon A R R (The Kera...India Water Portal
 
Gis application on forest management
Gis application on forest managementGis application on forest management
Gis application on forest managementprahladpatel6
 
Remote Sensing and GIS in Land Use / Land Cover Mapping
Remote Sensing and GIS in Land Use / Land Cover MappingRemote Sensing and GIS in Land Use / Land Cover Mapping
Remote Sensing and GIS in Land Use / Land Cover MappingVenkatKamal1
 
WETLAND MAPPING USING RS AND GIS
WETLAND MAPPING USING RS AND GISWETLAND MAPPING USING RS AND GIS
WETLAND MAPPING USING RS AND GISAbhiram Kanigolla
 
Predicting and mapping soil properties using proximal/remote sensing by Zhou ...
Predicting and mapping soil properties using proximal/remote sensing by Zhou ...Predicting and mapping soil properties using proximal/remote sensing by Zhou ...
Predicting and mapping soil properties using proximal/remote sensing by Zhou ...FAO
 
Remote Sensing and GIS Techniques
Remote Sensing and GIS TechniquesRemote Sensing and GIS Techniques
Remote Sensing and GIS TechniquesRisikesh Thakur
 
Remote Sensing And GIS Application In Wetland Mapping
Remote Sensing And GIS Application In Wetland MappingRemote Sensing And GIS Application In Wetland Mapping
Remote Sensing And GIS Application In Wetland MappingSwetha A
 
ASSESSMENT OF SOIL SALINITY USING REMOTE SENSING
ASSESSMENT OF SOIL SALINITY USING REMOTE SENSINGASSESSMENT OF SOIL SALINITY USING REMOTE SENSING
ASSESSMENT OF SOIL SALINITY USING REMOTE SENSINGAbhiram Kanigolla
 
Soil mapping , remote sensing and use of sensors in precision farming
Soil mapping , remote sensing and use of  sensors in precision farmingSoil mapping , remote sensing and use of  sensors in precision farming
Soil mapping , remote sensing and use of sensors in precision farmingDr. M. Kumaresan Hort.
 
UAS based soil moisture monitoring
UAS based soil moisture monitoringUAS based soil moisture monitoring
UAS based soil moisture monitoringSalvatore Manfreda
 
GIS and Remote Sensing in Diagnosis and Management of Problem Soil with audio...
GIS and Remote Sensing in Diagnosis and Management of Problem Soil with audio...GIS and Remote Sensing in Diagnosis and Management of Problem Soil with audio...
GIS and Remote Sensing in Diagnosis and Management of Problem Soil with audio...KaminiKumari13
 
Remote Sensing and its Application
Remote Sensing and its ApplicationRemote Sensing and its Application
Remote Sensing and its ApplicationRashmi Yadav
 
Remote sensing application in monitoring and management of soil, water and ai...
Remote sensing application in monitoring and management of soil, water and ai...Remote sensing application in monitoring and management of soil, water and ai...
Remote sensing application in monitoring and management of soil, water and ai...Jayvir Solanki
 
Crop discrimination and yield monitoring
Crop discrimination and yield monitoringCrop discrimination and yield monitoring
Crop discrimination and yield monitoringLokesh Kumar Jain
 
Use of remote sensing for land cover monitoring servir science applications
Use of remote sensing for land cover monitoring servir science applicationsUse of remote sensing for land cover monitoring servir science applications
Use of remote sensing for land cover monitoring servir science applicationsKabir Uddin
 
Application of remote sensing
Application of remote sensingApplication of remote sensing
Application of remote sensingsiddhant_2055
 

What's hot (20)

CROP MONITORING HILLARY
CROP MONITORING HILLARYCROP MONITORING HILLARY
CROP MONITORING HILLARY
 
Assessing stress by using remote sensing
Assessing stress by using remote sensingAssessing stress by using remote sensing
Assessing stress by using remote sensing
 
Remote sensing application in agriculture & forestry_Dr Menon A R R (The Kera...
Remote sensing application in agriculture & forestry_Dr Menon A R R (The Kera...Remote sensing application in agriculture & forestry_Dr Menon A R R (The Kera...
Remote sensing application in agriculture & forestry_Dr Menon A R R (The Kera...
 
Gis application on forest management
Gis application on forest managementGis application on forest management
Gis application on forest management
 
Remote Sensing and GIS in Land Use / Land Cover Mapping
Remote Sensing and GIS in Land Use / Land Cover MappingRemote Sensing and GIS in Land Use / Land Cover Mapping
Remote Sensing and GIS in Land Use / Land Cover Mapping
 
WETLAND MAPPING USING RS AND GIS
WETLAND MAPPING USING RS AND GISWETLAND MAPPING USING RS AND GIS
WETLAND MAPPING USING RS AND GIS
 
Wetland mapping
Wetland mappingWetland mapping
Wetland mapping
 
Predicting and mapping soil properties using proximal/remote sensing by Zhou ...
Predicting and mapping soil properties using proximal/remote sensing by Zhou ...Predicting and mapping soil properties using proximal/remote sensing by Zhou ...
Predicting and mapping soil properties using proximal/remote sensing by Zhou ...
 
Remote Sensing and GIS Techniques
Remote Sensing and GIS TechniquesRemote Sensing and GIS Techniques
Remote Sensing and GIS Techniques
 
Remote Sensing And GIS Application In Wetland Mapping
Remote Sensing And GIS Application In Wetland MappingRemote Sensing And GIS Application In Wetland Mapping
Remote Sensing And GIS Application In Wetland Mapping
 
ASSESSMENT OF SOIL SALINITY USING REMOTE SENSING
ASSESSMENT OF SOIL SALINITY USING REMOTE SENSINGASSESSMENT OF SOIL SALINITY USING REMOTE SENSING
ASSESSMENT OF SOIL SALINITY USING REMOTE SENSING
 
Soil mapping , remote sensing and use of sensors in precision farming
Soil mapping , remote sensing and use of  sensors in precision farmingSoil mapping , remote sensing and use of  sensors in precision farming
Soil mapping , remote sensing and use of sensors in precision farming
 
UAS based soil moisture monitoring
UAS based soil moisture monitoringUAS based soil moisture monitoring
UAS based soil moisture monitoring
 
GIS and Remote Sensing in Diagnosis and Management of Problem Soil with audio...
GIS and Remote Sensing in Diagnosis and Management of Problem Soil with audio...GIS and Remote Sensing in Diagnosis and Management of Problem Soil with audio...
GIS and Remote Sensing in Diagnosis and Management of Problem Soil with audio...
 
Remote Sensing and its Application
Remote Sensing and its ApplicationRemote Sensing and its Application
Remote Sensing and its Application
 
Remote sensing application in monitoring and management of soil, water and ai...
Remote sensing application in monitoring and management of soil, water and ai...Remote sensing application in monitoring and management of soil, water and ai...
Remote sensing application in monitoring and management of soil, water and ai...
 
Crop discrimination and yield monitoring
Crop discrimination and yield monitoringCrop discrimination and yield monitoring
Crop discrimination and yield monitoring
 
Use of remote sensing for land cover monitoring servir science applications
Use of remote sensing for land cover monitoring servir science applicationsUse of remote sensing for land cover monitoring servir science applications
Use of remote sensing for land cover monitoring servir science applications
 
Application of remote sensing
Application of remote sensingApplication of remote sensing
Application of remote sensing
 
NDVI
NDVINDVI
NDVI
 

Similar to MAIA All Scientific Posters

Assessing ecosystem services over large areas
Assessing ecosystem services over large areasAssessing ecosystem services over large areas
Assessing ecosystem services over large areasAlessandro Gimona
 
ESTIMATION OF DEPTH OF RIVER BY BATHYMETRY OF SATELLITE IMAGES
ESTIMATION OF DEPTH OF RIVER BY BATHYMETRY OF SATELLITE IMAGESESTIMATION OF DEPTH OF RIVER BY BATHYMETRY OF SATELLITE IMAGES
ESTIMATION OF DEPTH OF RIVER BY BATHYMETRY OF SATELLITE IMAGESIRJET Journal
 
''Copernicus for sustainable land management'' by Markus Erhard, European Env...
''Copernicus for sustainable land management'' by Markus Erhard, European Env...''Copernicus for sustainable land management'' by Markus Erhard, European Env...
''Copernicus for sustainable land management'' by Markus Erhard, European Env...The European GNSS Agency (GSA)
 
High_resolution_GEC
High_resolution_GECHigh_resolution_GEC
High_resolution_GECKenneth Kay
 
Land Consumption, Ecosystem Services and Urban Planning Policies: Preliminary...
Land Consumption, Ecosystem Services and Urban Planning Policies: Preliminary...Land Consumption, Ecosystem Services and Urban Planning Policies: Preliminary...
Land Consumption, Ecosystem Services and Urban Planning Policies: Preliminary...IEREK Press
 
IRJET- Use of Landsat ETM+ Data for Delineation of Vegetation Cover Area in A...
IRJET- Use of Landsat ETM+ Data for Delineation of Vegetation Cover Area in A...IRJET- Use of Landsat ETM+ Data for Delineation of Vegetation Cover Area in A...
IRJET- Use of Landsat ETM+ Data for Delineation of Vegetation Cover Area in A...IRJET Journal
 
Hydrological mapping of the vegetation using remote sensing products
Hydrological mapping of the vegetation using remote sensing productsHydrological mapping of the vegetation using remote sensing products
Hydrological mapping of the vegetation using remote sensing productsNycoSat
 
IRJET - Prediction of Ground Water Level based on Machine Learning
IRJET - Prediction of Ground Water Level based on Machine LearningIRJET - Prediction of Ground Water Level based on Machine Learning
IRJET - Prediction of Ground Water Level based on Machine LearningIRJET Journal
 
Techniacl seminar from Government Engineering College.pptx
Techniacl seminar from Government Engineering College.pptxTechniacl seminar from Government Engineering College.pptx
Techniacl seminar from Government Engineering College.pptxArjunPLinekaje
 
IRJET- Landuse, Landcover and Urban Development of Coimbatore North Zone for ...
IRJET- Landuse, Landcover and Urban Development of Coimbatore North Zone for ...IRJET- Landuse, Landcover and Urban Development of Coimbatore North Zone for ...
IRJET- Landuse, Landcover and Urban Development of Coimbatore North Zone for ...IRJET Journal
 
Landscapes and floods
Landscapes and floodsLandscapes and floods
Landscapes and floodsDeclan Hearne
 
MODULE VII_ Remote Sensing_Avantika.pptx
MODULE VII_ Remote Sensing_Avantika.pptxMODULE VII_ Remote Sensing_Avantika.pptx
MODULE VII_ Remote Sensing_Avantika.pptxavantikaadhruj1
 
Alexander vega 2019_iop_conf._ser.__mater._sci._eng._603_022010
Alexander vega 2019_iop_conf._ser.__mater._sci._eng._603_022010Alexander vega 2019_iop_conf._ser.__mater._sci._eng._603_022010
Alexander vega 2019_iop_conf._ser.__mater._sci._eng._603_022010jalexvega
 
Defining, Measuring, and Incentivizing Sustainable Land Use
Defining, Measuring, and Incentivizing Sustainable Land Use Defining, Measuring, and Incentivizing Sustainable Land Use
Defining, Measuring, and Incentivizing Sustainable Land Use Kim Nicholas
 
Davis, Kenneth: Applications of eddy covariance flux measurements in quantify...
Davis, Kenneth: Applications of eddy covariance flux measurements in quantify...Davis, Kenneth: Applications of eddy covariance flux measurements in quantify...
Davis, Kenneth: Applications of eddy covariance flux measurements in quantify...Integrated Carbon Observation System (ICOS)
 

Similar to MAIA All Scientific Posters (20)

test.pptx
test.pptxtest.pptx
test.pptx
 
Assessing ecosystem services over large areas
Assessing ecosystem services over large areasAssessing ecosystem services over large areas
Assessing ecosystem services over large areas
 
ESTIMATION OF DEPTH OF RIVER BY BATHYMETRY OF SATELLITE IMAGES
ESTIMATION OF DEPTH OF RIVER BY BATHYMETRY OF SATELLITE IMAGESESTIMATION OF DEPTH OF RIVER BY BATHYMETRY OF SATELLITE IMAGES
ESTIMATION OF DEPTH OF RIVER BY BATHYMETRY OF SATELLITE IMAGES
 
11. Presentación corta: servicios ecosistémicos y cambio climático
11. Presentación corta: servicios ecosistémicos y cambio climático11. Presentación corta: servicios ecosistémicos y cambio climático
11. Presentación corta: servicios ecosistémicos y cambio climático
 
''Copernicus for sustainable land management'' by Markus Erhard, European Env...
''Copernicus for sustainable land management'' by Markus Erhard, European Env...''Copernicus for sustainable land management'' by Markus Erhard, European Env...
''Copernicus for sustainable land management'' by Markus Erhard, European Env...
 
Application of rs and gis
Application of rs and gisApplication of rs and gis
Application of rs and gis
 
High_resolution_GEC
High_resolution_GECHigh_resolution_GEC
High_resolution_GEC
 
Land Consumption, Ecosystem Services and Urban Planning Policies: Preliminary...
Land Consumption, Ecosystem Services and Urban Planning Policies: Preliminary...Land Consumption, Ecosystem Services and Urban Planning Policies: Preliminary...
Land Consumption, Ecosystem Services and Urban Planning Policies: Preliminary...
 
IRJET- Use of Landsat ETM+ Data for Delineation of Vegetation Cover Area in A...
IRJET- Use of Landsat ETM+ Data for Delineation of Vegetation Cover Area in A...IRJET- Use of Landsat ETM+ Data for Delineation of Vegetation Cover Area in A...
IRJET- Use of Landsat ETM+ Data for Delineation of Vegetation Cover Area in A...
 
Applicability Study on the Optical Remote Sensing Techniques in a River
Applicability Study on the Optical Remote Sensing Techniques in a RiverApplicability Study on the Optical Remote Sensing Techniques in a River
Applicability Study on the Optical Remote Sensing Techniques in a River
 
Hydrological mapping of the vegetation using remote sensing products
Hydrological mapping of the vegetation using remote sensing productsHydrological mapping of the vegetation using remote sensing products
Hydrological mapping of the vegetation using remote sensing products
 
IRJET - Prediction of Ground Water Level based on Machine Learning
IRJET - Prediction of Ground Water Level based on Machine LearningIRJET - Prediction of Ground Water Level based on Machine Learning
IRJET - Prediction of Ground Water Level based on Machine Learning
 
Techniacl seminar from Government Engineering College.pptx
Techniacl seminar from Government Engineering College.pptxTechniacl seminar from Government Engineering College.pptx
Techniacl seminar from Government Engineering College.pptx
 
IRJET- Landuse, Landcover and Urban Development of Coimbatore North Zone for ...
IRJET- Landuse, Landcover and Urban Development of Coimbatore North Zone for ...IRJET- Landuse, Landcover and Urban Development of Coimbatore North Zone for ...
IRJET- Landuse, Landcover and Urban Development of Coimbatore North Zone for ...
 
Landscapes and floods
Landscapes and floodsLandscapes and floods
Landscapes and floods
 
Using AI to Tackle Global Environmental Challenges
Using AI to Tackle Global Environmental ChallengesUsing AI to Tackle Global Environmental Challenges
Using AI to Tackle Global Environmental Challenges
 
MODULE VII_ Remote Sensing_Avantika.pptx
MODULE VII_ Remote Sensing_Avantika.pptxMODULE VII_ Remote Sensing_Avantika.pptx
MODULE VII_ Remote Sensing_Avantika.pptx
 
Alexander vega 2019_iop_conf._ser.__mater._sci._eng._603_022010
Alexander vega 2019_iop_conf._ser.__mater._sci._eng._603_022010Alexander vega 2019_iop_conf._ser.__mater._sci._eng._603_022010
Alexander vega 2019_iop_conf._ser.__mater._sci._eng._603_022010
 
Defining, Measuring, and Incentivizing Sustainable Land Use
Defining, Measuring, and Incentivizing Sustainable Land Use Defining, Measuring, and Incentivizing Sustainable Land Use
Defining, Measuring, and Incentivizing Sustainable Land Use
 
Davis, Kenneth: Applications of eddy covariance flux measurements in quantify...
Davis, Kenneth: Applications of eddy covariance flux measurements in quantify...Davis, Kenneth: Applications of eddy covariance flux measurements in quantify...
Davis, Kenneth: Applications of eddy covariance flux measurements in quantify...
 

Recently uploaded

Call Us ≽ 9953322196 ≼ Call Girls In Mukherjee Nagar(Delhi) |
Call Us ≽ 9953322196 ≼ Call Girls In Mukherjee Nagar(Delhi) |Call Us ≽ 9953322196 ≼ Call Girls In Mukherjee Nagar(Delhi) |
Call Us ≽ 9953322196 ≼ Call Girls In Mukherjee Nagar(Delhi) |aasikanpl
 
Analytical Profile of Coleus Forskohlii | Forskolin .pptx
Analytical Profile of Coleus Forskohlii | Forskolin .pptxAnalytical Profile of Coleus Forskohlii | Forskolin .pptx
Analytical Profile of Coleus Forskohlii | Forskolin .pptxSwapnil Therkar
 
Artificial Intelligence In Microbiology by Dr. Prince C P
Artificial Intelligence In Microbiology by Dr. Prince C PArtificial Intelligence In Microbiology by Dr. Prince C P
Artificial Intelligence In Microbiology by Dr. Prince C PPRINCE C P
 
zoogeography of pakistan.pptx fauna of Pakistan
zoogeography of pakistan.pptx fauna of Pakistanzoogeography of pakistan.pptx fauna of Pakistan
zoogeography of pakistan.pptx fauna of Pakistanzohaibmir069
 
Bentham & Hooker's Classification. along with the merits and demerits of the ...
Bentham & Hooker's Classification. along with the merits and demerits of the ...Bentham & Hooker's Classification. along with the merits and demerits of the ...
Bentham & Hooker's Classification. along with the merits and demerits of the ...Nistarini College, Purulia (W.B) India
 
Call Girls in Munirka Delhi 💯Call Us 🔝8264348440🔝
Call Girls in Munirka Delhi 💯Call Us 🔝8264348440🔝Call Girls in Munirka Delhi 💯Call Us 🔝8264348440🔝
Call Girls in Munirka Delhi 💯Call Us 🔝8264348440🔝soniya singh
 
Microphone- characteristics,carbon microphone, dynamic microphone.pptx
Microphone- characteristics,carbon microphone, dynamic microphone.pptxMicrophone- characteristics,carbon microphone, dynamic microphone.pptx
Microphone- characteristics,carbon microphone, dynamic microphone.pptxpriyankatabhane
 
Analytical Profile of Coleus Forskohlii | Forskolin .pdf
Analytical Profile of Coleus Forskohlii | Forskolin .pdfAnalytical Profile of Coleus Forskohlii | Forskolin .pdf
Analytical Profile of Coleus Forskohlii | Forskolin .pdfSwapnil Therkar
 
Temporomandibular joint Muscles of Mastication
Temporomandibular joint Muscles of MasticationTemporomandibular joint Muscles of Mastication
Temporomandibular joint Muscles of Masticationvidulajaib
 
RESPIRATORY ADAPTATIONS TO HYPOXIA IN HUMNAS.pptx
RESPIRATORY ADAPTATIONS TO HYPOXIA IN HUMNAS.pptxRESPIRATORY ADAPTATIONS TO HYPOXIA IN HUMNAS.pptx
RESPIRATORY ADAPTATIONS TO HYPOXIA IN HUMNAS.pptxFarihaAbdulRasheed
 
Call Girls in Mayapuri Delhi 💯Call Us 🔝9953322196🔝 💯Escort.
Call Girls in Mayapuri Delhi 💯Call Us 🔝9953322196🔝 💯Escort.Call Girls in Mayapuri Delhi 💯Call Us 🔝9953322196🔝 💯Escort.
Call Girls in Mayapuri Delhi 💯Call Us 🔝9953322196🔝 💯Escort.aasikanpl
 
Scheme-of-Work-Science-Stage-4 cambridge science.docx
Scheme-of-Work-Science-Stage-4 cambridge science.docxScheme-of-Work-Science-Stage-4 cambridge science.docx
Scheme-of-Work-Science-Stage-4 cambridge science.docxyaramohamed343013
 
Call Girls in Munirka Delhi 💯Call Us 🔝9953322196🔝 💯Escort.
Call Girls in Munirka Delhi 💯Call Us 🔝9953322196🔝 💯Escort.Call Girls in Munirka Delhi 💯Call Us 🔝9953322196🔝 💯Escort.
Call Girls in Munirka Delhi 💯Call Us 🔝9953322196🔝 💯Escort.aasikanpl
 
Best Call Girls In Sector 29 Gurgaon❤️8860477959 EscorTs Service In 24/7 Delh...
Best Call Girls In Sector 29 Gurgaon❤️8860477959 EscorTs Service In 24/7 Delh...Best Call Girls In Sector 29 Gurgaon❤️8860477959 EscorTs Service In 24/7 Delh...
Best Call Girls In Sector 29 Gurgaon❤️8860477959 EscorTs Service In 24/7 Delh...lizamodels9
 
SOLUBLE PATTERN RECOGNITION RECEPTORS.pptx
SOLUBLE PATTERN RECOGNITION RECEPTORS.pptxSOLUBLE PATTERN RECOGNITION RECEPTORS.pptx
SOLUBLE PATTERN RECOGNITION RECEPTORS.pptxkessiyaTpeter
 
Cytokinin, mechanism and its application.pptx
Cytokinin, mechanism and its application.pptxCytokinin, mechanism and its application.pptx
Cytokinin, mechanism and its application.pptxVarshiniMK
 
Evidences of Evolution General Biology 2
Evidences of Evolution General Biology 2Evidences of Evolution General Biology 2
Evidences of Evolution General Biology 2John Carlo Rollon
 
Spermiogenesis or Spermateleosis or metamorphosis of spermatid
Spermiogenesis or Spermateleosis or metamorphosis of spermatidSpermiogenesis or Spermateleosis or metamorphosis of spermatid
Spermiogenesis or Spermateleosis or metamorphosis of spermatidSarthak Sekhar Mondal
 
Call Us ≽ 9953322196 ≼ Call Girls In Lajpat Nagar (Delhi) |
Call Us ≽ 9953322196 ≼ Call Girls In Lajpat Nagar (Delhi) |Call Us ≽ 9953322196 ≼ Call Girls In Lajpat Nagar (Delhi) |
Call Us ≽ 9953322196 ≼ Call Girls In Lajpat Nagar (Delhi) |aasikanpl
 

Recently uploaded (20)

Hot Sexy call girls in Moti Nagar,🔝 9953056974 🔝 escort Service
Hot Sexy call girls in  Moti Nagar,🔝 9953056974 🔝 escort ServiceHot Sexy call girls in  Moti Nagar,🔝 9953056974 🔝 escort Service
Hot Sexy call girls in Moti Nagar,🔝 9953056974 🔝 escort Service
 
Call Us ≽ 9953322196 ≼ Call Girls In Mukherjee Nagar(Delhi) |
Call Us ≽ 9953322196 ≼ Call Girls In Mukherjee Nagar(Delhi) |Call Us ≽ 9953322196 ≼ Call Girls In Mukherjee Nagar(Delhi) |
Call Us ≽ 9953322196 ≼ Call Girls In Mukherjee Nagar(Delhi) |
 
Analytical Profile of Coleus Forskohlii | Forskolin .pptx
Analytical Profile of Coleus Forskohlii | Forskolin .pptxAnalytical Profile of Coleus Forskohlii | Forskolin .pptx
Analytical Profile of Coleus Forskohlii | Forskolin .pptx
 
Artificial Intelligence In Microbiology by Dr. Prince C P
Artificial Intelligence In Microbiology by Dr. Prince C PArtificial Intelligence In Microbiology by Dr. Prince C P
Artificial Intelligence In Microbiology by Dr. Prince C P
 
zoogeography of pakistan.pptx fauna of Pakistan
zoogeography of pakistan.pptx fauna of Pakistanzoogeography of pakistan.pptx fauna of Pakistan
zoogeography of pakistan.pptx fauna of Pakistan
 
Bentham & Hooker's Classification. along with the merits and demerits of the ...
Bentham & Hooker's Classification. along with the merits and demerits of the ...Bentham & Hooker's Classification. along with the merits and demerits of the ...
Bentham & Hooker's Classification. along with the merits and demerits of the ...
 
Call Girls in Munirka Delhi 💯Call Us 🔝8264348440🔝
Call Girls in Munirka Delhi 💯Call Us 🔝8264348440🔝Call Girls in Munirka Delhi 💯Call Us 🔝8264348440🔝
Call Girls in Munirka Delhi 💯Call Us 🔝8264348440🔝
 
Microphone- characteristics,carbon microphone, dynamic microphone.pptx
Microphone- characteristics,carbon microphone, dynamic microphone.pptxMicrophone- characteristics,carbon microphone, dynamic microphone.pptx
Microphone- characteristics,carbon microphone, dynamic microphone.pptx
 
Analytical Profile of Coleus Forskohlii | Forskolin .pdf
Analytical Profile of Coleus Forskohlii | Forskolin .pdfAnalytical Profile of Coleus Forskohlii | Forskolin .pdf
Analytical Profile of Coleus Forskohlii | Forskolin .pdf
 
Temporomandibular joint Muscles of Mastication
Temporomandibular joint Muscles of MasticationTemporomandibular joint Muscles of Mastication
Temporomandibular joint Muscles of Mastication
 
RESPIRATORY ADAPTATIONS TO HYPOXIA IN HUMNAS.pptx
RESPIRATORY ADAPTATIONS TO HYPOXIA IN HUMNAS.pptxRESPIRATORY ADAPTATIONS TO HYPOXIA IN HUMNAS.pptx
RESPIRATORY ADAPTATIONS TO HYPOXIA IN HUMNAS.pptx
 
Call Girls in Mayapuri Delhi 💯Call Us 🔝9953322196🔝 💯Escort.
Call Girls in Mayapuri Delhi 💯Call Us 🔝9953322196🔝 💯Escort.Call Girls in Mayapuri Delhi 💯Call Us 🔝9953322196🔝 💯Escort.
Call Girls in Mayapuri Delhi 💯Call Us 🔝9953322196🔝 💯Escort.
 
Scheme-of-Work-Science-Stage-4 cambridge science.docx
Scheme-of-Work-Science-Stage-4 cambridge science.docxScheme-of-Work-Science-Stage-4 cambridge science.docx
Scheme-of-Work-Science-Stage-4 cambridge science.docx
 
Call Girls in Munirka Delhi 💯Call Us 🔝9953322196🔝 💯Escort.
Call Girls in Munirka Delhi 💯Call Us 🔝9953322196🔝 💯Escort.Call Girls in Munirka Delhi 💯Call Us 🔝9953322196🔝 💯Escort.
Call Girls in Munirka Delhi 💯Call Us 🔝9953322196🔝 💯Escort.
 
Best Call Girls In Sector 29 Gurgaon❤️8860477959 EscorTs Service In 24/7 Delh...
Best Call Girls In Sector 29 Gurgaon❤️8860477959 EscorTs Service In 24/7 Delh...Best Call Girls In Sector 29 Gurgaon❤️8860477959 EscorTs Service In 24/7 Delh...
Best Call Girls In Sector 29 Gurgaon❤️8860477959 EscorTs Service In 24/7 Delh...
 
SOLUBLE PATTERN RECOGNITION RECEPTORS.pptx
SOLUBLE PATTERN RECOGNITION RECEPTORS.pptxSOLUBLE PATTERN RECOGNITION RECEPTORS.pptx
SOLUBLE PATTERN RECOGNITION RECEPTORS.pptx
 
Cytokinin, mechanism and its application.pptx
Cytokinin, mechanism and its application.pptxCytokinin, mechanism and its application.pptx
Cytokinin, mechanism and its application.pptx
 
Evidences of Evolution General Biology 2
Evidences of Evolution General Biology 2Evidences of Evolution General Biology 2
Evidences of Evolution General Biology 2
 
Spermiogenesis or Spermateleosis or metamorphosis of spermatid
Spermiogenesis or Spermateleosis or metamorphosis of spermatidSpermiogenesis or Spermateleosis or metamorphosis of spermatid
Spermiogenesis or Spermateleosis or metamorphosis of spermatid
 
Call Us ≽ 9953322196 ≼ Call Girls In Lajpat Nagar (Delhi) |
Call Us ≽ 9953322196 ≼ Call Girls In Lajpat Nagar (Delhi) |Call Us ≽ 9953322196 ≼ Call Girls In Lajpat Nagar (Delhi) |
Call Us ≽ 9953322196 ≼ Call Girls In Lajpat Nagar (Delhi) |
 

MAIA All Scientific Posters

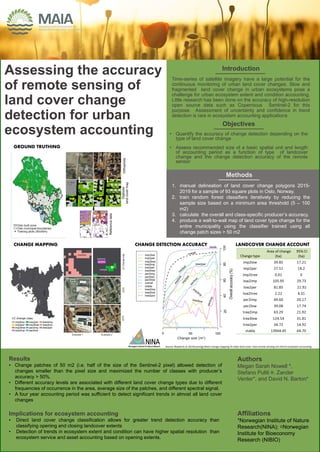
  • 1. Assessing the accuracy of remote sensing of land cover change detection for urban ecosystem accounting Introduction Time-series of satellite imagery have a large potential for the continuous monitoring of urban land cover changes. Slow and fragmented land cover change in urban ecosystems pose a challenge for urban ecosystem extent and condition accounting. Little research has been done on the accuracy of high-resolution open source data such as Copernicus Sentinel-2 for this purpose. Assessment of uncertainty and confidence in trend detection is rare in ecosystem accounting applications Objectives • Quantify the accuracy of change detection depending on the type of land cover change • Assess recommended size of a basic spatial unit and length of accounting period as a function of type of landcover change and the change detection accuracy of the remote sensor Methods Results • Change patches of 50 m2 (i.e. half of the size of the Sentinel-2 pixel) allowed detection of changes smaller than the pixel size and maximized the number of classes with producer’s accuracy > 50%. • Different accuracy levels are associated with different land cover change types due to different frequencies of occurrence in the area, average size of the patches, and different spectral signal. • A four year accounting period was sufficient to detect significant trends in almost all land cover changes Implications for ecosystem accounting • Direct land cover change classification allows for greater trend detection accuracy than classifying opening and closing landcover extents • Detection of trends in ecosystem extent and condition can have higher spatial resolution than ecosystem service and asset accounting based on opening extents. Authors Megan Sarah Nowell *, Stefano Puliti ¤, Zander Venter*, and David N. Barton* Affiliations *Norwegian Institute of Nature Research(NINA); ¤Norwegian Institute for Bioeconomy Research (NIBIO) 1. manual delineation of land cover change polygons 2015- 2019 for a sample of 93 square plots in Oslo, Norway. 2. train random forest classifiers iteratively by reducing the sample size based on a minimum area threshold (5 – 100 m2) 3. calculate the overall and class-specific producer’s accuracy. 4. produce a wall-to-wall map of land cover type change for the entire municipality using the classifier trained using all change patch sizes > 50 m2 Source: Nowell et al. (forthcoming) Direct change mapping of urban land cover: how remote sensing can inform ecosystem accounting GROUND TRUTHING CHANGE MAPPING CHANGE DETECTION ACCURACY LANDCOVER CHANGE ACCOUNT
  • 2. Objectives Demonstrate the integration of extent-condition accounts for urban trees with modeling of regulating ecosystem services and their asset values for different urban planning and policy purposes Test value generalization in urban ecosystem accounting - infer asset value for a whole city accounting area with only partial asset condition data, using machine learning and Bayesian networks Methods Conclusions • Combined ecosystem extent-condition accounts can represent vegetation’s 3D structure needed to predict regulating services using iTree Eco. • Machine learning and Bayesian networks (BN) can be used to tackle missing data in value transfer / generalization from a known sample to partial data on assets in a wider accounting area. BNs provide documentation of inference uncertainty in ecosystem accounting. • Small net aggregate changes in ecosystem extent during an accounting period may conceal large variation in ecosystem condition affecting the spatial distribution of ecosystem services and their benefits Authors David N. Barton, Zofie Cimburova, Frank Hanssen Affiliations Norwegian Institute of Nature Research(NINA) Bayesian network emulation of iTree Eco model input-output variables Results Awareness raising Estimated median asset value of regulating services provided by all tree canopy of Oslo’s built zone ca. NOK 5,4 billion (2014) (€ 635 million, or equivalent to ca. 0.4% of total residential asset value in Oslo) iTree Eco regulating services model estimates per tree Source: Cimburova and Barton 2021 Regulation plan assessment Insignificant net loss in tree canopy extent in suburban plan area 2011-2017 due to loss of taller trees being compensated in extent (but not condition) by smaller tree plantings. Municipal regulation of suburban infill and tree felling permits were insufficient to avoid the loss of greenviews from large trees, while the net effect on regulating services was negligeable. Source: https://transect.org/ Extents (crown cover) Condition (tree height) Thematic urban ecosystem accounts: asset value of the regulating services from trees in Oslo Source: Hanssen et al. 2019
  • 3. Methods Figure 3. Distribution probability of Fucus spp. and zoomed-in example areas. Modelling and graphs: Elina Virtanen, Finnish Environment Institute, October 2021 The capacity of a species or a habitat to provide ecosystem services (ES) depends on the area covered (extent) and its state (condition). Progress in marine ecosystem accounting has been hampered by the lack of information on (i) linkages between ES and marine ecosystem components and on (ii) the influence of the state of the marine environment on ES supply. Establishing such links will enable assessing the costs of degradation of the marine ecosystem. Data & models • Underwater inventory data on species and habitats (since 2004): 170,000 sites across the entire Finnish sea area (https://paikkatieto.ymparisto.fi/velmu/). • Ca. 200 species distribution models (SDMs) at 20 m resolution for the entire Finnish sea area: algae, vascular plants, invertebrates (cf. Virtanen et al. 2018; Fig. 1) Extent Because SDMs describe the probability (p) of detecting a species at a given modelling grid (400 m2), p needs to be translated into spatial extent (E): E = C * p * 100, where C = median cover (0…1) for each species, based on the VELMU inventory data (assessed by a diver for 4 m2 sampling units) Condition Human activities may degrade condition of species and habitats producing ES. If the area covered by a species is presently, e.g., 30 % smaller than that projected by the SDMs, we can hypothesize that direct human impact decreases the ES production by this species by 30 %. Condition was estimated for species and habitats affected by human activities: dredging, dumping, landfill, building of infrastructures (and artificial shorelines), extraction of seabed material and shipping lanes and anchoring areas. The geographical distribution (in km2) of ES producing species was calculated for species in the present degraded condition and in a situation projected by SDMs. Results • 48 habitats and 11 species were linked to ES (Fig. 2) • By using SDMs, the geographical distribution (in km2) of species producing ES was assessed • The condition is reported for human activities which lead to direct habitat loss per grid cell. The loss of an area is based on the average extent (m2) of the activity in question, estimated from aerial images (Fig. 3) • For instance, small jetties which cover on average 20 m2, were identified from 58 850 grid cells. In this case, the area of habitats lost under the jetties totals 1.77 km2 Fig. 3. Degraded areas based on habitat loss, degradation and severe disturbance in an example area off the Capital City Helsinki Fig. 1. Projected distribution probability of Fucus spp. In Finland and zoomed-in examples. • Extent of ES-producing areas can be estimated by combining ES to species and habitats • Condition of ES producing species (and habitats formed by species) can be estimated by comparing the projected and realized (current) distributions of species Piloting Marine Ecosystem Accounts in Finland Background Elina Virtanen*, Susanna Jernberg, Soile Oinonen, Markku Viitasalo Finnish Environment Institute SYKE FI-00790 Helsinki *elina.a.virtanen@syke.fi Objectives 1. Link species and habitats to ecosystem services 2. Use species and habitat modelling to determine ecosystem extent and condition 3. Use this information to develop biophysical marine ecosystem accounts in Finland Conclusions Regulating services Provisioning services Cultural services Habitat Habitat Species Species Habitat Fig. 2. Conceptual presentation of linking of species and habitats to ES (Jernberg et al., in prep.). Habitat forming eelgrass Zostera marina in SW coast of Finland. Photo: Mats Westerbom
  • 4. Modelling aesthetic ecosystem services using social media and computer vision Introduction  The aesthetic quality of the landscape is a key source of cultural value in Europe.  However, capturing this value is difficult at large-scales due to the high cost and complexity of survey methods.  Now, the emergence of big data including social media and computer vision techniques enable new approaches.  We explore the potential of Flickr images and computer vision to establish measures of aesthetic ecosystem service supply Objectives Aim: Develop aesthetic ecosystem service methods using big data from social media and computer vision Questions: 1. Does multiplying the quantity of images with their quality capture peoples’ aesthetic enjoyment of the landscape? 2. Can computer vision capture the aesthetic quality of the landscape in different European settings? 3. How does ecosystem service supply change at different measurement scales? Methods Results  Aesthetic ecosystem service model applied in Great Britain, Spain and the Netherlands.  The ratings generated by the computer vision model are being validated using alternative datasets in the Netherlands and Spain.  Opportunity to re-train computer vision model using Spanish questionnaire results.  Promising results show applying image filters methods better represents aesthetic utility such as only using images with natural elements. Conclusion  Flickr data and computer vision can be used to establish measures of aesthetic ES.  Higher resolution analysis better captures the aesthetic benefits generated by natural ecosystems in the peri-urban environment.  Strong experimental base on which to continue exploring aesthetic ES methods. Authors Ilan Havinga1, Patrick Bogaart2, Adrián García Bruzón3, Fernando Santos Martín3, Lars Hein1 Affiliations 1Wageningen University 2Statistics Netherlands 3Universidad Rey Juan Carlos  Multiple scales: 1 and 25km2 grid cells.  Aesthetic service (utility) = quantity (density of Flickr images) * quality (image ratings).  Image ratings generated using a computer vision model trained on British image dataset.  Questionnaire in Spain to test accuracy of image ratings for Spanish landscapes.  Filtering methods applied to only select images related to aesthetic enjoyment including non-urban filter, image rating filters and image content analysis.  Comparison to environmental indicator model of landscape aesthetics in the Netherlands.  Figure 1. Aesthetic ecosystem service supply for (a) the Netherlands at 25km2 and in (b) the Randstad area at 1km2. Filters have been applied to exclude urban areas and only include images with natural attributes.
  • 5. Flood regulation ecosystem services accounting of mountain watersheds in Bulgaria Introduction Ecosystems’ ability to absorb and store water provide flood regulation services - one of their most important contributions, which yearly save human lives and prevent property destruction. Accounting of flood prevention and mitigation effects allows for raising the efficiency and effectiveness of the utilization and adaptation of specific ecosystem characteristics that can reduce the extent and intensity of flooding and thus diminish the risks of loss of life and damage to build environments. In the case of river floods, the regulation functions include prevention and mitigation. Their geospatial aspects can be represented by the, so-called, Service Providing Areas (SPA) and the Service Demanding Areas (SDA). The geographic analysis of the interactions between SPA and SDA facilitates the development of a methodology for flood regulation accounting at national scale. We focus on three modules of flood regulation ecosystem accounting, i.e. ES potential, ES demand, and ES actual flow (AF), which are tested in three mountain watersheds. Objectives The main objective is to develop a methodology for accounting of flood regulation ES at national scale in Bulgaria. The account is planned in two stages: 1) account, based on three case studies selected within the MAIA project; 2) national scale account within the INES project, planned to start in November 2022. The main task for the first stage are: • Utilization of the results from KINEROS and SWAT models for the ecosystem accounting • Delineation of SPA, SDA, and AF for the test watersheds • Generation of accounting tables for the test watersheds. Methodological approach Analysis The main critical point of the approach involves the identification of the SPA by hydrological modeling and, specifically, through determining the threshold value which delineates the SPA. The results make be a valuable contribution to the updates of the Flood Risk Management Plans, which are among the main policy instruments in flood regulation accounting. Conclusion The quantification of the flood regulation function of the ecosystems is crucial for both ES assessment and accounting. The biophysical modeling provides the much needed quantitative data for the entire watershed, which is the main input, necessary for calculation of the accounting tables’ parameters. Authors Stoyan Nedkov, Mariyana Nikolova, Boian Koulov, Desislava Hristova, Hristina Prodanova, Vanya Stojcheva Affiliations National Institute of Geophysics, Geodesy, and Geography – Bulgarian Academy of Sciences Methods The accounting of flood regulation is based on the assumption that specific ecosystem characteristics can reduce the extent and intensity of floods, thus avoiding or diminishing the risk of damage to build environments and loss of life. The GIS-based AGWA tool, which utilizes the KINEROS (Kinematic Runoff and Erosion) hydrologic model, is applied in the Malki Iskar and Yantra watersheds and the GIS-based ArcSWAT model is applied in the Ogosta watershed. The actual flood regulation accounting is based on the calculation of the Actual Flow (AF), as a function of SBA and SDA. Results The SPA, SDA, and AF are mapped in the three test watershed, based on the models’ results. Accounting tables are prepared for 2000, 2006, 2012 and 2018. The calculations are made for the main ecosystem type, and also at subtype level. Flood regulation assessment Flood regulation accounting
  • 6. Natural Capital Accounts in the Netherlands Dutch accounts: The following accounts are regularly updated on a national scale: • Extent account • Condition account • Ecosystem services accounts (physical and monetary) • Ecosystem asset account • Carbon account • Biodiversity account • Marine accounts (in development) Authors StatNL: Jocelyn van Berkel, Chantal Blom, Patrick Bogaart, Corine Driessen, Rixt de Jong, Linda de Jongh, Redbad Mosterd, Sjoerd Schenau WUR: Lars Hein, Marjolein Lof Website: https://www.cbs.nl/en-gb/society/nature-and-environment/natural-capital Valuing ecosystem services and ecosystem assets for the Netherlands We found that it is important to distinguish between techniques that provide exchange values that are already incorporated in the GDP of SNA and exchange values that are not. In addition, we found that, from a conceptual and practical point of view, the best valuation techniques to apply are: • Provisioning services: Rent-based methods (e.g. stumpage prices, rent prices for agricultural land) • Regulating services: Replacement costs or avoided damage costs methods • Cultural services: consumer expenditure and hedonic pricing Integration of biodiversity indicators into SEEA EA • Regionalization of farmland bird index • Integration of farmland bird index and other relevant biodiversity indicators in SEEA EA condition and biodiversity accounts • Development of indicators on relation between landscape structure and farmland bird populations • Development of pressure indicators on farmland birds Ecosystem services: • Crop and fodder production • Timber production • Drinking water filtration • Air filtration • Carbon sequestration • Pollination • Protection against heavy rainfall • Coastal protection • Reduction of UHI • Nature recreation and tourism • Amenity service Contributions to MAIA: NKR Viewer (in development by SarVision): • Viewer in Dutch with Dutch coordinate reference system • Alignment with NKR as published by StatNL • Plays role in upcoming stakeholder workshops • Organization of user workshop end 2022
  • 7. Natural capital accounting in the Czech Republic Introduction In the Czech Republic, MAIA supported accounts include extent account and ecosystem services accounts. Ecosystem services accounts has been focusing on carbon account (biophysical and monetary), water purification account (biophysical and monetary) and nature-based recreation account (monetary). Beside that, we tested the application of value transfer approach to ecosystem accounting and water retention model. Ecosystem accounting will become a component of the environmental-economic accounts reported by the Czech Statistical Office. Ecosystems extent Authors Davina Vačkářová, Eva Horváthová, Petr Krpec, Tomáš Baďura Affiliation Global Change Research Institute, Czech Academy of Sciences Carbon account • Carbon account presents biocarbon supply and use • Carbon stock in forest trees from wood volume statistics • Monetary carbon accounts are based on value transfer, SCC and MAC Ecosystem type Urban Cropland Grassland Woodland and forest Heathland and shrub Sparsely vegetated areas Wetlands Rivers and lakes Total Opening extent 509797 3703831 819866 2782873 1825 285 10689 57488 7886654 Additions to extent Expansions 23118 32878 34230 100515 590 342 107 893 192673 Managed expansion 23118 32878 33683 100515 51 155 88 887 Natural expansion 0 0 547 0 539 187 19 6 Reductions to extent Regressions 7523 62697 22331 99591 160 61 87 223 192673 Managed regression 7523 62697 21769 98975 77 57 56 221 Natural regression 0 0 562 616 83 4 31 2 Net change in extent 15595 -29819 11899 924 430 281 20 670 Closing extent 525392 3674012 831765 2783797 2255 566 10709 58158 7886654 Diagram of changes between ecosystem classes Ecosystem extent accounting table, 2012 - 2018 Main data source is Corine land cover data set from Copernicus land monitoring program Water retention • Testing of hydrological model application for water budget estimation on a national scale • Main output is yearly retained water in mm (avoided direct runoff) for hydrological response units Value transfer • We tested the applicability of value transfer approach to ecosystem accounting • Meta-analysis of forest valuation studies was performed for Europe based on studies in the period 2000 - 2017 • We found that the total value of forest is approximately 2842 US$ ha−1 year−1, with regulation and maintenance ES being the most valuable services • These results were applied to monetary supply and use table Nature motivated tourism • Uses (i) Tourism Satellite Account data and (ii) two surveys conducted with tourists in the Czech Republic • Determines portion of tourism related spending in Czechia that could be attributed to nature motivated trips • Estimated for (a) all trips and (b) trips that were for recreation only Water filtration – monetary account • Based on replacement cost of drinking water treatment in comparison of surface and groundwater sources • The difference in production costs of drinking water from groundwater and surface ranged between 0.078 and 0.093 EUR  m-3 Ecosystem types Measurement units Cropland Woodland and forest Urban Heathland and shrub Grassland Rivers and lakes Wetlands Sparsely vegetated a. TOTAL SUPPLY Groundwater purification K EUR/ year 9,533 6,746 2,626 2,274 1,806 274 31 2 23,293 Total 23,293 2018 2019 2020 Tourism spending total (EUR mil.) 11,915 12,330 5,432 Nature Motivated Spending All trips 4,356 4,492 2,209 Proportion 51% 52% 56% Recreation only trips 3,103 3,341 1,643 Proportion 36% 37% 42% Institutional sector Measurement units agriculture forestry fisheries mining and quarrying manufacturing construction electricity, gas supply water collection, treatment, supply other industries households TOTAL USE groundwater purification K EUR/ year 23,293 23,293 Total 23,293 23,293
  • 8. National Monitoring Data & Accounting for Biodiversity Introduction There is now a growing group of countries producing SEEA Ecosystem Accounts for mainstreaming biodiversity into decision-making. The core accounts of the SEEA EA allow for the broad measurement of ecosystem-level biodiversity and integration with standard economic information. The SEEA EA also describes thematic accounting for biodiversity, as one of four themes in Chapter 13. Thematic accounting for biodiversity opens up the potential for integrating information on ecosystems to better support decision-making. In order to achieve the best representation of biodiversity in ecosystem accounts, account compilers need data that accurately describes the distribution and condition of different components of biodiversity. National biodiversity monitoring programmes allow the collection and integration of such data, both at the ecosystem and species level, for thematic accounting for biodiversity as described in the SEEA EA. As part of the MAIA project, UNEP-WCMC has coordinated a ‘National Monitoring Data & Accounting for Biodiversity’ report. This provides a synthesis of the Accounting for Biodiversity work being undertaken in MAIA countries and provides a rich overview of a range of practical approaches for implementing biodiversity accounting across the European Union. The report is being currently updated to capture further progress by MAIA countries. A preliminary version of the report can be accessed in the internal environment for consortium members of the MAIA web portal. Objectives The report aims to answer two main research questions: 1. How can existing national biodiversity monitoring processes be adapted for informing Biodiversity and Ecosystem Condition Accounting? 2. What specific biodiversity data items could be included in SEEA EA accounts for better guiding decisions on biodiversity? Contributors Radoslav Stanchev (Bulgaria EEA), Peter Kullberg (SYKE), Jussila Tytti (SYKE), Adrien Comte (University of Brest), Panayotis Dimopoulos (UPTRAS), Ioannis Kokkoris (UPTRAS), Burkhard Schweppe-Kraft (BfN), Beyhan Ekinci (BfN), David Barton (NINA), Signe Nybø (NINA), Anders Kolstad (NINA), Olav Skarpaas (University of Oslo), Pablo Campos (CSIC), Alejandro Caparros (CSIC). Methods • Interviews & email exchanges with MAIA country partners • Literature review – Secondary research • Follow up meetings with project partners • Direct inputs to the draft from contributors MAIA Countries Covered • Bulgaria • Finland • France • Germany • Greece • The Netherlands • Norway • Spain and Andalusia Authors Steven King (UNEP-WCMC), Hashim Zaman (UNEP-WCMC), Claire Brown (UNEP-WCMC), Elise Belle (WCMC Europe) Q1: Using National Biodiversity Monitoring for Ecosystem Accounting • Ecosystem established processes for organizing monitoring data for reporting on the EU Nature Directives and National Biodiversity Indexes can support ecosystem accounting. • National IUCN Red List type assessments can be used to compile thematic ‘Species Accounts’. • Species abundance and richness accounts developed from national biodiversity monitoring data can inform ecosystem condition and cultural services accounts. • Where spatial referencing for national biodiversity data is limited, information on species can be assigned to different broad ecosystem types based on habitat preferences. • Structured frameworks such as Elite Index (Finland) and IBECA index (Norway) can be adapted to inform SEEA EA Ecosystem Condition Typology. • Defining reference conditions for compiling ecosystem condition accounts is very challenging. Q2: Biodiversity data items for better decision- making • Integrating red list assessment data can help inform a more integrated planning for achieving conservation objectives. • Compositional state indicators need to be included in Ecosystem Condition Accounts as other condition characteristics do not adequately reflect trends in species assemblages. • Extended analyses by France and Germany allow for a “Biodiversity Debt”, Underinvestment, and Budgetary investments to be determined. • Integration of thematic ‘Protected Area Accounts’ into SEEA EA can help decision-makers evaluating different land use and sustainable development options. • Biodiversity trends presented in ecosystem accounts need reference thresholds for decision-makers to realise what is in good or poor condition. • Science-based policy targets provide reference levels to track progress towards national biodiversity objectives.
  • 9. MAIA-supported ecosystem accounting in European countries Introduction The overall objective of MAIAWP3 is to ensure mainstreaming of NCA(based on the SEEA-EAguidelines) and alignment with identified policy needs (from MAIAWP2) within the 10 countries that are participating in MAIA, on the basis of existing and newly initiated pilot account projects in each participating country. The basic rationale behind WP3 is that testing and mainstreaming NCA approaches are most effectively done on the basis of concrete accounts, where available methods (principally, but not limited to the SEEA-EAguidelines and the central framework) are tested, applied and evaluated jointly by a range of relevant partners. Overview accounting efforts in MAIA MS • The tables on the right provides a summary of the NCAprogress per country (focused on ecosystem core accounts) including an overview on contributions (support and coordination) of MAIA. • The table demonstrates that the WP3 activities of supporting and mainstreaming NCA activities based on the assessment of the state-of-the- art in the participating countries (MAIADeliverables D3.1. and D3.2) was useful in order to create tailor-made solutions for each country and the involved stakeholders. • In the upcoming Deliverable (D3.3), the MAIA-supported NCAefforts on the ecosystem core accounts are highlighted and for each MAIA-supported ecosystem core account a detailed report including technical as well as content related aspects is provided. Challenges and future possibilities Lack of Authors and affiliations Lead: Sabine Lange and Benjamin Burkhard (Leibniz University Hannover); Fernando Santos-Martín andAdrián García-Bruzón (King Juan Carlos University) Contributing: Wageningen University, University Campus Rio Patras, National Institute of Geophysics, Geodesy and Geography - Bulgarian Academy of Sciences, Finnish Environment Institute, VITO, National Statistical Institute of Bulgaria, EV INBO Research Institute Nature & Forest, Norwegian Institute for Nature Research,Agencia Estatal Consejo Superior de Investigaciones Científicas, Global Change Research Institute CAS - The CzechAcademy of Sciences, Statistics Netherlands, WCMC LBG, Paris Institute of Technology for Life, Food & Environmental Sciences, Statistics Norway, SarVision, Executive EnvironmentalAgency - Bulgarian Ministry of Environment & Waters Core accounts MAIA countries Status of the account Extent account Condition account Biophysical ecosystem services account Monetary ecosystem services account Ecosystem asset account Belgium Finished On-going /planned Bulgaria Finished On-going /planned Czech Republic Finished On-going /planned Finland Finished On-going /planned France Finished On-going /planned Germany Finished On-going /planned Greece Finished On-going /planned * * Netherlands Finished On-going /planned Norway Finished On-going /planned Spain Finished On-going /planned *Spatial scale uncertain LEGEND: MAIA contribution & largest spatial scale achieved MAIA-supported Account – sub-national scale MAIA-supported Account - national scale MAIA-independent Account -national scale MAIA-independent Account – sub-national scale • Expert networks & enhanced knowledge sharing • More collaboration between stakeholders •Automated workflows • Guide of applications and dealing with uncertainties •Political or policy support •Financial resources or personal Need for • More/ stronger policy support (official policy enforcement) •Sustainable funding sources • More training & capacity building on the science-policy-practice interface • Increased level of awareness & communication of results •Knowledge & technical skills •Data/ data access Exemplary MAIA-supported ecosystem forest condition accounting in Spain Set of indicators Ecosystems Reference areas Good condition Bad condition Step 1: Selection ecosystem types Step 2: Selection condition indicators Step 3: Selection reference areas Step 4: Aggregation in a condition index Step 5: Reporting in accounting tables 50% 40% 30% 20% 10% 0% 40.000 20.000 0 80.000 60.000 Bad Regular Good High Square kilometers
  • 10. Experimenting biophysical marine accounts and economic accounts based on maintenance cost in France Introduction Focus on marine ecosystems in the French Exclusive Economic Zone (EEZ) Benthic (seafloor) and pelagic (water column) ecosystems Specific difficulties linked to the marine environment: Context of poor datasets on habitats and species over space and time 3Dimensions environment Objectives • Align the SEEA EA with the needs of ecosystem management and the principles of strong sustainability • Extent account + ecosystem condition account of marine ecosystems • Produce condition account divided in three categories linked to management objectives (1) Function: the maintenance of ecosystem overall functionality (2) Heritage: The conservation of specific features or elements (3) Capacity: The capacity of ecosystems to sustainably provide goods and services • Define target conditions of good ecological status based on Marine Strategy Framework Directive • Assess Unpaid ecological cost from gap between observed costs and required costs for the maintenance and restoration of natural capital. Net of incurred cost they allow to derive a measure of unpaid ecological costs (Vanoli, 1995, 2015) Analysis Building ecosystem accounts allows helps to (1) assist in the identification of data gap (2) harmonize and integrate existing ecosystem monitoring processes (3) foster the development of more integrated policies (4) relate state of ecosystems to economic agents, but no spatial-explicit data on this link Further work include (1) develop public architecture of spatial datasets (2) institutional capacity to scale-up the project (3) limited availability of spatial datasets for the marine environment and temporal trends, (4) clearly define reference conditions Authors Adrien Comte1,2,3, Solène Legrand1, Félix Garnier1, Yann Kervinio1, Clément Surun1, Pierre Scemama2, Rémi Mongruel2, Frédéric Quemmerais- Amice4, Harold Levrel1 Affiliations 1CIRED, AgroParisTech, CIRAD, CNRS, EHESS, Ecole des Ponts ParisTech, Université de Paris-Saclay, Campus du Jardin Tropical, Nogent- sur-Marne, France 2Université de Brest, Ifremer, CNRS, UMR6308 AMURE, IUEM, Plouzané, France 3 EcoAct, Paris, France 4 Office Français de la Biodiversité, Brest, France Methods • Ecosystem accounting area : French EEZ, divided into four marine sub- regions • Ecosystem types : EUNIS classification (Figure 3) • Unpaid ecological costs computed four steps (1) the correlation between observed costs evolution and ecosystem condition trends (2) Application of a dose-response model allowing the estimation of the change in ecological state (3) estimation the cost required to reach reference level from current condition (4) difference between required costs and observed cost to calculate unpaid ecological cost • Data sources : French biodiversity office (OFB), Ifremer, SIMM, Quemmerais-Amice et al., (2020), CarpeDiem, INPN, MSFD reports Results • Extent: No-trend datasets available, composite map • Contains multiple indicators that are all spatially explicit, but with various timeframes available (Table 1) • Target conditions, described for 2/9 indicators : eutrophication (Figure 4) and fish stocks (Figure 5) • Unpaid Ecological cost computed for several ecological descriptors as yearly required costs to reach reference levels of good ecological status (Table 2), broader than condition indicators described above Areas reaching good ecological status for Eutrophication (left) & number of fish stocks (right) Unpaid Ecological Cost Descriptors ECNS CS BoB WM France Heritage Biodiversity (D1 – OFB) 19,911,500€ 19,911,500€ 19,911,500€ 19,911,500€ 79,646,000€ Heritage Biodiversity (D1 – DOCOBs) 2,834,750€ - 3,825,000€ 2,834,750€ - 3,825,000€ 2,834,750€ - 3,825,000€ 2,834,750€ - 3,825,000€ 11,339,000€ - 15,300,000€ Capacity Fishing (D3) – MSFD 28,287,000€ - 100,832,000€ 26,144,000€- 94,145,000 81,054,000€ - 408,958,000€ 58,724,000€ - 99,683,000€ 194,207,000€ - 703,618,000€ Capacity Fishing (D1 + D3 + D6 – outing of trawlers) 91,534,000€ 35,164,000 € 144,486,000€ 16,008,000€ 287,192,000€ Function Eutrophication (D5 – MSFD) 3,049,000€ - 8,209,000€ 29,074,000€ - 44,207,000€ 2,164,000€ - 16,874,000€ 213,000€ - 10,320,000€ 34,500,000€ - 79,583,000€ Function Micropolluants (D8 – MSFD) 153,651,000€ - 228,849,000€ 36,256,000€ - 40,166,000€ 21,553,000€ - 63,131,000€ 80,178,000€ - 118,476,000€ 291,908,000€ - 450,622,000 Function Health (D9 – MSFD) 6,394,000€ - 583,867,000€ 9,476,000€ - 641,179,000€ 7,428,000€ - 300,804,000€ 25,981,000€ - 349,558,000€ 49,279,000€ - 1,875,408,000€
  • 11. Freshwater accounts at river basin scale in Peloponnese, Greece Introduction According to the EU’s Water Framework Directive (WFD) reporting obligations, Greece has completed two River Basin Management Plans (RBMP) updates. These reports provide a wealth of spatial and temporal datasets for water resources. The System of Environmental- Economic Accounts for Water (SEEA-Water) enables the connection between water ecosystems and the economy and utilise such water- relevant datasets. In this work, the SEEA-EEA framework applies on freshwater resources, surface and groundwater, in terms of (a) extent accounts, (b) condition accounts, (c) supply and use of provisioning ecosystem services, focusing on drinking and irrigation water supply and use accounts for selected years from 2010 to 2021 depending on the availability of complete and reliable data. The case study for applying the water ecosystem accounts is the Alfeios river basin in Western Peloponnese, Greece. Objectives • Implementation of SEEA-EEA framework for freshwater ecosystems, including rivers, lakes and groundwaters at river basin scale • Extent accounts • Condition accounts • Drinking water supply and use accounts • Irrigation water supply and use accounts Analysis Surface and groundwater bodies do not show any significant change as concerns extent. A barely noticeable overall negative trend is observed in the river ecological condition and no change to groundwater condition. In the Alfeios River basin, the use value for drinking water in 2021 is approximately six million Euros, and the use value for irrigation water in 2018 is close to 29 million. The results are experimental (tentative), considering the number of necessary assumptions and the absence of detailed information. Conclusion The officially registered national and European datasets can serve as good initial basis for mapping and compiling water ecosystem accounting at national and local scale in Greece. The future WFD reporting cycles of the river basin management plans could be structured in a way to enable a better and a more direct connection of the provided dataset to ecosystem accounts. Authors Eleni S. Bekri 1,2 Ioannis P. Kokkoris 2 Maria K. Stefanidou1,2 Dimitrios Skuras 3 Panayotis Dimopoulos 2 Affiliations 1. Department of Civil Engineering, Environmental Engineering Laboratory, University of Patras, Rion, Greece 2. Department of Biology, Laboratory of Botany, University of Patras, Rion, Greece 3. Department of Economics, Laboratory of Industrial, Innovation and Regional Economics, University of Patras, Rion, Greece Methods • We follow the methodological framework proposed in SEEA-EEA. • For the water accounts expressed in spatial units, we use the EEA reference grid for Greece with cell size 1×1 km2. • The spatial analysis is undertaken in ArcMap 10,8. • Datasets from the two reporting WFD cycles, Corine LU/LC, Population census, Eurostat Water database, IACS geodatabase, JRC Global Surface Water, FADN standard output, Hellenic Statistical Authority. Results • Extent accounts at MAES level 3, identifying rivers, lakes and groundwater bodies from 1990 to 2018 and changes in lakes seasonality between 1984 and 2020. • Condition accounts based on the freshwater condition, i.e (i) ecological condition reported for river and lake water bodies & (ii) chemical, quantitative & total condition for groundwater bodies, with opening period (2009-2015) and closing period (2016-2021). • Drinking water supply and use maps in biophysical and monetary terms, as well as summary accounting tables at river basin level, from 1991 to 2021. Valuation based on average financial cost per m3 of supplied water since there is no competitive market. • Annual irrigation water supply and use maps in biophysical and monetary terms, as well as summary accounting tables at river basin level from 2015 to 2018. The residual valuation method utilised the agricultural area from IACS, the standard output per cultivation from FADN and regional agricultural accounts coefficients. Case study area: Alfeios river basin Greece Annual irrigation water use (in m3) in 2018 Annual drinking water supply(in m3) in 2021 Summer drinking water supply (in m3) in 2021 Peloponnese
  • 12. Water balance modelling for monitoring groundwater storage and valuing groundwater recharge, a case-study for Flanders Introduction Especially during dry periods there is a high demand for data that gives insight in the status of the phreatic groundwater system. Current indicators are primarily based on scattered groundwater head observations and provide only limited insight in the regional availability of groundwater. Although groundwater head observations are crucial for groundwater management, individual head observations are often difficult to interpret. Methods: Straightforward water balance calculation on catchment scale To provide additional information about the groundwater storage dynamics we propose a water balance approach based on: •catchment scale groundwater recharge simulations using the WetSpass-M model (Abdollahi et al. 2015), •river discharge measurements at the outlet, •groundwater abstraction data. Additionally, a groundwater flow model could be used to allow validation of the simulations based on observed groundwater heads. Analysis and conclusion This study shows that the proposed groundwater balance simulations could provide relevant insights in both the dynamics of the groundwater system. The temporary results however indicate that more information is required on local parameters (e.g. effect of soil sealing and local drainage systems..) to correctly simulate the groundwater recharge. The spatially distributed groundwater recharge simulations also allow to evaluate the impact of the land-use on the groundwater recharge and as such also the relative contribution of the land-cover to water storage in the sub-surface. Authors Dams J.1, De Nocker L. 1, Beckx C. 1, De Smet L. 2, Bronders J. 1 and Broekx S. 1 Affiliations 1Environmental Modelling Unit, Flemish Institute for Technological Research (VITO), Boeretang 200, 2400 Mol, Belgium 2Nature and Society, Research Institute for Nature and Forest (INBO), Havenlaan 88 bus 73, B-1000 Brussels, Belgium Results • Monthly maps of actual evapotranspiration, runoff and groundwater recharge • The relative importance of certain land- use types for groundwater • Insight in the dynamics of groundwater stored in the phreatic aquifer in different catchments in Flanders. . Fig. shows the temporary output of the calculations for the Demer sub-catchment. Groundwate r Recharge [mm/month] Average runoff (blue), evapotranspiration (red) and groundwater recharge (green) per land-use type Groundwater recharge for Flanders simulated for January 2016 Monthly water balance for the phreatic groundwater system of the Demer catchment. The bar plots show the different components of the water balance. The monthly dynamics in groundwater storage is shown by the filled line. A positive change in groundwater storage represents a net replenishment of the groundwater storage while a negative value represents a depletion of the groundwater storage.
  • 13. Health benefits of urban green space, Assessment and Valuation, a case study in Flanders, Belgium Introduction Growing scientific evidence that exposure to (urban) green areas results into health benefits for physical and mental morbidity and mortality. Different mechanisms explain these impacts (stress release, exercise,…).Although the health benefits of greenareas are widely recognized, there are barely methods and tools available to assess these benefits in the context of natural capital accounting. Quantification is challenging due to the wide variation in methods (indicators to define green areas and exposure to), scope (green areas, health outcomes) and contexts. In addition, assessment of health benefits requires region specific health data for a wide range of health outcomes. Economic valuation requires to account for a wide range of region specific data (costs of illness, labour productivity,…) and integration of different methods (market data, valuation studies for longer life expectancy,…) Objectives and scope • Quantification and valuation of Health Benefits of Exposure to Greenspace in Flanders • Greenspace (% green area 1-3 km around place of residence), green” areas = all green land use, including parks, forests, agriculture, gardens (private and public), small informal green areas, surface waters. • Exposure to = contact with = recreation + sport + view on green + … • Health = avoided physical and mental illness and + longer life expectancy • Benefits= avoided health care costs (e.g. hospitalization) + productivity gains (less absenteeism) + welfare gains (life expectancy, suffering) Add your image here Analysis and conclusion Strengths Methods in line with health impact assessments and economic valuation. Results shows importance of urban and rural green areas for public health, and the related economic impacts, esp. for health care and economy. This is an important ecosystem service (average 3400 euro/ ha.year for Flanders). Unknown overlap with ecosystem services for recreation, tourism and real estate values. Results used to promote (urban) green infrastructure and preventive health care policy. Limitations Indicators to define exposure and green areas are too rough / uncertain for planning or management at local level or assessment of impacts of short term trends or policies. Authors Leo De Nocker, Inge Liekens , Steven Broekx Affiliations Environmental Modelling Unit, Flemish Institute for Technological Research (VITO), Boeretang200, 2400 Mol, Belgium Contact: leo.denocker@vito.be Methods and results Exposure to green space Share of greenspace in total land use (1 km around place of residence) Green Space: Vito land use map 10m x10 m ; 22 landuse categories Example: city of Antwerp Benefits: avoided health impacts 85.000 DALY’s (disability adjusted life years ) = 27% of burden of disease for these diseases Economic valuation health benefits Benefitsamount to: 3 billion euro.year for Flanders 2016 = 1,3 % of GDP Flanders = 464 euro/inhabitant.year Avoided health costs (36%) and Absenteeism (52%) are most important benefit categories 1 2 3 Health impacts Selected Doseeffect relationships 4 Median: 73% (m), 10% has less than 48%
  • 14. MAIA Viewer The MAIAviewer provides online analysis and reporting of EcosystemAccounts. Data providers CBS - Statistics Netherlands Wageningen University (Netherlands) NINA(Norway) CSIC (Spain) AgroParisTech (France) National Institute of Geophysics, Geodesy and Geography, Bulgarian Academy of Sciences (Bulgaria) EcosystemAccounts can be analyzed and viewed. Histograms, change matrices and extent accounts can be produced in seconds for predefined areas, like provinces or communities or for custom polygons. Authors Rob Luiken (SarVision) Lars Hein (WUR) Eco system types 2000 and 2018 compared to each other in Bulgaria Extent breakdown matrix for land cover 2015-2019 in the community of Oslo (Norway) Histogram chart for eco system types in the province of Gelderland (Netherlands) Account table for floriculture productivity 2015-2018 in the community of Lisse (Netherlands)