Downloaded 33 times


![2%
19%
24%
26%
23%
6%
2%10%
24%
23%
31%
11%
3%
23%
28%
24%
14%
7%
Strongly
disagree
Neither
agree
nor
disagree
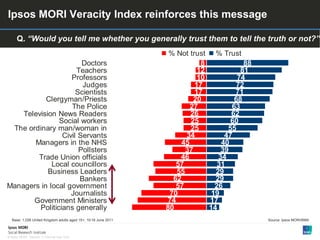
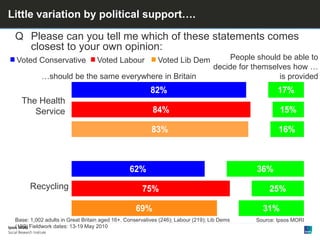
Government distrusted – but you’re best
I would now like to ask you some questions about the way Britain is governed. How strongly, if at all,
do you agree or disagree with each of the following statements? “[xxx] acts in the best interests of
people like me”
Base: 1,967 British adults 16+, 26 September – 3 October 2014 Source: Ipsos MORI
Strongly
agree
Tend to
disagree
Don’t know
Tend to
agree
UK GovernmentLocal government European
Parliament
21%
49%
26%
38%
12%
54%](https://image.slidesharecdn.com/devolutionsummitglasgowfeb2015-150209062844-conversion-gate01/85/Governing-our-great-cities-12-320.jpg)


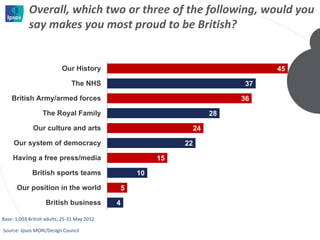
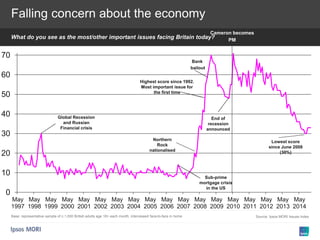
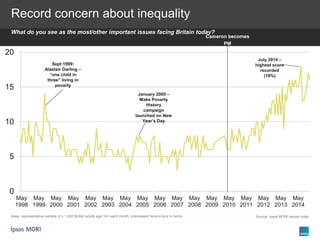
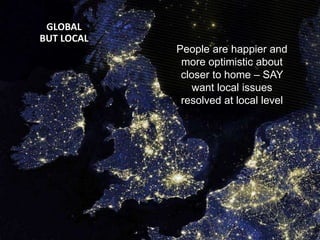
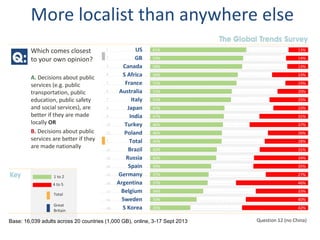
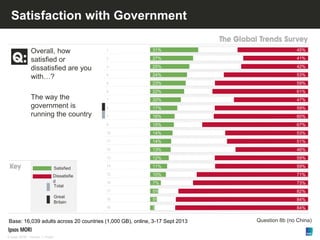
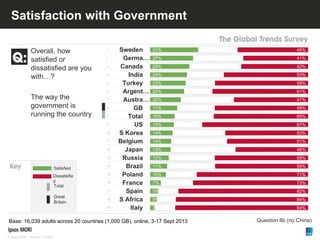
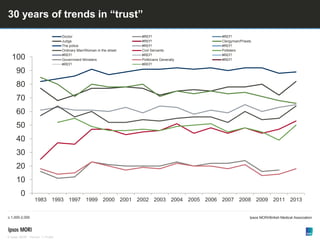
The document presents data and insights from Ipsos Mori on public sentiment regarding governance, local service provision, and trust in government among British adults, highlighting the significance of localism and the varying levels of trust in different institutions. It discusses trends in public pride, economic concerns, and the perception of public services, illustrating an ongoing demand for greater local control and satisfaction with local councils over national government. Satisfaction ratings reveal a general distrust in central government, while there is a desire for more direct involvement in local decision-making processes.


