
Recommended
Recommended
More Related Content
What's hot
What's hot (20)
Recently uploaded
Recently uploaded (13)
Process engagement matrix
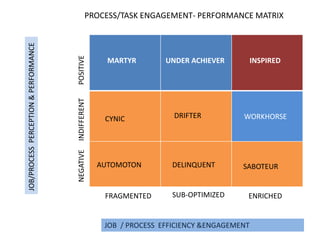
- 1. PROCESS/TASK ENGAGEMENT- PERFORMANCE MATRIX MARTYR UNDER ACHIEVER INSPIRED WORKHORSE POSITIVEINDIFFERENTNEGATIVE JOB / PROCESS EFFICIENCY &ENGAGEMENT FRAGMENTED SUB-OPTIMIZED ENRICHED JOB/PROCESSPERCEPTION&PERFORMANCE DRIFTER SABOTEURDELINQUENT CYNIC AUTOMOTON
- 2. JOB PERCEPTION VS. BEHAVIOUR 9 employee engagement archetypes BEHAVIOUR PERCEPTION BRAT UNDER ACHIEVER INSPIRED DELINQUENT DRIFTER WORKHORSE SABOTEUR CYNIC MARTYR DESTRUCTIVE NEUTRAL CONSTRUCTIVE NEGATIVEINDIFFERENTPOSITIVE
- 3. 3 D MATRIX OF JOB ENGAGEMENT VS.PERCEPTION VS. BEHAVIOUR JOB COMPLEXITY & ENGAGEMENT JOBPERCEPTION&PERFORMANCE fragmented optimized enriched positive indifferent negative visionaryleadermanager brat disruptor maverick Under achiever inspiredmartyr radical parasite hypocrite asshole dissenter destroyer workhorsesaboteur delinquent driftercynic automoton introvertSelfseeker
- 4. Six sided employee performance management VISIONARY STRATEGY – corporate /SBU level BEHAVIOUR INDEX 0.75-0.90 CAPABILITY–high leadershipcompetences ENRICHMENT INDEX > .9 PERCEPTIONINDEX >0.95 Process content – decision support system
Editor's Notes
- The orange grids indicate zones where employees are either not performing to their fullest ability or are apathetic and demotivated due to degree of job/process engagement except in the case of the “saboteur” who because of negative job perception and motivation exhibits disruptive behaviour. Typically jobs in these zones are marked by simple or even a series of tasks that are routine and do not challenge the person and in most cases is due to fragmentation of tasks to smaller simplistic quantums or over specialization. The type of behaviour exhibited by employees is indicated in the grid and the causal relationship between the two variables shown could be reciprocal and mutually reinforcing. The blue grids indicate zones where employees have more meaningful jobs and span of control but still fall short of fully optimized systems except in the case of the “workhorse” where due to job perception and motivation or capability falls into the category of having to work at streched capacity. Employees who are in the inspired zone work in an environment characterized by empowerment to take decisions and supported by systems of excellence and collaboration across divisions making it a holistic experience. Although only two variables are shown in the matrix ie. job complexity/engagement and job perception/performance, there is a third variable or determinant indicated by type of behaviour or job attitude shown by the description within each grid of the matrix.
- gauge employees’ perceptions in six areas: culture, job function, advancement, company leadership, management, and total rewards. We also examine self-reported behaviors in six categories: level of effort, personal development, company loyalty, recreation, relationships, and temperament. This holistic approach to understanding engagement will yield more-detailed insights into what makes people stick around and do their best work. Instead of viewing engagement in terms of low, medium, and high, organizations will be able to understand how employees perceive them, how that perception relates to their behavior, and in aggregate, how those factors drive bottom-line performance. If organizations don’t dig deep like this, they risk misunderstanding their employees and missing out on all the benefits of high engagement.
- It is assumed that the causal relationships in slide 1 holds under the neutral job attitude/behaviour and the destructive and constructive states reflect nuanced variations of the former.
- Each individual cube or cell has six sides which not only describes its engagement in terms of perception,behaviour and enrichment but can also describe the strategy, process and capability content of the job or task. This integrates job engagement with job performance and measurement. For example the “visionary” cell could have embedded attributes measured along strategy, process and capability based on the jobs actual coordinates within the organization structure. These attributes can be measured through KPIs, BSC metrics or any other measurement model.