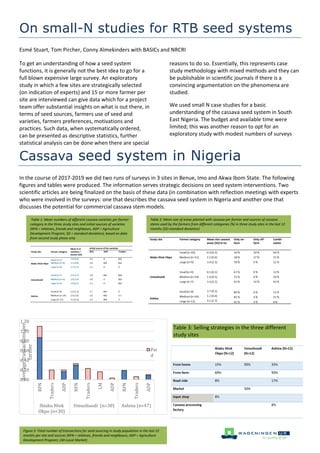
1. Figure 2: Total number of transactions for seed sourcing in study population in the last 12
months per site and sources (RFN = relatives, friends and neighbours; ADP = Agriculture
Development Program; LM=Local Market)
On small-N studies for RTB seed systems
Esmé Stuart, Tom Pircher, Conny Almekinders with BASICs and NRCRI
To get an understanding of how a seed system
functions, it is generally not the best idea to go for a
full blown expensive large survey. An exploratory
study in which a few sites are strategically selected
(on indication of experts) and 15 or more farmer per
site are interviewed can give data which for a project
team offer substantial insights on what is out there, in
terms of seed sources, farmers use of seed and
varieties, farmers preferences, motivations and
practices. Such data, when systematically ordered,
can be presented as descriptive statistics, further
statistical analysis can be done when there are special
reasons to do so. Essentially, this represents case
study methodology with mixed methods and they can
be publishable in scientific journals if there is a
convincing argumentation on the phenomena are
studied.
We used small N case studies for a basic
understanding of the cassava seed system in South
East Nigeria. The budget and available time were
limited; this was another reason to opt for an
exploratory study with modest numbers of surveys
Cassava seed system in Nigeria
In the course of 2017‐2019 we did two runs of surveys in 3 sites in Benue, Imo and Akwa Ibom State. The following
figures and tables were produced. The information serves strategic decisions on seed system interventions. Two
scientific articles are being finalized on the basis of these data (in combination with reflection meetings with experts
who were involved in the surveys: one that describes the cassava seed system in Nigeria and another one that
discusses the potential for commercial cassava stem models.
0.00
0.20
0.40
0.60
0.80
1.00
1.20
RFN
Traders
ADP
RFN
Traders
LM
ADP
RFN
Traders
ADP
Ibiaku Ntok
Okpo (n=30)
Umuohuodi (n=30) Ashina (n=47)
Average transactions per
farmer
Pai
d
Table 1: Mean numbers of different cassava varieties per farmer
category in the three study sites and initial sources of varieties
(RFN = relatives, friends and neighbours, ADP = Agriculture
Development Program, SD = standard deviation), based on data
from second study phase only
Table 2: Mean size of areas planted with cassava per farmer and sources of cassava
stems used by the farmers from different categories (%) in three study sites in the last 12
months (SD=standard deviation)
Table 3: Selling strategies in the three different
study sites