"Lesotho Leaps Forward: A Chronicle of Transformative Developments"
An evaluation of haz liquation cracking susceptibility part i development of a method for quantification
1. WELDING RESEARCH
SUPPLEMENT TO THE WELDING JOURNAL, APRIL 1993
Sponsored by the American Welding Society and the Welding Research Council
An Evaluation of Heat-Affected Zone Liquation
Cracking Susceptibility, Part I: Development of
a Method for Quantification
A material-specific quantification of liquation cracking susceptibility was
developed using the hot-ductility, spot- and longitudinal-Varestraint tests
BY W. LIN, J. C. LIPPOLD AND W. A. BAESLACK III
ABSTRACT. A new methodology has
been developed for quantifying heat-af-
fected zone (HAZ) liquation cracking
susceptibility. This methodology char-
acterizes a thermal crack-susceptible re-
gion (CSR) in the HAZ. The thermal CSR
was theoretically derived based on the
ductility of a material during welding as
obtained from the Gleeble hot-ductility
test and the criteria assumed in the de-
velopment of liquation cracking theo-
ries. This CSR was experimentally veri-
fied using longitudinal- and spot-Vare-
straint tests performed on A-286 and
Type 310 stainless steels. The thermal
CSR is material-specific and represents
a true quantification of liquation crack-
ing susceptibility. The development of
this methodology has 1) elucidated the
physical relationship among weldability
test results, liquation cracking theories
and material properties; 2) provided a
more precise interpretation of hot-duc-
tility, spot- and longitudinal-Varestraint
tests; 3) defined a method for determin-
ing a material-specific measure of HAZ
W. LIN and). C. LIPPOLD are with Edison
Welding Institute, Columbus, Ohio. W. A.
BAESLACK III is with The Ohio State Univer-
sity, Columbus, Ohio.
Presented at the 73rd Annual AWS Meeting,
held March 22-27, 1992, in Chicago, III.
liquation cracking susceptibility; 4) elim-
inated the inconsistency among certain
weldability test results; 5) added impor-
tant insight regarding the mechanics of
HAZ liquation cracking, and 6) con-
firmed the criterion assumed in the de-
velopment of liquation cracking theo-
ries, which states that cracking results
from the localized loss of grain bound-
ary ductility due to liquation. This paper
addresses the theoretical background
KEY WORDS
Brittle Temperature
Range
Crack-Susceptible
Region
Heat-Affected Zone
HAZ Liquation
Cracking
Hot-Ductility Test
Liquation Cracking
Stainless Steels
Varestraint Test
Weldability
Weldability Test
Technique
and experimental procedure involved in
the development of the methodology. A
subsequent paper will describe the met-
allurgical basis for HAZ liquation crack-
ing as it relates to this methodology.
Introduction
HAZ liquation cracking is a type of
high-temperature weld cracking that oc-
curs in the HAZ adjacent to the fusion
boundary (Ref.1). This type of cracking
is often encountered during the welding
of a variety of engineering alloys. It is
particularly prevalent in nickel- and alu-
minum-based alloys, and in fully
austenitic stainless steels. The metallur-
gical basis for cracking involves the pres-
ence and persistence of liquid films at
grain boundaries and the inability of
these films to accommodate the ther-
mally and/or mechanically induced
strain experienced during weld cooling.
Although the precise mechanisms for li-
quation cracking are not fully under-
stood, it is recognized that the simulta-
neous presence of a crack-susceptible
microstructure and a critical level of re-
straint is necessary to promote cracking.
Si nee the control of weld restraint is often
difficult, reduction in liquation cracking
susceptibility is normally achieved by
adjusting the composition and mi-
crostructure.
WELDING RESEARCH SUPPLEMENT I 135-s
2. welding direction
A C
<SZ2232ZS323BE£5S£ _E_>
o o
.
ssss
J block
Front View £ £ t / ( 2 R + t )
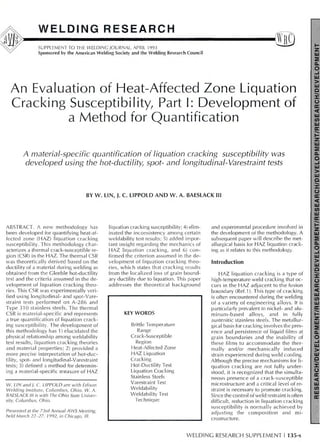
Fig. 1 — Schematic illustration of the longitudinal-Varestraint test.
Since the 1950s, the effects of com-
position and microstructure on liqua-
tion cracking susceptibility have been
studied extensively using weldability
testing techniques. To date, over 150
separate and distinct techniques have
been developed to quantify weld solid-
ification and HAZ liquation cracking
susceptibility (Ref. 2). These tests vary
widely in their approach and utility, but
can generally be classified as represen-
tative (self-restraint) or simulative (aug-
mented restraint) test techniques (Refs.
3,4).
Representative test techniques, such
as the circular patch test, seek to repro-
duce the actual welding condition as
closely as possible in an effort to accu-
rately "represent" the situation of inter-
est. These tests depend on self-restraint
induced by the specimen design and/or
fixturing. In most cases, these test tech-
niques only provide a simple "crack or
no crack" solution for a specific mate-
CO
HAZ cracks
spot weld
*""l
OO
Top View
specimen
•>/////;/////// sin?
^r-
GTAW torch
n PI
force
Front View
e = t/(2R+t)
Fig. 2 — Schematic illustration of the spot-Varestraint test.
rial/process/restraint combination. They
are ineffective in quantifying weldabil-
ity among different materials because of
the difficulties in isolating the material
factor from the test results.
Simulative test techniques, such as
the Varestraint test, attempt to simulate
some aspect of the thermomechanical
response of the material to the welding
process. These tests normally involve
the application of an external aug-
mented stress or strain whose magnitude
can be easily quantified. The thermally
induced restraint of the specimen and/or
fixturing is usually negligible compared
with the relatively large amount of ex-
ternally applied stress or strain. This ap-
proach allows the metallurgical and
compositional factors associated with
cracking to be isolated from the me-
chanical factors, and permits their ef-
fects to be studied and quantified. As a
result, simulative tests have been suc-
cessful in providing a comprehensive
order ranking of families of alloys or
heats of a given alloy. However, the test
conditions, especially the combination
of thermal and mechanical history, are
inherently different from actual welding
conditions. According to the technolog-
ical strength theory (Refs. 5, 6), the duc-
tility of a material varies in a weld ther-
mal cycle. The temperature at which a
critical level of strain is applied on a ma-
terial during weldability testing may be
different from that under actual welding
conditions. This difference may result in
disparate cracking behavior in the sim-
ulative test relative to actual practice.
The approach used to discern the ef-
fects of test conditions on the cracking
behavior relies on developing a physi-
cal link between weldability test results
and the metallurgical response of the
material during testing. The absence of
such a link in essentially all weldability
test techniques, however, has created
difficulties in standardizing the test pro-
cedures and resulted in poor repro-
ducibility and correlation. Discrepan-
cies between test results and field expe-
rience are not uncommon.
Despite these drawbacks, weldabil-
ity testing is generally perceived as an
efficient and economical method for
predicting susceptibility to liquation-re-
lated cracking during welding. Among
the weldability testing techniques, the
longitudinal-Varestraint (mini-Vare-
straint), spot-Varestraint and hot-ductil-
ity tests are three of a few methods that
can be utilized in quantifying the HAZ
liquation cracking susceptibility or de-
veloping a fundamental understanding
of the cracking phenomena. Despite
their widespread use, there has been lit-
tle effort to correlate the data generated
by these tests or to rigorously apply these
data to real-world situations.
136-s I APRIL 1993
3. Longitudinal-Varestraint test
The original Varestraint test was de-
veloped by Savage, etal. (Refs. 7, 8), at
Rensselaer Polytechnic Institute in the
mid-60s, and soon became one of the
most widely utilized weldability testing
techniques for quantifying the suscepti-
bility of a material to weld solidification
cracking. Since that time, three modi-
fied versions have been developed
based on the original Varestraint con-
cept, namely, the mini-Varestraint (or
subscale Varestraint) test, the spot-Vare-
straint test (originally called the Tigama-
jig test) (Ref. 9), and the Transvarestraint
test (Ref. 10). The mini-Varestraint test
uses a smaller test sample, nominally
163 X 25 X 6.4 mm (6.5 X 1 X 0.25 in.)
as compared with the original Vare-
straint test, nominally 300 X 50 X 12.7
mm (1 2 X 2 X 0.5 in.). In order to avoid
confusion with the spot-Varestraint and
Transvarestraint tests, the mini-Vare-
straint (or subscale Varestraint) test is
called the longitudinal-Varestraint test
in this report. Although this test is uti-
lized primarily for characterizing weld
solidification cracking, it has also been
used to determine HAZ liquation crack-
ing susceptibility (Refs. 11-15).
A schematic of the longitudinal-Vare-
straint test is shown in Fig. 1. A speci-
men is supported as a cantilever beam
and a gas tungsten arc weld (GTAW) is
produced along the center section of the
specimen. When the arc approaches the
center of a radiused die block (marked
A in Fig. 1), a pneumatically operated
ram is triggered forcing the specimen to
conform to the surface of the die block.
Meanwhile, the arc travels onward and
is subsequently interrupted in the run-
off area C. Two auxiliary bending bars
are added in order to ensure that the
specimen conforms to the contour of the
die block. The applied augmented strain
(e) of the top surface of the specimen can
be varied by adjusting the radius of the
die block (R) following the equation, e
= t / (2R + t), where t is the specimen
thickness. In this manner, both weld so-
lidification cracks and HAZ liquation
cracks can be produced. The HAZ li-
quation cracks are normally located ad-
jacent and perpendicular to the fusion
boundary.
Cracking susceptibility is assessed by
measuring the length of each crack on
the as-tested specimen surface. The
threshold strain (Appendix B) to cause
cracking and the degree of cracking at
a specific strain level have been gener-
ally utilized as cracking indexes (Refs.
11 -1 5). The degree of cracking can be
quantified by the maximum crack length
(MCL), the total crack length (TCL) or
the cracked HAZ length (CHL) (see Ap-
pendix B for definition of terms).
Table 1 — Criteria for Interpreting Hot-Ductility Test Results for HAZ Cracking Assessments
Criterion
Classification of hot ductility
curves
Incorporation of the extent of
ductility and strength
recovery
Nil-ductility temperature range
between the NST and DRT
The extent of the nil-ductility
region and the amount and
rate of ductility recovery
on-cooling
The zero ductility range and
mid-temperature ductility dip
range
The temperature range
between the NDT and DRT
The ratio of ductility recovery
(RDR), ductility recovery rate
(DRR) and nil-ductility
temperature range (NDR)
Authors,
(Refs.)
Nippes, ef al. (25, 26)
Williams (27), Kreischer
(28), Weiss, ef al. (29)
Williams (27), Dahl, et al.
(30, 31), Donati, ef al. (11)
Duvall, ef al. (32-33)
Yeniscavich (34, 35)
Arata, ef al. (36)
Lundin, ef al. (14)
Year
1955
1963
1963
1966
1966
1977
1991
Spot-Varestraint Test
The spot-Varestraint test (Ref. 9) has
been widely applied for evaluating HAZ
liquation cracking susceptibility. A
schematic of the test apparatus is shown
in Fig. 2. During spot-Varestraint test-
ing, a GTA spot weld is produced in the
center section of a small specimen, nom-
inally 140 X 25 X 6.4 mm (5.5 X 1 X0.25
in.). After a predetermined weld time,
the arc is extinguished and the speci-
men is forced to conform to the surface
of a radiused die block. In this manner,
HAZ liquation cracks can be generated
on the surface of the specimen adjacent
to the GTA spot weld. The applied aug-
mented strain (e) of the top surface of
the specimen is approximated in the
same manner as for the longitudinal-
Varestraint test.
Cracking susceptibility is determined
by measuring the length of each crack
on the as-tested specimen surface. The
threshold level of strain to cause crack-
ing or the degree of cracking (quantified
by MCL or TCL) over a range of strain
levels have been generally accepted as
cracking indexes since the introduction
of this test (Refs. 9, 16-23).
Hot-Ductility Test
The concept in the design of the hot-
ductility test is different from the major-
ity of weldability testing techniques. In-
stead of quantifying the cracking sus-
ceptibility by the degree of cracking, it
characterizes the ductility of the mate-
rial at elevated temperatures and relates
this ductility data to cracking suscepti-
bility. Basically, small tensile samples
are fractured rapidly at some specific
temperatures during either the on-heat-
ing or on-cooling portion of a duplicated
weld thermal cycle in a thermomechan-
ical simulator called a Gleeble™. The
transverse reduction-in-area of the frac-
tured sample is subsequently deter-
mined providing a measure of ductility.
s
ro
q>
Q.
E
d>
1-
thermal cycle
A^von-cooling
Jpon-heating
Time
re
CD
<
c
c
o
13
-o
CD
CC
hot ductility curve
^ ^or
"•^on-cooling
DRTN
i-heating
DTNSTTL
Temperature
Fig. 3 — Schematic illustration of the hot-ductility test.
WELDING RESEARCH SUPPLEMENT I 137-s
4. 300
O.
2 200
3
CD
Q.
E
CD
100
N S T - D R T NST
903 909
(A)
2.0
E 1.6
E
§ 1.2
_ i
-3
ro
" 0 . 8
E
rj
E
x
•§ 0.4
0.0
MCL
300
2
|5
"ro
S3
o_
E
CD
200
100
T L - N D T
903 909
(B)
903 909
(C)
Fig. 4 — Comparison of test results for Incoloy Alloys 903 and 909 from the spot-Varestraint
and hot-ductility tests; A — the temperature range between the NST and Df?7"v57 obtained
from the hot-ductility test; B — the maximum crack length obtained from the spot-Varestraint
test; C — the temperature range between the TL and NDT obtained from the hot-ductility test
(Ref. 37).
Both the on-heating and on-cooling duc-
tility curve in the vicinity of the solidus
temperature can be obtained, as shown
in Fig. 3, and the nil-ductility tempera-
ture ( N D T ) , nil-strength temperature
(NST) and d u c t i l i t y recovery tempera-
ture (DRT) determined (see Appendix B
for d e f i n i t i o n of terms). In a d d i t i o n to
the hot ductility, the hot strength of the
material can also be measured.
In the past, experimental methodolo-
gies and data interpretation for hot-duc-
tility testing have been the subject of
considerable investigation. A review by
Lin (Ref. 24) indicated that the methods
for interpreting hot-ductility test results
for H A Z cracking assessments vary sig-
nificantly from investigator to investiga-
tor. Table 1 lists the several criteria that
have been proposed to date. A m o n g
Table 2 — Chemical Compositions of A-286
and Type 310 Stainless Steel Investigated in
This Study (wt-%)
Element A-286 Type 310
c
Mn
P
S
B
Si
i
Cr
Mo
Cu
Al
Ti
V
Fe
0.054
0.19
0.016
0.009
0.006
0.25
24.22
14.58
1.32
0.10
0.34
2.29
0.22
bal.
0.083
1.42
0.024
0.004
Not Analyzed
0.46
18.72
24.75
0.27
0.32
0.062
0.014
0.054
bal.
these criteria, the extent of the nil-duc-
tility region and the a m o u n t and rate of
ductility recovery (Refs. 32, 33), and the
nil-ductility temperature range between
the NST and DRT (Refs. 1 1 , 27, 30, 31)
are the most widely accepted.
The hot-ductility and spot-Varestraint
tests are n o r m a l l y considered c o m p l e -
mentary in q u a n t i f y i n g H A Z liquation
cracking susceptibility and yield q u a l i -
tatively consistent results. A previous in-
vestigation (Ref. 37), however, showed
that these t w o tests were inconsistent in
predicting the H A Z liquation c r a c k i n g
susceptibility of Incoloy® Alloys 903 and
9 0 9 , w h e n " c o n v e n t i o n a l " techniques
w e r e used to interpret test results. Fig-
ure 4 shows that the MCLs of Incoloy A l -
loys 903 and 909 as obtained from the
spot-Varestraint test (Fig. 4B) were con-
tradictory to the on-cooling nil-ductility
temperature range (NST-DRTN S T ) (see
appendix for symbols and abbreviations)
as obtained from the hot-ductility test —
Fig. 4A. H o w e v e r , the M C L correlated
very well w i t h the on-heating nil-ductil-
ity temperature range (TL -NDT) — Fig.
Table 3 — Conditions for Hot-Ductility
Testing of A-286 and Type 310 Stainless
Steels
Heating time:12.15 s
Holding time at peak temperature:0.03 s
Cooling rate: 50:
C/s (90 = F/s)
Holding time at test temperature:0.03 s
Stroke rate: 5 cm/sec (2 in/s)
Sample freespan:25 mm (1 in.)
Atmosphere: argon
4. These results stimulated a research
program to fundamentally evaluate the
h o t - d u c t i l i t y , spot- and l o n g i t u d i n a l -
Varestraint tests.
Objectives
The principal objectives of this study
were as follows:
1) Study the physical relationship
among weldability test results, cracking
theories and material properties.
2) D e v e l o p a generic m e t h o d o l o g y
and define a material-specific parame-
ter, based on the hot-ductility, longitu-
dinal- and spot-Varestraint test results,
that quantifies H A Z liquation cracking
susceptibility.
3) Investigate the correlations among
these three techniques.
4) Re-evaluate the current m e t h o d -
ologies for interpretation of the three
tests in the light of the n e w m e t h o d o l -
ogy w h i c h is proposed.
E x p e r i m e n t a l D e s i g n
Materials
A - 2 8 6 and Type 31 0 stainless steels
were investigated in this study. A-286 is
a precipitation-hardened iron-base alloy
designed for applications requiring
moderately high strength to 7 0 0 ° C
(1292°F) and o x i d a t i o n resistance to
about 8 1 5 ° C (1499°F). The excellent
r o o m and elevated temperature
strengths exhibited by this alloy result
from the presence of N i , Ti and Al, w h i c h
p r o m o t e f o r m a t i o n of the Y Ni3 (AI,Ti)
strengthening phase. This alloy is often
used for jet engine and gas turbine ap-
plications due to its highly desirable
combination of properties.
Extensive studies in the past have
s h o w n this alloy to be susceptible to
both w e l d solidification and H A Z liqua-
tion cracking (Refs. 3 8 - 4 1 ) . Vagi, et al.
(Ref. 40), associated H A Z l i q u a t i o n
c r a c k i n g w i t h the f o r m a t i o n of a Fe2 Ti
Laves phase. They proposed that grain
boundary liquation by the Fe-Fe2Ti e u -
tectic ( 1 3 1 0 ° C ; 2390°F) allows the
Table 4 — Conditions for
Longitudinal-Varestraint Testing of A-286
Stainless Steels
Current:190 A
Voltage:12 V, DCEN
Travel speed: 2.54 mm/s
Augmented strain: 0.5-7%
Shielding gas: Argon, 30 CFH
Electrode: W-2%ThO.>, 2.4 mm (%2 in.)
diameter., 60-deg included angle
Air Pressure: 0.55 MPa (80 psi)
Strain rate: approximately 13%/s
Weld bead width: 7.5 mm
1 3 8 - s I APRIL 1 9 9 3
5. grains to be separated by thermally in-
duced strain. Blum, ef al. (Ref. 38),
agreed with Vagi, ef al., but they also
proposed that grain boundary precipita-
tion of a continuous film of TiC and in-
tragranular precipitation of y" inhibits
deformation during cooling, which
causes base metal cracks to propagate
and relieve the weld stresses. Later works
by Brooks (Ref. 41) indicated that the
loss of hot ductility above 1150°C
(2102°F) was attributed to the presence
of boron. He suggested that the consti-
tutional liquation of borides caused
grain boundary liquation and resulted
in cracking.
Type 310 is a fully austenitic stain-
less steel developed for applications re-
quiring high corrosion resistance. Due
to the fully austenitic nature of the reso-
lidified weld metal, this alloy suffers
from weld solidification cracking as well
as HAZ liquation cracking (Refs. 20,
42-46). Comparing the HAZ liquation
cracking susceptibility of this alloy with
other austenitic stainless steels, Kujan-
paa, etal. (Ref. 20), and Morishige, ef
al. (Ref. 42), indicated that Type 310 is
more susceptible than Types 316, 347,
321, 304 and 309. A fundamental inves-
tigation of the HAZ liquation cracking
mechanism of this alloy by Tamura, ef
al. (Ref. 46), suggested that Cr and Ni in
the solute-rich zones in the matrix were
swept up and assimilated into the mi-
grating grain boundaries during weld
thermal cycling. A subsequent eutectic
reaction involving Cr and Ni at the grain
boundaries caused a depression in the
effective solidus.
The chemical compositions of A-286
and Type 310 stainless steels investi-
gated in this study are listed in Table 2.
Both materials were in the form of 6.5-
mm (0.25-in.) thick plate. A-286 exhib-
ited a recrystallized austenitic structure
with a grain size of ASTM No. 9 and con-
tained a bimodal distribution of titanium
carbides and/or carbonitrides. Type 310
was fully austenitic with a grain size of
ASTM No. 6. Note that the nickel con-
tent of Type 31 0 is slightly lower than
the specification limits of 1 9 to 22%.
Both alloys exhibited relatively low lev-
els of impurities, particularly with re-
spect to sulfur and phosphorus contents.
Hot-Ductility Testing
Hot-ductility tests were performed
under an argon atmosphere using a
Gleeble™ 1000 system. Standard speci-
mens 6.35 mm in diameter and 1 00 mm
long (0.25 X 4 in.) were machined from
the plate. A specimen freespan (jaw
spacing) of 25 mm (1 in.) was used
throughout the investigation. The NST
was determined by heating samples at
a rate of 111 °C/s (200°F/s) under a static
Fig. 5 — Experimental setup for the spot-Varestraint test.
load sufficient to overcome the frictional
force of the fixture, approximately 10 kg
(22 Ib). On-heating tests were conducted
by heating samples to the peak temper-
ature in 12.15 s and pulling them to fail-
ure at a rate of 5 cm/s (2 in./s). The on-
heating time to peak temperature was
based on the NST test. On-cooling tests
were performed after heating to the NST
in 12.15 s and cooling to the desired
temperature at 50°C/s (90°F/s). This
cooling rate was the maximum achiev-
able with the materials and specimen
freespan utilized without externally as-
sisted cooling. On-cooling test samples
were also pulled to failure at 5 cm/s. This
rapid stroke rate was selected to mini-
mize the change in specimen tempera-
ture during fracture. Sample ductility, in
terms of reduction in area, was subse-
quently measured using a vernier
caliper. The conditions for hot ductility
testing are summarized in Table 3.
Longitudinal-Varestraint Testing
Longitudinal-Varestraint tests were
performed only on A-286 stainless steel
at strains ranging from 0.5 to 7%. Three
samples were tested at each strain level
on a subscale Varestraint test unit using
specimens with dimensions of 1 63 X 25
X 6.35 mm (6.5 X 1 X 0.25 in). Two aux-
iliary bending bars were located on each
side of the sample to ensure that the
specimen fully conformed to the surface
of the die block during testing. The con-
ditions for longitudinal-Varestraint test-
ing are listed in Table 4. A rapid strain
rate ( approximately 13%/s) was selected
to minimize the change in specimen
temperature in the HAZ during bending.
A 7.5-mm (0.3-in.) weld bead width was
obtained with these welding parameters.
A binocular microscope with 40X
magnification was utilized to identify
the locations of each crack tip relative
specimen
thermocouple wires
1/16" Hole
Fig. 6 — Schematic illustration of the setup for temperature measurement.
WELDING RESEARCH SUPPLEMENT I 139-s
6. Table 5 — Conditions for Spot-Varestraint Testing of A-286 and Type 310 Stainless Steels
Weld time
Current
Voltage
Weld diameter
Shielding gas
Air pressure
Strain rate
Augmented strain
Cooling time
Electrode
A-286
35 s
96 A
16 V
11.5 mm
Argon, 20 ft3
/h
0.55 MPa (80 lb/in.2
)
approximately 13%/s
0.5-5%
0-4.5 s
W-2%Th02 , 2.4 mm ( & in.
Type 310
35 s
110 A
12 V
12 mm
Argon, 20 ft3
/h
0.55 MPa (80 lb/in.2
)
approximately 13%/s
1-7%
0-0.45 s
diameter, 60-deg included angle
Table 6 — Hot-Ductility Test Results of
A-286 and Type 310 Stainless Steels
A-286 Type 310
Tl(a)
NDT
NST
DRTNsT
TL-NDT
NST-DRTNST
1422°C
1200°C
1350°C
1050°C
222°C
300 °C
1386°C
1325°C
1350°C
1325°C
61°C
25°C
(a) TL was determined as the peak temperature experienced at
the fusion boundary during spot-Varestraint testing.
to the interception of the instantaneous
solid/liquid interface and the fusion
boundary. These crack tip locations and
the fusion boundary circumscribed a
cracked HAZ region. The maximum
width of the cracked HAZ was designated
as the maximum crack length (MCL),
which is the distance between the crack
tip of the longest crack and the fusion
boundary projecting in a direction per-
pendicular to the fusion boundary.
Spot-Varestraint Testing
Spot-Varestraint tests were performed
on a Tigamajig-type test unit (Ref. 9)
using specimens with dimensions of 140
X 25 X 6.35 mm (5.5 X 1 X 0.25 in.).
Slots (rather than holes) at both ends of
the sample allowed samples to be accu-
rately located and fixtured, and also
minimized any axial tensile force dur-
ing specimen bending. The conditions
for spot-Varestraint testing are listed in
Table 5. The criterion for determining
the welding parameters was to obtain a
cooling rate that was comparable with
that used during on-cooling hot-ductil-
ity testing. For the parameters selected,
the average cooling rate from 1 350° to
1200°C was about 84°C/s (1 51 °F/s) for
A-286 and 11 2°C/s (202°F/s) for Type
310. The average cooling rate over a
wider temperature range, from 1 350° to
1 000°C, was about 60°C/s (1 08°F/s) for
A-286 and 70°C/s (126°F/s) for Type
31 0. A rapid strain rate (approximately
13%/s) was also selected to minimize
the change in specimen temperature
during bending.
The spot-Varestraint tests were con-
ducted in two stages. The first set of tests,
called the on-heating spot-Varestraint
tests, was aimed at determining the
cracking behavior of the material on
weld heating. This was achieved by per-
forming the tests with no cooling time
(see Appendix B for definition). Thus,
the HAZ was on-heating when it was
straining. The on-heating spot-Vare-
straint tests were performed from 0.5 to
7% augmented strain with three sam-
ples for each strain level. The second set
of spot-Varestraint experiments, called
the on-cooling spot-Varestraint tests,
was designed to investigate the crack-
ing behavior of the material on weld
cooling. This was accomplished by per-
forming the tests above the saturated
strain level (see Appendix B for defini-
tion) with variable cooling times. The
cooling time was varied by adjusting the
time period between arc extinction and
sample bending. Based on the cracking
behaviors of these two alloys, cooling
times ranging from 0 to 4.5 s were uti-
lized for A-286 and from 0 to 0.45 s for
Type 310.
Because cooling time is a critical pa-
rameter in this test, it was precisely cal-
ibrated and monitored throughout the
test. The actual cooling time is the pe-
On-Heating
CSR
Jffi^WjSl;^
On-Cooling
CSR
E'
N S T •NDT
D R TNST
I
/
Fig. 7 — Theoretical hypothesis of the thermal crack-susceptible region.
riod between the instant at which the
welding current drops to essentially zero
and the time at which the die block con-
tacts the specimen. A special setup was
devised to precisely monitor the actual
cooling time.
It is also important to point out that
for Type 310, the weld pool became ir-
regular for weld times longer than about
20 s. In order to produce a uniform cir-
cular weld pool, an electromagnetic coil
was custom-built and attached to the
weld torch as shown in Fig. 5. The size
of the coil is 25 mm in height with 35-
mm ID and 50-mm OD (1 in. H X 1.375
in. ID X 2 in. OD). There were 280 turns
of 1 9-gauge wire in this coil. By ener-
gizing this coil with 4.0 A of alternating
current, the weld pool could be forced
to rotate, resulting in a symmetrical, cir-
cular pool shape.
Quantitative cracking data were ob-
tained from as-tested samples by mea-
suring the length of the longest crack be-
tween the fusion boundary and crack tip
projecting in a direction perpendicular
to the fusion boundary using a binocu-
lar microscope under 40X magnifica-
tion. Thus, the maximum crack length
(MCL) reported here represents the dis-
tance between the isotherms at the crack
tip and the fusion boundary, rather than
the actual length of the observed crack.
Thermal Cycle Measurement
The thermal cycles experienced dur-
ing both the spot- and longitudinal-Vare-
straint testing were measured using fine
wire S-type (Pt - Pt 1 0%Rh, 0.2 mm in
diameter) and K-type (Chromel and
Alumel, 0.25 mm in diameter) thermo-
couples. K-type thermocouples were uti-
lized only to measure the thermal cycles
with a peak temperature below 1 350°C.
These thermocouples were percussion
welded at the bottom of 1.6 mm (% in.)
holes, which were drilled from the bot-
tom of specimens to within about 0.3
mm from the surface on which the weld
was placed, as shown in Fig. 6. The tem-
perature was recorded using a Labtech
Notebook software package (Ref. 47) at
140-s I APRIL 1993
7. a sampling rate of 20 Hz on an IBM 386
compatible personal computer. Under
these conditions, the thermal cycles at
different locations from the fusion
boundary into the HAZ were obtained.
The peak temperatures and cooling rates
were determined and temperature gra-
dients approximated.
Metallurgical Characterization
Representative longitudinal- and
spot-Varestraint test specimens were
metallographically prepared by grind-
ing about 0.2 mm (0.008 in.) of mate-
rial from the top surface and then pol-
ishing through 0.05-micron alumina.
Hot-ductility specimens were ground to
the center section of the sample and then
polished through 0.05-micron alumina.
Both A-286 and Type 310 stainless steels
were etched with a mixed acid solution
comprised of equal parts of concentrated
nitric, hydrochloric and acetic acids. Mi-
crostructures were characterized using
an optical microscope at magnifications
upto 1000X.
Development of the
Crack-Susceptible Region
Theoretical Hypothesis of the Thermal
Crack-Susceptible Region
Metallurgically, HAZ liquation
cracking is associated with the occur-
rence of grain boundary liquation. In the
past, most efforts in studying HAZ liqua-
tion cracking mechanisms have been di-
rected toward characterizing the evolu-
tion and distribution of liquid in the
HAZ. However, the mere presence of
liquid films at grain boundaries is not
sufficient to induce a liquation crack. In
order to cause cracking, it is essential
that the crack-susceptible microstruc-
ture be subjected to a sufficient tensile
strain (or stress). During welding, the
tensile strain (or stress) does not gener-
ally develop until the weld begins to
cool (Ref. 48). As a result, liquation
cracking occurs during the solidification
of the liquid films. The cooling cycle of
the liquid films in the HAZ is similar to
the final stages of weld solidification, al-
though the origin of the liquid films and
the microstructural boundaries may be
different from those present in the weld
metal. Consequently, to a first approxi-
mation, the criteria that govern weld so-
lidification cracking can be adopted to
explain the solidification of liquid and
resultant cracking in the HAZ.
Many mechanisms have been pro-
posed to describe weld solidification
cracking. Among these, the shrinkage-
brittleness theory (Refs. 49-51), the
strain theory (Refs. 52-54), the general-
ized theory (Refs. 55-58), and the tech-
100
80
•£
3 60
<c
§ 40
T3
Z3
1rr 20
0
900
100
80
5
3^TO
£ 60
<c
c
1 40
D
73
CD
cr 2 0
0
• o.^--"
.
.
-
-
1200
• a A
-9 f l R
On-Heating
D
t
In
1
I
On-Cooling n
l
• ^ ^ f r o m the NST 1
* I NST
L !1000 1100 1200 1300 1400
Temperature (C)
(A) A-286
* - Tvp"?1f t
- — " — s . TO D
On-Cooling X n
from the NST On-Heating
1
1 1
A
Xr
o 1
I
i
p
or
u
1 N S T
L 11250 1300 1350 1400
Temperature (C)
(B) Type 310
Fig. 8 — Hot-ductility behavior of A-286 and Type 310 stainless steels.
nological strength theory (Refs. 5, 6) are
the best known. Although these theories
differ in their approach to cracking
mechanistics, there is general agreement
that cracking occurs in a discrete tem-
perature envelope called the brittle tem-
perature range (BTR) (see Appendix B
for definition). Metallurgically, the BTR
describes a range between the tempera-
ture where liquid is confined within the
solidification structure to that where the
boundary liquid is partially or com-
pletely solidified and the material recov-
ers its ductility. Mechanically, the BTR
represents the regime over which the
ductility of the material is essentially
zero and, thus, susceptible to cracking.
The ductility of the material during a
weld thermal cycle can be determined
Table 7 — Pertinent Longitudinal-Varestraint
Test Results of A-286
MCL (at saturated
strain = 3%)
CHLOC.NST
CHLoc.TL
CT
CRT at NST from
NST over
CHLOC.NST.
(E-E' in Fig. 13)
CRT at TL from TL
over CHLoc TL,
(A-A' in Fig. 13)
A-286
0.80 mm
1 1.5 mm
14.5 mm
286°C/mm
66°C/s
69°C/s
WELDING RESEARCH SUPPLEMENT I 141-s
8. q
(LULU)
romthefusionboundry
pp
cnOD
g.
(0
0 0.2
"o
9?o
1 00
b •"
j
0 -5
Distance along the fusion
A-286 stainless steel
/ ^ " / — 3%, 5% and 7%
/ / N . NcV-2%
Y
0 5 10 15 20
boundary from the instantaneous weld enter (mm)
F/g. 9 — The locus of crack tips in the cracked HAZ region for A-286 at different strain levels
obtained from the longitudinal-Varestraint test.
using the hot-ductility test. According
to this test (Fig. 3), a material loses all
ductility when the temperature reaches
the NDT on heating and recovers duc-
tility at the DRT on cooling. The hot-
ductility test results indicate that there
are two temperature ranges within
which the material exhibits negligible
ductility. These are the on-heating nil-
ductility temperature range, which is the
temperature regime between the NDT
and TL, and the on-cooling nil-ductility
temperature range, which is the temper-
ature range between a peak temperature
(TP) and the corresponding DRT. While
the on-heating nil-ductility temperature
range is constant, the on-cooling nil-
ductility temperature range is a function
of the peak temperature. Results from a
previous study (Ref. 37) showed that dif-
ferent peak temperatures resulted in a
variation in the corresponding DRT. In
general, as the peak temperature is in-
creased above the NDT, the DRT de-
creases, resulting in a net increase in the
on-cooling nil-ductility temperature
range. From a physical sense, different
peak temperatures for the on-cool ing test
represent different locations in the HAZ.
Thus, a peak temperature equal to the
1.0
&
03
•o
c
!3
o
JQ
c
o
'cn
13
E
o
0.8
0.6
Tr. 0.4
•8
o
CD
O
c
ro
0.2
to 0.0
5% augmented strain
A-286 stainless steel
On-Cooling
CSR
On-Heating
CSR
1 0 - 5 0 5 10 15 20
Distance along the fusion boundary from the instantaneous weld center (mm)
Fig. 10— The crack-susceptible region (CSR) of A-286 obtained from the longitudinal-Vare-
straint test. Symbols represent crack tips in both sides of three individual samples, with open
and solid from alternate sides of the same sample.
liquidus (TL) would represent a point at
the weld fusion boundary, while a peak
temperature equal to the NST would rep-
resent a point in the HAZ which experi-
ences a thermal cycle with a peak tem-
perature equal to the NST. Farther away
from the fusion boundary, the peak tem-
perature decreases rapidly and the cor-
responding DRT increases.
Based on this discussion, it follows
that a nil-ductility region (NDR) (see Ap-
pendix B for definition) in the HAZ could
be constructed on a temperature field
surrounding the weld pool, as illustrated
in Fig. 7. Assuming that the weld is pro-
gressing from right to left at an instant
with the weld center located at point O,
the ellipse HDAG represents the instan-
taneous solid/liquid interface of the weld
pool at a temperature equal to the alloy
liquidus. The dashed lines represent the
isotherms of different temperatures. The
fusion boundary is represented by AA'.
Point A represents the instantaneous liq-
uidus temperature. Point B represents
the point at which the thermal cycle ex-
periences a peak temperature equal to
the NDT. CB represents the isotherm of
the NDT. Temperatures along the line
AB, the transition between on-heating
and on-cooling, would then represent
various peak temperatures used to de-
termine on-cooling ductility. For each
set of the on-cooling hot-ductility tests,
a DRT can be determined that is specific
to a given peak temperature along AB.
This DRT can then be located at the in-
tersection of the DRT isotherm and a line
from the point of the peak temperature
parallel to the fusion boundary toward
the cooling direction, because the DRT
and the peak temperature are in the
same thermal cycle. For example, Point
E and E' are in the same thermal cycle
with a peak temperature equal to the
NST. This thermal cycle achieves its
peak temperature at point E and falls off
along line EE' reaching the DRTNST
isotherm at point E'. Based on the on-
cooling hot ductility data, line EE' rep-
resents a regime in which the material
exhibits negligible ductility. A similar
process can be used to determine the
entire DRT curve BA', as shown in Fig.
7. Thus, the thermal envelope of the
NDR is defined by the NDT isotherm,
line CB, and the various DRTs, line BA',
for the on-heating and on-cooling be-
havior, respectively. This NDR repre-
sents an area in which the material ex-
hibits negligible ductility. According to
the criterion assumed in the develop-
ment of the liquation cracking mecha-
nisms, which states that cracking results
from the localized loss of ductility, this
NDR should be equivalent to an area in
the HAZ that is susceptible to liquation
cracking. By definition, it is the thermal
CSR (Appendix B).
142-s I APRIL 1993
9. Hot ductility test data are not suffi-
cient, however, to absolutely define the
entire thermal CSR in Fig. 7. Since on-
cooling hot ductility tests are very diffi-
cult to perform using peak temperatures
above the NST, the value for the DRT's
between point E' and A' in Fig. 7 can-
not be obtained using the conventional
hot-ductility test.
Hot-Ductility Test Results
In this study, A-286 and Type 310
stainless steels were investigated to ver-
ify the proposed hypothesis. The on-
heating and on-cooling hot ductility
curves for the two alloys are presented
in Fig. 8. The NST for both alloys was
approximately 1350°C (2462°F). The
on-heating ductility of the A-286 de-
creased rapidly above 11 50°C (21 02°F)
and approached zero at 1200°C
(2192°F). On-cooling from the NST, the
ductility of this alloy did not recover sig-
nificantly until it had been cooled to
below 1050°C (1922°F). Thus, for A-
286, the NDT is 1200°C and the DRTNST
is 1050°C. Type 310 stainless steel ex-
hibited similar on-heating ductility be-
havior with a NDT of 1 325°C (241 7°F).
However, ductility recovery was much
more rapid as evidenced by a DRTNST
of 1325°C (241 7°F). The hot-ductility
results (Table 6) indicate that the on-
heating nil-ductility temperature ranges
(TL - NDT) for A-286 and Type 31 0 are
222° and 61 °C (400° and 11 0°F), and
the BTR at a point that experiences a
peak temperature equal to the NST (NST
- DRTNST) are 300° and 25°C (540° and
45°F), respectively.
Experimental Verification of the
Thermal Crack-Susceptible Region
The thermal CSR is material-specific
and is inherent to the HAZ surrounding
weld pools made with any of the con-
ventional fusion welding processes. This
region can be revealed by applying a
sufficient tensile strain on a material,
while a fusion welding process is occur-
ring. This can be effectively achieved
using the spot- and longitudinal-Vare-
straint tests.
Longitudinal-Varestraint Test Results
The longitudinal-Varestraint tests
were performed only on A-286, with
augmented strain levels ranging from 0.5
to 7%. The locations of each crack tip
in the HAZ of the as-tested specimen
surface were identified relative to the in-
terception of the instantaneous solid/liq-
uid interface and the fusion boundary.
The profile of these crack tips and the
fusion boundary circumscribed a
cracked HAZ region. It was found that
1.0
E 0.8
E
0.6
4g
o
CO
6 0.4
E
E
'ro 0.2
2
0.0
A-286 stainless steel
4 -i
2 4
Augmented Strain (%)
Fig. 11 — The maximum crack length at different augmented strain levels for A-286 obtained
from the longitudinal-Varestraint test.
the size of the cracked HAZ region ex-
panded for the strain level ranging from
0.5 to 3% as shown in Fig. 9. Above a
saturated strain level of 3%, the size and
shape of this cracked HAZ region is es-
sentially constant. This saturated
cracked HAZ region was previously de-
fined as a crack-susceptible region
(CSR). As shown in Fig. 10, the weld pool
progressed from right to left. The CSR
expanded on weld heating and shrank
upon cooling. The maximum width of
the CSR occurs at the transition between
the on-heating and on-cooling regions.
The maximum widths of the cracked
HAZ region at different strain levels, as
defined by the maximum HAZ crack
length (MCL), are shown in Fig. 11. The
MCL increased as augmented strain in-
creased from 0.5% up to 3%, with a
threshold strain of about 0.5%. Above
3% strain the MCL was essentially con-
stant at 0.80 mm (0.03 in.) from the fu-
sion boundary.
Development of the Thermal CSR Based on
the Longitudinal-Varestraint Test Results
The size of the CSR shown in Fig. 10
depends on the material tested and the
welding parameters employed during
testing. In order to directly compare the
CSR among different materials, the weld-
ing process variables must be isolated
from the material factor. One way to
achieve this is to normalize the test re-
sults with respect to the thermal condi-
tions the HAZ experienced during test-
140d
1200
§1000
CD
emperatu
CF>OO
OO
OO
| 400
Q_
200
n
i^__^ Longitudinal-Varestraint Test
'^"i>j-a_^ rn A-286 stainless steel
N53
—Sin •
Temperature Gradient = 286°C/mm
0.0 0.2 0.4 0.6 0.8 1.0 1.2 1.4 1.6 1.8 2.0
Distance from the fusion boundary (mm)
Fig. 12 — Peak temperatures of weld thermal cycles at different locations in the HAZ during
longitudinal-Varestraint testing.
WELDING RESEARCH SUPPLEMENT I 143-s
10. N
<
2
:5
to
a>
a_
E
CD
Temperature at crack tip
On-Heatin
thermal CSR
Fig. 13 — Schematic illustration of thermal CSR obtained from the longitudinal-Varestraint
test.
ing. This, in fact, provides a material-
specific parameter, termed the thermal
CSR, which uniquely describes the CSR
in terms of temperature.
The thermal conditions of the HAZ
during testing of A-286 were obtained
using implanted thermocouple wires.
The peak temperatures at different loca-
tions in the HAZ are shown in Fig. 1 2.
The approximate temperature gradient
in the region immediately adjacent to
the fusion boundary was 286°C/mm
(515°F/0.04 in.).
In conjunction with the thermal cycle
data, the spatial CSR (Fig. 10) can be
translated into the thermal CSR as illus-
trated in Fig. 1 3. The weld is progress-
ing from right to left at an instant when
the solid/liquid interface intercepts the
fusion boundary at point A. Point A thus
represents the instantaneous liquidus
temperature (TL). The temperature at the
fusion boundary after the weld pool has
passed is represented by AA'. Point B
represents the crack tip temperature at
the transition between on-heating (left
of AB) and on-cooling regions (right of
AB). The temperature at Point B (TB) can
be derived by the equation:
TL - (MCL X GT) (1)
where, GT is the gradient of peak tem-
peratures during longitudinal-Vare-
straint testing. Temperatures along the
line AB would then represent various
peak temperatures (TP) the HAZ experi-
enced during testing. Note that in actual
welding fabrication, line AB would in-
cline to the fusion boundary toward
2.5
E
I-
c~
fj)
CD
_ l
Y
<>m
»_O
b"3
E
2 0
1 S
1 0
0.5
0.0
Spot-Varestraint Test
cooling time = 0 sec
A-286
Type 310
ja o-
2 3 4 5
Augmented Strain (%)
cooling direction. With a very narrow
peak temperature range from the liq-
uidus, as discussed in this study, this line
can be assumed to be perpendicular to
the fusion boundary. Line A"BA' repre-
sents the profile of crack tip tempera-
tures. The crack tip temperature (Ttip)
can be experimentally derived by the
following equation using a point along
line AB with the same distance from the
fusion boundary as a reference.
Ttip •
CHL
(CRT x
OH/OC /VT ) (2)
Fig. 14 — On-heating spot-Varestraint test results of A-286 and Type 310 showing the width of
the cracked HAZ at different augmented strain levels.
where, TP = the peak temperature of a
thermal cycle that the point of interest
experienced; C H L 0 H / O C = t n e
length
measured parallel to the fusion bound-
ary between the crack tip and the point
which experiences the peak tempera-
ture of the same thermal cycle. This
length is designated as C H L Q H for the
crack tip located in the on-heating por-
tion, and CHLQC f°r
the on-cooling por-
tion (Fig. 1 0); CRT = the average cool-
ing (or heating) rate over C H L o c (or
CHLQH); VT = welding speed during lon-
gitudinal-Varestraint testing.
For example, Point E and E' are in the
same thermal cycle with a peak temper-
ature equal to TE, as they are equidistant
from the fusion boundary. This thermal
cycle achieves its peak temperature at
point E and falls off along line EE'. Crack-
ing is observed within the area of
A"BE'A'A". Thus, C H L o c at point E is
represented by the length EE'. The time
required (tEE<) for the temperature to fall
from point E to point E' is the distance
between these two points (EE') divided
by the welding speed during testing (VT),
tEE' = EE' / VT. The temperature in the
thermal cycle reaches point E' (TE) at a
time period tEE> after it has achieved the
peak. Or, mathematically, TE. = TE -(CRT
X EE' / VT). CRT is the average cooling
rate from the peak temperature TE over
a time period of tEE*. Pertinent thermal
CSR data for A-286 obtained from the
longitudinal-Varestraint test are summa-
rized in Table 7.
Spot-Varestraint Test Results
The on-heating spot-Varestraint test
results for both A-286 and Type 310 al-
loys are shown in Fig. 14. Because there
was no time for the HAZ to cool before
cracking occurred, the maximum HAZ
crack length (MCL) represented the
width of the cracked HAZ under a spe-
cific strain level when the HAZ was at
peak temperature. For Type 31 0 stain-
less steel, above a threshold strain level
of 1 %, the MCL increased as augmented
strain increased up to 3%. Above 3%
strain, designated the saturated strain,
the MCL was essentially constant at 0.39
144-s I APRIL 1993
11. mm (0.01 5 in.) from the fusion bound-
ary.
A threshold strain could not be de-
termined for A-286, since significant
cracking was observed at the lowest
level of augmented strain (0.5%). MCL
increased slightly between 0.5% and
3.0% and was essentially constant above
3.0%. The maximum width of the
cracked HAZ for A-286, as defined by
the MCL in the saturated strain region,
was 1.93 mm (0.076 in.). Note that
above a saturated strain level, the width
of the cracked HAZ during weld heat-
ing is essentially constant. As defined
previously, the width of the cracked
HAZ at the saturated strain level repre-
sents the extent of the CSR during heat-
ing.
The on-cooling spot-Varestraint tests
were performed with a saturated strain
of 5% for both alloys to characterize the
extent of the CSR during weld cooling.
It is important to point out that at a longer
cooling time, cracks may propagate
across the fusion boundary into the fu-
sion zone. The portion of crack length
inside the fusion zone did not represent
the material behavior in the HAZ, thus,
was not taken into account in this study.
Results from the on-cooling tests in Fig.
1 5 show the on-cooling portion of the
CSR. Again, the MCLs represent the dis-
tance of crack tips from the fusion
boundary. Both alloys behaved in a sim-
ilar manner, in that the width of the CSR
shrank as cooling time increased. For A-
286, it disappeared after a cooling time
of 4.1 3 s, while for Type 310 this region
persisted for only 0.41 s.
Development of the Thermal CSR Based on
the Spot-Varestraint Test Results
The methodologies utilized to de-
velop the thermal CSR based on the spot-
Varestraint test results are basically the
same as those for the longitudinal-Vare-
straint test. The on-cooling thermal CSR
can be developed by combining the spa-
tial CSR (Fig. 1 5) and the thermal con-
ditions experienced in the HAZ during
testing. The thermal conditions in the
HAZ during testing were determined
using the implanted thermocouple tech-
nique, as described previously. The peak
temperatures of thermal cycles at differ-
ent locations in the HAZ are shown in
Fig. 16 with an approximate gradient of
101°C/mm (182°F/0.04 in.) for A-286
and 156°C/mm (281°F/0.04 in.) for Type
310. The peak temperature at the fusion
boundary was determined to be 1422°C
(2592°F) for A-286 and 1 386°C (2527°F)
for Type 310. These temperatures are
believed to approximate the liquidus
temperatures (TL) since these data are
very close to published melting ranges
(1370°-1430°C for A-286 and
3.0
Spot-Varestraint Test
augmented strain = 5%
On-Cooling CSR
of A-286
0.0 0.5 1.0 1.5 2.0 2.5 3.0 3.5 4.0 4.5 5.0
Cooling Time (sec)
Fig. 15 — On-cooling spot-Varestraint test results of A-286 and Type 310 showing the on-
cooling portion of the CSR.
1400°-1450°C for Type 310) (Ref. 59).
In conjunction with the thermal cycle
data in the HAZ, Fig. 1 5 can be trans-
lated to represent the on-cooling por-
tion of the thermal CSR, as schemati-
cally shown in Fig. 1 7. Point A repre-
sents the instantaneous liquidus temper-
ature (TL). Point B represents the crack
tip temperature determined with no
cooling time (tc = 0 s). The temperature
at Point B (TB) can be derived following
the equation:
fusion boundary (TFB) after arc extinc-
tion can be derived from the cooling
time (tc) following the equation:
TFB = T L - (CRT X tc) (4)
(MCL X GT (3)
where, GT is the gradient of peak tem-
peratures during spot-Varestraint test-
ing, and MCL is the maximum HAZ
crack length performed with no cooling
time (tc = 0). Temperatures along line
AB represent different peak temperatures
achieved in the HAZ. Since the cooling
time is equivalent to the period after
weld pool has passed in a continuous
weld. Line AA' would then represent var-
ious temperatures at the fusion bound-
ary after arc extinction. Point A' locates
the greatest cooling time in the spot-
Varestraint test above which cracks do
not propagate across the fusion bound-
ary into the HAZ. The temperature at the
where, CRT is the average cooling rate
at the fusion boundary over a period of
tc. Line BA' represents crack tip temper-
atures at various cooling times. These
crack tip temperatures (Ttip) can be de-
rived using a point along line AB with
the same distance from the fusion
boundary as a reference and following
the equation:
T
t i p - Tp • (t- X CRT) (5)
where, TP = the peak temperature of a
HAZ thermal cycle which the point of
interest experienced during spot-Vare-
straint testing; tc = the cooling time over
which cracking is observed at the point
of interest; CRT = the average cooling
rate of a thermal cycle with a peak tem-
perature of TP from the peak tempera-
ture over a time period of tc.
For example, Point E and E' are in the
same thermal cycle with a peak temper-
ature equal to TE, as they are equidistant
from the fusion boundary. Cracking at
Table 8 — Pertinent Thermal CSR Data Obtained from the Spot-Varestraint Test
MCL (tL = 0)
tc.NST
tc.TL
CT
CRT at NST from NST over tc NST,
(E-E' in Fig. 17)
CRT at TL from TL over tc TL,
(A-A' in Fig. 17)
A-286
1.93 mm
4.10 s
4.13 s
101°C/mm
68°C/s
94°C/s
Type 310
0.39 mm
0.20 s
0.41 s
156°C/mm
140°C/s
220°C/s
WELDING RESEARCH SUPPLEMENT I 145-s
12. 14001
1200
5-1000
temperature(
cnoo
oo
oo
f 400
CO
200
o
^ E
kfi-TXL__^,n
A
"286
~"~° .Type 310
-
Temperature Gradient
" A-286 = 101°C/mm
• Type 310= 156°C/mm
0.0 0.5 1.0 1.5 2.0 2.5 3.0
Distance from the fusion boundary (mm)
Fig. 16 — Peak temperatures of weld thermal cycles at different locations in the HAZ for A-
286 and Type 310 during spot-Varestraint testing.
point E is observed over a cooling time
period of tE-. Thus, the temperature in
the thermal cycle reaches point E' (TE0
at a time period tE< after it has achieved
the peak. Mathematically, TE -(CRT
X tE0, where, CRT is the average cool-
ing rate from TE over a period of tE>. Per-
tinent thermal CSR data for alloys A-286
and Type 31 0 obtained from the spot-
Varestraint test are summarized in Table
Discussion
Results from this study have indicated
that the HAZ thermal CSR of a material
can be determined using any of the three
tests. In the hot-ductility test, the HAZ
thermal CSR is circumscribed by the
NDT isotherm for the on-heating por-
tion, and the various DRTs for the on-
cooling portion — Fig. 7. In the longi-
tudinal-Varestraint test, the profile of the
crack tip temperatures in the HAZ for
the test performed with the saturated
strain determines the envelope of the
HAZ thermal CSR — Fig. 1 3. In the spot-
Varestraint test, the crack tip tempera-
ture of the on-heating tests performed
with the saturated strain determines the
transition temperature of the on-heating
thermal CSR, and the various crack tip
temperatures of the on-cooling tests per-
formed with the saturated strain enclose
the on-cooling thermal CSR — Fig. 1 7.
The correlation and the methodology of
data interpretation of the three tests can
be illustrated by characterizing the duc-
tility of the material in the thermal CSR
obtained from the longitudinal- and
Temperatures at crack tip
On-Cooling thermal CSR
A A'
Temperature at the fusion boundary after arc extinction
(Translated from cooling time)
spot-Varestraint tests and comparing the
extent of the HAZ thermal CSR obtained
from the three methods.
Characterization of the Ductility of
Material in the Thermal CSR Obtained from
Longitudinal- and Spot-Varestraint Tests
One of the important criteria as-
sumed in the development of liquation
theories is that cracking results from the
localized loss of ductility. In order to
prevent liquation cracks from propagat-
ing, the material must exhibit sufficient
ductility to accommodate the thermally
induced and/or externally applied strain.
Based on this criterion, to a first approx-
imation, it would be appropriate to as-
sume that the material at the crack tip
exhibits localized ductility with the mag-
nitude equal to the applied augmented
strain during both the longitudinal- and
spot-Varestraint testing. Thus, in con-
junction with the thermal cycle data,
Figs. 11 and 14 can be translated to
physically show the localized ductility
of the material at different temperatures
during weld heating as shown in Fig. 1 8
for the longitudinal-Varestraint test and
Fig. 19 for the spot-Varestraint test. In
these figures, the localized ductility is
analogous to the augmented strain. The
temperature of the material represents
the temperature at the crack tip (Ttip) dur-
ing testing, which is translated from the
MCL following the equation:
Ttip = TL - (MCL X GT) (6)
Fig. 17 —Schematic illustration of the on-cooling portion of the thermal CSR obtained from
the spot-Varestraint test.
Thus, results from the on-heating por-
tion of the longitudinal-Varestraint test
(Fig. 1 8) showed that A-286 exhibited
substantial localized ductility (greater
than 7% in this case) for temperatures
below 1194°C (21 81 °F). As the temper-
ature increased beyond 1194°C, the lo-
calized ductility dropped dramatically
to 3%, and further decreased to 0.5% at
higher temperatures below TL. In con-
trast, results from the on-heating spot-
Varestraint tests (Fig. 19) indicated that
A-286 exhibited considerable localized
ductility (greater than 5% in this case)
for temperatures below 1227°C
(2241 °F). The localized ductility
dropped substantially to 3% as the tem-
perature increased beyond 1227°C.
With a further increase in temperature,
the localized ductility decreased gradu-
ally to 0.5% at a temperature of 1 240°C,
and A-286 exhibited essentially no duc-
tility (less than 0.5%) for the tempera-
ture range between 1 240°C (2264°F)
and TL. On the other hand, Type 310
(Fig. 1 9) exhibited greater than 7% lo-
calized ductility for temperatures below
1 325°C (241 7°F). The localized ductil-
ity dropped rapidly to 3% as the tem-
perature exceeded 1 325°C, and further
146-s I APRIL 1993
13. decreased to approximately 1 % at tem-
peratures slightly below TL.
Note that there is a transition temper-
ature, 1 1 94°C or 1 227°C for A-286 as
obtained from longitudinal- and spot-
Varestraint, respectively, and 1325°C
for Type 310, above which the localized
ductility of the material dramatically
drops to essentially zero. The tempera-
ture range between TL and the transition
temperature defines the extent of the on-
heating thermal CSR. In order to deter-
mine this transition temperature, it is es-
sential the saturated augmented strain
be employed during both longitudinal-
and spot-Varestraint testing. It is appar-
ent that saturated augmented strain is
one of the important parameters for both
of these tests, yet the importance of this
parameter has generally been neglected
by most investigators who have used
these two tests to quantify liquation
cracking.
It is interesting that the transition tem-
peratures for A-286 defined with the lon-
gitudinal-and spot-Varestraint tests are
essentially the same, if reasonable ex-
perimental error is taken into account.
However, the localized ductility in the
on-heating thermal CSR is inconsistent.
This discrepancy can be rationalized by
considering the different local variations
in strain accommodation on the speci-
men surface during testing.
As shown in Fig. 20, the HAZ liqua-
tion cracks are parallel to each other in
the longitudinal-Varestraint test. Be-
cause the applied augmented strain is
theoretically calculated based on the
elongation of the top surface of the spec-
imen, the opening of the cracks would
accommodate some amount of the ap-
plied strain. The as-tested specimen sur-
face clearly showed that the opening of
the crack is wider at the trailing edge of
the weld pool and becomes narrower
toward the welding direction. This im-
plies that the strain distribution is not
uniform with a greater strain at the trail-
ing edge of the weld pool. Thus, the ac-
tual augmented strain for the crack lo-
cated at the transition between on-heat-
ing and on-cooling regions would be
lower than the calculated strain. In con-
trast, the HAZ liquation cracks are radi-
ally oriented relative to the weld center
in the spot-Varestraint test, as shown in
Fig. 2 1 . The crack with a maximum
length is always the widest and located
perpendicular to the longitudinal di-
mension of the specimen, indicating that
the localized strain was highest at that
point. It is postulated, therefore, the lo-
calized augmented strain is greater than
the calculated strain at this location.
Based on this argument, it follows that
the difference in the localized strain dis-
tribution in the longitudinal- and spot-
Varestraint tests results in the difference
_ 6
8
Q
TD
CD
N
to
0
o
Longitudinal-Varestraint Test
/
On-Heating thermal
"CSR of A-286
I
1450 1350 1250 1150
Temperature at crack tip (C) (Tt p = T L - M C L X G T )
Fig. 18 —The localized ductility in the on-heating thermal CSR of A-286 obtained from the
longitudinal-Varestraint test.
in the experimentally determined local-
ized ductility in the on-heating thermal
CSR from these two tests, with a greater
localized ductility in the former.
It was observed that both the longi-
tudinal- and spot-Varestraint test speci-
mens did not conform perfectly to the
surface of the die block. Specimens in
both tests tended to kink slightly at the
highest augmented strain level (7%). The
kinking of the specimen may thus result
in a higher applied strain than that cal-
culated. However, it did not affect the
ductility transition temperature (Figs. 18
and 19), since it was determined at a sat-
urated strain level of 3% for both alloys.
As shown in Figs. 18 and 19, even with
a higher level of augmented strain
(>3%), the transition temperature does
not change and, thus, specimen kinking
did not influence the results.
The localized ductility in the on-cool-
ing portion of the thermal CSR deter-
mined with the longitudinal- and spot-
Varestraint was not evaluated in this
study. However, it is definitely less than
5% for the two alloys investigated, since
5% augmented strain was employed for
the on-cooling spot-Varestraint tests,
and the CSR was obtained for A-286 at
5% augmented strain from the longitu-
dinal-Varestraint test. Thus, the thermal
CSR shown in Figs. 13 and 1 7 represents
a regime within which the material (both
A-286 and Type 310) exhibits less than
5% ductility (or perhaps 3%, since 3%
is the saturated strain for both alloys in
both tests).
Considering the complexity of the
strain field during the longitudinal- and
8
7
£ 6
= 5
n
Q
4
= 3ro °
8
-1
2
1
0
1'
•
t50
TL T
k*-Type -»J
310
TL I
I
' I
up
i
i
i
i *
1400 1350 1300
Temperature at crack tip (C)
Spot-Var
On-Heati
T
c
/
sstraint Test
ig thermal CSR
Up
>
>
fo
1250 1200 1150
( T a p = TL - M C L X G T )
Fig. 19 — The localized ductility in the on-heating thermal CSR of A-286 and Type 310 ob-
tained from the spot-Varestraint test.
WELDING RESEARCH SUPPLEMENT I 147-s
14. s v;
*
1
1WMP^PPI
-- i"
I AI 2 mm 1Fig. 20 — A micrograph showing the HAZ liquation cracks of A-286 tested with 5% aug-
mented strain from the longitudinal-Varestraint test. The welding direction is from right to
left.
spot-Varestraint testing and different
thermal and mechanical conditions for
hot-ductility testing, it would be appro-
priate to equate this very low-ductility
thermal CSR to the nil-ductility region
(NDR) as determined from the hot-duc-
tility test. The equivalence between the
CSR and the NDR provides experimen-
tal evidence for the criterion assumed
in the development of liquation crack-
ing theories, which states that liquation
cracking results from the localized loss
of ductility.
Correlation and Interpretation of Test
Results Obtained from the Three Methods
Two basic elements with metallurgi-
cal significance can be visualized in the
development of the thermal CSR. These
are the extent of the thermal CSR during
weld heating and the BTR on cooling.
The correlation between the theoretical
hypothesis and the experimental results
can be demonstrated by comparing the
magnitude of these two elements. As
listed in Table 9, very good correlation
was obtained for A-286 and Type 31 0
stainless steels among the three tests.
The development of this correlation
also clarifies the interpretation of results
from the three tests. Physically, the tem-
perature range between the TL and NDT
represents the extent of the thermal CSR
during weld heating. This temperature
range correlates with the temperature
range over which the MCL occurs at the
transition between on-heating and on-
cooling regions in the longitudinal-Vare-
straint test performed with saturated
strain. It also correlates with the temper-
ature range over which the MCL occurs
in the spot-Varestraint test performed
with saturated strain at no cooling time
(tc = 0). The temperature range between
a peak temperature and the correspond-
ing DRT is the temperature range in a
cooling cycle within which the material
exhibits negligible ductility, previously
defined as the BTR. This temperature
range in turn correlates with the cool-
ing time (tc) over which cracking is ob-
served in the spot-Varestraint test, and
the on-cooling portion of the cracked
HAZ length (CHLo c ) in the longitudi-
nal-Varestraint test. Despite the differ-
ence in testing techniques, the correla-
tion obtained for both A-286 and Type
31 0 is excellent, reinforcing the com-
plementary nature of these techniques
for predicting HAZ liquation cracking.
This good correlation also provides evi-
dence that the thermal CSR is a mate-
rial-specific parameter, and a true quan-
tification of HAZ liquation cracking sus-
ceptibility.
Application to Actual Welding Conditions
Although the thermal CSR is devel-
oped using weldability testing tech-
niques, it is a material-specific parame-
ter and can be applied to any of the con-
ventional fusion welding processes. The
application of the thermal CSR in a con-
tinuous weld can be clearly demon-
strated with the longitudinal-Varestraint
test as illustrated in Figs. 10 and 20.
Table 10 summarizes the procedures for
determining the thermal CSR using the
hot-ductility, longitudinal- and spot-
Varestraint tests. It is of importance to
note that the shape and size of the ther-
mal CSR reflects the compositional and
metallurgical nature of the material and
is independent of any process or restraint
factors. The thermal CSR allows com-
parison of cracking susceptibility among
different materials. Using this method-
ology, the thermal CSR surrounding a
moving weld pool has been determined
for A-286 and Type 310, as shown in
Fig. 22. It is clear that A-286 exhibits a
larger BTR and correspondingly wider
thermal CSR than Type 310, indicating
that A-286 would exhibit greater extent
of HAZ liquation cracking than Type 310
under the same thermal and restraint
conditions.
In applying this material-specific en-
velope to actual welding conditions, the
spatial extent of the CSR traveling with
the weld pool can be determined as a
function of the welding parameters,
which determine the thermal conditions
in the HAZ. Table 11 provides a trans-
formation matrix for determining the
magnitude of the thermal and spatial
CSR. As a result, the thermal envelope
determined via hot-ductility, spot- and
longitudinal-Varestraint weldability tests
can be directly applied to actual weld-
ing situations if the thermal gradient
(Gw ) and cooling rate (CRW) can be
measured or derived empirically. The
contribution of the welding process/pa-
rameter factor in cracking susceptibility
can also be visualized from the con-
struction of the spatial CSR.
Evaluation of Traditional
Methodologies
The development of this methodol-
ogy has provided a means to link to-
gether weldability test results, cracking
theories and material properties, and to
elucidate the interpretation of the hot-
ductility, spot- and longitudinal-Vare-
straint test results. The utility of tradi-
tional methodologies can also be eval-
uated based on this approach as dis-
cussed below.
Hot-Ductility Test
The construction of the NDR using
the hot-ductility test was first demon-
strated by Duvall, ef al. (Refs. 32, 33).
Unfortunately, they could not develop
a relationship between the NDR and
HAZ liquation cracking susceptibility.
Based on a rough calculation of the weld
size, he suggested that HAZ liquation
cracks propagated outside of the NDR
[i.e., via solid-state cracking) and the
148-s I APRIL 1993
15. amount and rate of ductility recovery
were the most sign ificant factors govern-
ing liquation cracking susceptibility. De-
spite the high levels of strain used in this
investigation during spot- and longitu-
dinal-Varestraint testing, cracks were
never observed to propagate outside of
the NDR. Thus, the importance of duc-
tility recovery below the DRT, as sug-
gested by Duvall, et al., appears to be
negligible based on the results from both
A-286 and Type 310 stainless steels.
The NST-DRT temperature range has
been utilized extensively as a quantita-
tive cracking index (Refs. 11,27, 30, 31).
This index is restrictive in that it only
represents the BTR at a specific location
in the HAZ. Since the highest peak tem-
perature that can be easily achieved in
the hot-ductility test is in the vicinity of
the NST, this approach only provides in-
formation for a point in the HAZ that is
removed from the fusion boundary.
When considering that HAZ liquation
cracking is commonly observed in the
region immediately adjacent to the fu-
sion boundary, this cracking index may
not be representative of actual behavior
or predictive of liquation cracking sus-
ceptibility. This is particularly true if the
difference between TL and the NST is
large. This problem is further exacer-
bated when peak temperatures below
the NST are used to develop on-cooling
hot ductility behavior, as is the case in
many of the published reports which use
hot-ductility data to predict HAZ liqua-
tion cracking susceptibility.
The hot strength criterion proposed
in 1 960s (Refs. 27-29) is commonly uti-
lized to rationalize the inconsistency be-
tween the hot-ductility results and crack-
ing observed in the field experience.
However, considering the fact that all
materials exhibit extremely low strength
in the temperature range in which crack-
ing occurs, the elastic strain induced by
this hot strength would be negligible. In
addition, most alloys exhibit a critical
level of threshold strain for cracking in
the spot- and longitudinal-Varestraint
testing (e.g., 1 % for Type 310 in Fig. 14).
The observation of significant threshold
strain to cause cracking indicates that the
materials have the ability to resist crack-
ing even under a substantial applied
stress. This suggests, therefore, that it is
the hot ductility rather than hot strength
that dominates liquation cracking.
Spot-Varestraint Test
The conventional cracking indexes
for the spot-Varestraint test, the thresh-
old strain to cause cracking or the de-
gree of cracking (MCL or TCL) over ar-
bitrary augmented strain levels and an
arbitrary cooling time, are even more
complicated from a metallurgical stand-
Fig. 21 — A micrograph showing the HAZ liquation cracks of A-286 tested with 5% aug-
mented strain from the spot-Varestraint test.
1050°C
1035°C
y/^///////////////^J^^
V1350°C
1325°C
(A) A-286
1325°C
1386°C 1296°C
ZZZZZZZZZ-
(B) Type 310
Fig. 22 — Thermal CSR of A-286 and Type 310 stainless steels.
WELDING RESEARCH SUPPLEMENT I 149-s
16. Table 9 — Correlations among the Hot-Ductility, Spot- and Longitudinal-Varestraint Test
Results
A-286, Extent of the
on-heating CSR
Hot-Ductility Test
- NDT =
Spot-Varestraint
Test
MCL X CT =
Longitudinal-
Varestraint Test
MCL X GT
1422- 1200 = 222°C 1.93 X 101 = 195°C 0.80 X 286 = 2293
C
Type 310, Extent of TL - NDT = MCL X GT =
the on-heating CSR 1386 - 1325 = 61 °C 0.39 X 156 = 60°C
A-286,
BTR at NST
Type 310,
BTR at NST
NST - DRTNST = tc X CRT =
1350- 1050 = 300°C 4.10 X 68 = 279°C
NST - DRTNST =
1350- 1325 = 25°C
tc X CRT =
0.20 X 140 J
Not Determined
CRT X CHLOC/VT =
66 X 11.5/2.54 = 299°C
Not Determined
28°C
point. First, the crack length (either MCL
or TCL) does not provide a material-spe-
cific quantification; rather, it represents
a specific material/process/restraint
combination. Any variation in the test
conditions such as the welding parame-
ters and the augmented strain level
would affect the test results. Second, the
saturated strain has been found to be the
parameter which must be used to
uniquely determine the size of the CSR.
As shown in Fig. 14, the MCL is depen-
dent on the augmented strain for the
strain level below the saturated strain.
Thus, the MCL determined below the
saturated strain, such as in most of the
published literature, would only repre-
sent part of the CSR. It does not provide
a comprehensive measure of cracking
susceptibility. It is also of importance to
note that the MCL determined in this
manner is very sensitive to the localized
strain distribution of samples during test-
ing. Thus, test results from a laboratory
may not be easily reproduced in another
laboratory due to the difference in equip-
ment setup. Third, the cooling time has
been proved to be the parameter which
governs the HAZ temperature during
testing and, thus, the on-cooling behav-
ior of material. Tests performed with an
arbitrary, fixed cooling time will only
reveal a specific width of the on-cool-
ing CSR as shown in Fig. 1 5. The use of
unsaturated strain level during testing
would, then, only reveal part of this spe-
cific width and increase the complexity
of the test results in relation to the met-
allurgical aspects of liquation cracking
susceptibility. This specific width of the
CSR would neither correlate with the on-
cool ing behavior obtained from the hot-
ductility test nor reflect the cracking be-
havior of the material during actual
welding.
The metallurgical significance of the
MCL can also be revealed from this
study. By representing MCL as the dis-
tance from the fusion boundary to the
crack tip, it can be directly correlated
with the extent of the CSR. Notice that
this manner of representation of the MCL
also dramatically reduces the human
error in crack length measurement. His-
torically, this cracking index has not
been used as extensively as the TCL in
the published literature. In the spot-
Varestraint test, the TCL represents the
cumulative length of all cracks with the
same thermal conditions at different
strain levels. It is not material-specific
and may be influenced by grain size and
strain localization at the grain bound-
ary. As a result, TCL is not metallurgi-
cally significant with respect to HAZ li-
quation cracking.
Since spot-Varestraint was modified
from the original Varestraint test, the ter-
minologies utilized in quantifying the
degree of cracking (MCL or TCL) were
also adopted. Physically, the MCL in all
three types of Varestraint tests (spot, lon-
gitudinal and transverse) characterizes
a region over which cracking occurs.
Table 10 — Development of the Thermal CSR (Fig. 7)
Point/
I ine
A
CB
E
E'
BE'
E'A'
A '
Theoretical
Quantity
TL
NDT
SST
DRTNST
DRT's
DRT's
DRTR
Hot Ductility
Test
—
NDT
NST
DRTN S T
DRT's
—
—
Spot-Varestraint
Test
TP at fusion boundary
TL - (MCL X CT)
—
NST - (tc,NST X CRT)
Tip as function of tc
Ttjp as function of tc
T L - U C T L X C R T )
Longitudinal-Varestraint
Test
Tp at fusion boundary
TL - (MCL X GT)
TL - CRT X CHL0C,NST/VT
Tip as function of CHLoc
Ttip as function of CHLoc
TL - CRT X CHLQCJI/VT
However, the thermal histories in this
cracked region along the crack are dif-
ferent among these tests. In the
Transvarestraint test, the weld center-
line crack falls in the same thermal cycle
(Ref. 1 0). In the case of HAZ cracks in
the longitudinal- and spot-Varestraint
tests, the crack which is perpendicular
to the longitudinal direction of the sam-
ple follows different thermal cycles in
the HAZ, but cracking occurs at the
same instant relative to the peak tem-
perature. In the case of solidification
cracks in the longitudinal-Varestraint
test, cracking occurs following different
thermal cycles and at different instants
relative to the peak temperature. As a
result of the difference in thermal his-
tory of the cracks generated in the three
tests, the cracking temperature range in
the Transvarestraint test determined by
the MCL defines the BTR. The HAZ
cracking temperature range determined
by the MCL in both the longitudinal- and
spot-Varestraint tests, on the other hand,
defines a thermal width of the cracked
region.
Longitudinal-Varestraint Test
The discussion of the conventional
cracking indexes for the longitudinal-
Varestraint test, TCL or MCL, foi lows that
for the spot-Varestraint test, except that
TCL is the cumulative length of all cracks
with the same strain level at different
thermal conditions in the longitudinal-
Varestraint test. Both the MCL and TCL
cracking indexes represent results for a
specific material/process/ restraint com-
bination. The magnitude of these in-
dexes would vary if different welding
parameters or augmented strain are em-
ployed. The CHL criterion, proposed by
Lundin, etal. (Ref. 14), can be normal-
ized with the thermal conditions expe-
rienced during testing to obtain a BTR,
if the tests are performed with a satu-
rated strain and only the on-cooling por-
tion of the CHL (CHLo c ) is considered,
as illustrated in Fig. 10 and Table 11.
However, it is very unlikely that the
CHL0 c a t a
specific location in the HAZ
can be precisely determined without the
development of the entire CSR.
Summary
This paper has described an experi-
mental approach that allows HAZ liqua-
tion cracking susceptibility to be quan-
tified in a manner that is metallurgically
significant and material-specific.
Methodologies have been developed
and tested for defining the thermal crack-
susceptible region (CSR) for a material.
Any one of three weldability tests can
be used to quantify the thermal CSR,
namely, the Gleeble hot-ductility test,
150-s I APRIL 1993
17. and the spot- and longitudinal-Vare-
straint tests. The results presented here
have also provided new insight into the
interpretation and correlation of test data
for each of these tests and form the basis
of a unified approach for defining a ma-
terial-specific temperature regime
within which HAZ liquation cracking
occurs. Recent results have shown that
this methodology can also be success-
fully applied to other materials, includ-
ing Alloy 625 and aluminum Alloy 6061
(Refs. 60, 61).
During the development of this
methodology some inherent limitations
in utilizing any of the three tests for pre-
dicting the occurrence of HAZ liquation
cracking were also identified. Although
the thermal CSR represents the temper-
ature regime over which HAZ liquation
cracking may occur, it only serves as an
indirect measure of the actual cracking
susceptibility. In order to fully quantify
this susceptibility during welding, other
factors such as ductility within the BTR,
the effect of liquid healing and local
HAZ strain accommodation must be
considered. Unfortunately, it is very dif-
ficult to incorporate these factors when
interpreting weldability test data. As a
consequence, the methodology devel-
oped here, while providing a material-
specific quantification of HAZ liquation
cracking, cannot easily accommodate
the variations in weld restraint that often
dictate the occurrence and severity of
cracking.
Despite these limitations, the devel-
opment of this methodology has shown
that the Gleeble hot-ductility and Vare-
straint tests are effective tools for both
quantifying the HAZ liquation cracking
susceptibility in terms of the size of the
thermal CSR and developing a funda-
mental understanding of the liquation
phenomena. Part 2 of this investigation
will describe the metallurgical behavior
in the CSR in support of this test method-
ology.
Conclusions
1) A new methodology has been de-
veloped for quantifying HAZ liquation
cracking susceptibility. This methodol-
ogy quantifies a thermal crack-suscepti-
ble region in the HAZ in which HAZ li-
quation cracking may occur. It is a ma-
terial-specific parameter and represents
a true quantification of HAZ liquation
cracking susceptibility. This region can
be determined using the Gleeble hot-
ductility, spot- or longitudinal-Vare-
straint tests.
2) The thermal crack-susceptible re-
gion can be described by two basic ele-
ments: the extent of the crack-suscepti-
ble region during weld heating and the
brittle temperature range on cooling.
Table 11 — Transformation Matrix for the Derivation of the Thermal and Spatial CSR
A. The Hot-Ductility Test
Width of CSR
BTR
Test Result
TL - NDT
TP - DRT
Thermal CSR
TL - NDT
TP - DRT
Spatial CSR
(TL - NDT)/Gv
(TP - DRT) X Vw/CRw
B. The Longitudinal-Varestraint Test
Test Result Thermal CSR
Width of CSR MCL MCL X GT
BTR CHLoc CHLoc X CRT/VT
Spatial CSR
MCL X Gr/Gw
CHLoc X CRT/VT X VV /CRVV
C. The Spot-Varestraint Test
Test Result Thermal CSR
Width of CSR MCL MCL X CT
BTR tc tt X CRT
Spatial CSR
MCL X C T / C W
tc X CRT X Vw/CRw
The temperature range between the liq-
uidus (TL) and nil-ductility temperature
(NDT) in the hot-ductility test represents
the extent of the on-heating thermal
crack-susceptible region. This tempera-
ture range correlates with the tempera-
ture range over which the maximum
crack length occurs at the transition be-
tween on-heating and on-cooling re-
gions in the longitudinal-Varestraint test
performed with saturated strain. It also
correlates with the temperature range
over which the maximum crack length
occurs in the spot-Varestraint test per-
formed with saturated strain for no cool-
ing time after arc extinction.
3) The temperature range between
the peak temperature (TP) and the cor-
responding ductility recovery tempera-
ture (DRT), as obtained from the hot-
ductility test, represents the brittle tem-
perature range (BTR). This temperature
range in turn correlates with the cool-
ing time over which cracking is observed
in the spot-Varestraint test, and the on-
cooling portion of the cracked HAZ
length in the longitudinal-Varestraint
test.
4) The localized ductility within the
thermal crack-susceptible region is es-
sentially zero. These results provide ex-
perimental evidence supporting the cri-
terion assumed in the development of
liquation cracking theories, which states
that liquation cracking results from the
localized loss of material ductility.
5) The importance of saturated aug-
mented strain in both the longitudinal-
and spot-Varestraint tests was evaluated.
The saturated strain refers to the applied
strain above which the maximum crack
length remains constant. It was found
that saturated strain conditions must be
used to uniquely define the temperature
above which the ductility of the mate-
rial drops to essentially zero. This tem-
perature correlates to the on-heating nil-
ductility temperature in the hot-ductil-
ity test.
6) The importance of the cooling time
in the spot-Varestraint test was evalu-
ated. Cooling time is defined as the time
period between arc extinction and spec-
imen bending and is the parameter
which governs the temperature in the
HAZ during on-cooling spot-Varestraint
testing. By varying the cooling time, the
on-cooling crack-susceptible region can
be determined.
7) For the A-286 stainless steel tested
in this study, the extent of the on-heat-
ing thermal crack-susceptible region is
222°C. The brittle temperature range at
the location of the nil-strength tempera-
ture is 300°C. The brittle temperature
range at the fusion boundary is 387°C.
8) For the Type 310 stainless steel
tested in this study, the extent of the on-
heating thermal crack-susceptible re-
gion is 61 °C. The brittle temperature
range at the location of the nil-strength
temperature is 25°C. The brittle temper-
ature range at the fusion boundary is
90°C.
Acknowledgments
The authors would like to acknowl-
edge the members of Edison Welding In-
stitute for providing financial support for
this work. The generosity of Rolled Al-
loys, for providing the Type 31 0 stain-
less steel, is also appreciated.
References
1. Hemsworth, B., Bonizewski, T., and
Eaton, N. F. 1969. Classification and defini-
tion of high-temperature welding cracks in
alloys. Metal Construction and British Weld-
ing lournal 1 (2):5-1 6.
2. Lippold, J. C , Harwig, D. E., Ernst, S.
C , and Nelson, T. 1 989. Development of a
weldability test data base WELDTEST. un-
published research. Edison Welding Institute.
Columbus, Ohio.
3. Baeslack, W. A. Ill, and Lippold, ). C.
1987. Evaluation of weldability testing tech-
niques. Proceedings of EWI Annual North
American Welding Research Seminar on The
Influence of New Materials Developments
on Weldability. Columbus, Ohio.
4. Lippold, |. C. 1988. Physical simula-
tion of welding: a perspective on weldability
testing. Proceedings of International Sympo-
sium on Physical Simulation of Welding, Hot
WELDING RESEARCH SUPPLEMENT I 151-s
18. Forming and Continuous Casting Processes.
Ottawa, Canada.
5. Prokhorov, N. N. 1962. The techno-
logical strength of metals while crystallizing
during welding. Welding Production
9(4):1-8.
6. Prokhorov, N. N., and Prokhorov, N.
Nikol. 1 971. Fundamentals of the theory for
technological strength of metals while crys-
tallizing during welding. Trans. JWS
2(2):109-117.
7. Savage, W. F., and Lundin, C. D. 1965.
The Varestraint test. Welding Journal
34(10):433-s to 442-s.
8. Lundin, C. D., Lingenfelter, A. C ,
Grotke, G. E., Lessmann, G. G., and Math-
ews, S. J. 1 982. The Varestraint test. Weld-
ing Research Council Bulletin No. 280.
9. Savage, W. F., Nippes, E. F., and Good-
win, G. M.. 1 977. Effect of minor elements
on hot cracking tendencies of Inconel 600.
Welding Journal 56(8):245-s to 253-s.
10. Senda, T., Matsuda, F., Takano, G.,
Watanabe, K., Kobayashi, T , and Matsuzaka,
T. 1971. Fundamental investigations on so-
lidification crack susceptibility for weld met-
als with Transvarestraint test. Trans. JWS
2(2):1-22.
11. Donati, J. R., and Zacharie, G. 1974.
Evaluation of tendency toward hot crack in
the welding heat-affected zone of austenitic
18-10 stainless steels. Revue de Metallurgie
71(12):905-915.
12. Ogawa, T., and Tsunetomi, E. 1982.
Hot cracking susceptibility of austenitic stain-
less steels. Welding journal 61 (3):82-s to 93-s.
13. Lundin, C. D., Lee, C. H., and Menon,
R. 1988. Hot ductility and weldability of free
machining austenitic stainless steel. Welding
yourna/67(10):119-sto 130-s.
14. Lundin, C. D., and Qiao, C. Y. P.
1991. Weldability of nuclear grade stainless
steels. Proceedings of the International Con-
ference on New Advances in Welding and
Allies Processes. Beijing, China.
15. Katoh, M., and Kerr, H. W. 1987. In-
vestigation of heat-affected zone cracking of
GTA welds of Al-Mg-Si alloys using the Vare-
straint test. Welding Journal 66(12):360-s to
368-s.
16. West, S. L., Baeslack, W. A. Ill, and
Kelly, T. J. 1989. Morphology of weld heated-
affected zone liquation cracking in Ta-modi-
fied cast alloy 718. Metallography 23(3):219-
229.
17. Thompson, R. O , Cassimus, J. J.,
Mayo, D. E., and Dobbs, J. R. 1 985. The re-
lationship between grain size and microfis-
suring in alloy 718. Welding Journal 64(4) :91-
s to 96-s.
1 8. Thompson, R. G. 1 988. Microfissur-
ing of alloy 718 in the weld heat-affected
zone. Journal of Metals 40(7):44-48.
19. Lippold, J.C., Baeslack, W. A. Ill, and
Varol, I. 1992. Heat-affected zone liquation
cracking in austenitic and duplex stainless
steels. Welding Journal 71(1):1-s to 14-s.
20. Kujanpaa, V. P., David, S. A., and
White, C. L. 1987. Characterization of heat-
affected zone cracking in austenitic stainless
steel welds. Welding Journal 66(81:221-s to
228-s.
21. Lippold, ). C. 1 983. An investigation
of heat-affected zone hot cracking in alloy
800. Welding Journal 62(1 ):1 -s to 11 -s.
22. Ernst, S. C , Baeslack, W. A. Ill, and
Lippold, ). C. 1989. Weldability of a high-
strength, low-expansion superalloy. Welding
Journal 68(10):418-s to 430-s.
23. Brooks,). A. 1974. Effect of alloy mod-
ifications on HAZ cracking of A-286 stain-
less steel. Welding Journal 53(11):51 7-s to
523-s.
24. Lin, W . 1991. A methodology for
quantifying heat-affected zone liquation
cracking susceptibility. Ph.D. dissertation.
The Ohio State University. Columbus, Ohio.
25. Nippes, E. F., Savage, W. F., Bastin,
B. T., Mason, H. F„ and Curran, R. M. 1955.
An investigation of the hot ductility of high-
temperature alloys. Welding Journal
34(4) :183-s to 196-s.
26. Nippes, E. F., Savage, W. F., and
Grotke, G. 1 957. Further studies of the hot
ductility of high-temperature alloys. Welding
Research Council Bulletin No. 33.
27. Williams, C. S. 1963. Steel strength
and ductility response to arc welding ther-
mal cycles. Welding Journal 42(1):l-s to 8-s.
28. Kreischer, C. H. 1963. A critical anal-
ysis of the weld heat-affected zone hot duc-
tility test. Welding Journal 42(2):49-s to 59-s.
29. Weiss, B., Grotke, G. E., and Stickler,
R. 1970. Physical metallurgy of hot ductility
testing. Welding Journal 49(10):471 -s to 487-s.
30. Dahl, W., Duren, C , and Muesch, H.
1973. Susceptibility of austenitic welded
joints to hot cracking. IIW Doc. 11-660-73.
3 1 . Muesch, H. 1984. Welding of mate-
rial TP 347 mod. Mannesmann Research In-
stitute. Duisburg, Germany.
32. Owczarski, W. A., Duvall, D. S., and
Sullivan, C. P. 1966. A model for heat-af-
fected zone cracking in nickel base superal-
loys. We/d/'ngyourna/45(4):145-s to 155-s.
33. Duvall, D. S., and Owczarski, W. A.
1967. Further heat-affected zone studies in
heat resistant nickel alloys. Welding Journal
46(9):423-sto432-s.
34. Yeniscavich, W. 1966. A correlation
of Ni-Cr-Fe alloy weld metal fissuring with
hot ductility behavior. Welding Journal
45(8):334-s to 356-s.
35. Yeniscavich, W. 1969. Correlation of
hot ductility curves with cracking during
welding. Proceedings of the Symposium on
Methods of High-Alloy Weldability Evalua-
tion. 2-12. Welding Research Council. Troy,
N.Y.
36. Arata, Y., Terai, K., Nagai, H.,
Shimizu, S., and Aota, T. 1977. Fundamen-
tal studies on electron beam welding of heat-
resistant superalloys for nuclear plants - Re-
port II. Trans JWRI 6(1 ):69-79.
37. Lin, W., Baeslack, W. A., Ul and Lip-
pold, ). C. 1989. Hot ductility testing of high
strength low expansion superalloys. Recent
trends in welding science and technology
TWR '89. 609-614, ASM International, Ma-
terials Park, Ohio.
38. Blum, B. S., and Witt, R. H. 1963.
Heat-affected zone cracking in A-286 weld-
ments. Welding Journal 42(8):365-s to 370-s.
39. Brooks, J. A., and Krenzer, R. W. 1974.
Progress toward a more weldable A-286.
Welding Journal 53(6):242-s to 245-s.
40. Vagi, ). J., and Martin, D. C. 1956.
Welding of high-strength stainless steels for
elevated-temperature use. Welding Journal
35(3):137-s to 144-s.
41. Brooks, J. A. 1974. Effect of alloy mod-
ifications on HAZ cracking of A-286 stain-
less steel. Welding Journal 53(1 1 ):51 7-s to
523-s.
42. Morishige, N., Kuribayashi, M., and
Okabayashi, H. 1979. Effects of chemical
compositions of base metal on susceptibility
to hot cracking in austenitic stainless steel
welds. IIW Doc. IX-1114-79.
43. Gooch, T. O , and Honeycombe, ).
1 980. Welding variables and microfissuring
in austenitic stainless steel weld metal. Weld-
ing Journal 59(8): 233-s to 241 -s.
44. Lundin, C. D., Chou, C. P. D., and
Sullivan, C. J. 1 980. Hot cracking resistance
of austenitic stainless weld metal. Welding
Journal 59(8):226-s to 232-s.
45. King, B. L. 1966. Weld metal and heat-
affected zone cracking in wrought austenitic
stainless steels. BWRA Report, C139/A/2/65.
The Welding institute. Cambridge, England.
46. Tamura, H „ and Watanabe, T. 1973.
Mechanism of liquation cracking in the weld
heat-affected zone of austenitic stainless
steels. Trans JWS 4(1)30-42.
47. Labtech Notebook software package.
1990. Laboratory Technologies Corp., Wilm-
ington, Mass.
48. Demyantsevich, V. P. 1967. Mecha-
nism of hot cracking during welding. Weld-
ing Production 14(3): 1-6.
49. Medovar, B. I. 1954. On the nature
of weld hot cracking. Avtom. Svarka
7(4):12-28. Brutcher Translations No. 3400.
50. Torpov, V. A. 1957. On the mecha-
nism of hot cracking. Metallovedenie
Obrabotka Metallov (6):54-58. Brutcher
Translations No. 3982.
51. Pumphrey, W.)., and Jennings, P. H.
1948. A consideration of the nature of brit-
tleness above the solidus in castings and
welds on aluminum alloys. Journal of the In-
stitute of Metals 75:235-256.
52. Pellini, W. S. 1 952. Strain theory of
hot tearing. The Foundry 80(11 ):1 25-133.
53. Apblett, W. R„ and Pellini, W. S. 1954.
Factors which influence weld hot cracking.
Welding Journal 33(2):83-s to 90-s.
54. Bishop, H. F., Ackerlind, C. E., and
Pellini, W. S. 1952. Metallurgy and mechan-
ics of hot tearing. Trans. American Foundry-
mans Society 60:818-833.
55. Borland, J. C , and Younger, R. N.
1960. Some aspects of cracking in welded
Cr-Ni austenitic steels. British Welding Jour-
nal 6(1):9^16.
56. Borland, j . C. 1961. Generalized the-
ory of super-solidus cracking in weld and
casting. British Welding Journal
7(81:508-512.
57. Borland, J. C. 1979. Fundamentals of
solidification cracking in welds. Welding and
Metal Fabrication Parti, (1/2):19-29. Part II,
(3):99-107.
58. Matsuda, F., Nakagawa, H., and So-
rada, K. 1982. Dynamic observation of so-
lidification and solidification cracking dur-
ing welding with optical microscope. Trans.
7W/?l11(2):67-77.
59. ASM Metal Handbook. Properties and
selection: stainless steels, tool materials and
special-purpose metals. 9th Edition, Vol. 3,
ASM International, Materials Park, Ohio.
60. Lin, W., Nelson, T. W., Lippold, ]. C ,
and Baeslack, W. A. III. 1992. A study of the
HAZ crack-susceptible region in alloy 625.
to be published in Proceedings of the 3rd In-
ternational Conference on Trends in Weld-
152-s I APRIL 1993
19. ing Research, Gatlinburg, Tenn.
61. Nelson, T. W., Lin, W., and Lippold,
J. C. 1992. A study of the HAZ crack-suscep-
tible region in 6061 aluminum alloy, unpub-
lished research. Edison Welding Institute.
Columbus, Ohio.
Appendix A
Symbols and Abbreviations
BTR Brittle temperature range
CHL Cracked heat-affected zone
length
CHL0c On-cooling portion of the
cracked HAZ Length
CHLQCNST C H L O C at a point in the
HAZ which experiences a
peak temperature of NST
CHLOCTL CHLo c at the fusion
boundary
CHLOH On-heating portion of the
cracked HAZ Length
CRT Average Cooling Rate
during weldability testing
CRW Average cooling rate for
actual welding conditions
CSR Crack-susceptible region
DRT Ductility recovery
temperature
DRTNST DRT corresponding to a
peak temperature equal to
the NST
DRTa DRT corresponding to a
peak temperature equal to
theTL
FB Fusion Boundary
GT Temperature gradient
during weldability testing
G w Temperature gradient for
actual welding conditions
HAZ Heat-affected zone
MCL Maximum crack length
NDR Nil-ductility region
NDT Nil-ductility temperature
L
c,TL
TCL
TFR
TL
•up
NST Nil-strength temperature
PMZ Partially-melted zone
tc Cooling time over which
cracking occurs in the
spot-Varestraint testing
tc.NST l
c a t
a point in the HAZ
which experiences a peak
temperature of NST
tc at the fusion boundary
Total crack length
Temperature at the fusion
boundary after arc
extinction
Liquidus temperature
Peak temperature of a
thermal cycle
Temperature at the crack
tip during weldability
testing
VT Travel speed during
longitudinal-Varestraint
testing
V w Travel speed for actual
welding conditions
Appendix B
Definition of Terms
Brittle Temperature Range (BTR): The
temperature range during weld cooling
within which the material is susceptible
to liquation cracking due to the local-
ized loss of grain boundary ductility.
Cooling Time (tc) or Delay Time: The
time period between arc extinction and
specimen bending for the spot-Vare-
straint test.
Cracked HAZ Length (CHL): The
length of the region in the HAZ, mea-
sured parallel to the fusion boundary,
over which cracking is observed in the
longitudinal-Varestraint test.
Crack-susceptible Region (CSR): The
HAZ region, surrounding the weld pool,
within which the material is susceptible
to liquation cracking due to the local-
ized loss of ductility.
Ductility Recovery Temperature
(DRT): Temperature on-cooling from a
peak temperature above the NDT at
which perceptible ductility (>5%) of the
material is apparent.
Maximum Crack Length (MQJ: The
maximum length of cracks on the as-
tested specimen surface in longitudinal-
or spot-Varestraint tests. Traditionally,
this crack length is measured from tip to
tip of a crack. In this study, the MCL rep-
resents the distance between the
isotherm at the crack tip and the
isotherm at the fusion boundary.
Nil-Ductility Region (NDR): A region
in the HAZ, surrounding the weld pool,
within which the ductility of the mate-
rial, as determined with the hot-ductil-
ity test, is essentially zero.
Nil-Ductility Temperature (NDT):
Temperature on-heating at which the
ductility of the material drops to zero.
Nil-Strength Temperature (NST):
Temperature on-heating at which the
strength of the material drops to essen-
tially zero.
Saturated Strain: The applied aug-
mented strain level above which the
maximum crack length remains con-
stant, or saturates, for the spot- and lon-
gitudinal-Varestraint tests.
Threshold Strain: The applied aug-
mented strain above which cracking oc-
curs in the longitudinal- or spot-Vare-
straint tests.
Total Crack Length (TCL): Cumula-
tive length of all cracks on an as-tested
specimen surface in spot- or longitudi-
nal-Varestraint tests.
WELDING RESEARCH SUPPLEMENT I 153-s