Avail well worked assignment on Accounting solved by experts who will ensure quality work on your homework. We offer 24/7 Homework Help worked on and submitted on time as requested. Get it touch with our team today and get it done. visit https://www.accountingassignmenthelper.com/
Ride the Storm: Navigating Through Unstable Periods / Katerina Rudko (Belka G...
Accounting Assignment Sample Problems with Solutions
1. Question 1 (40 points --- 8 points each)
For each event in (1) – (5):
(a) Record the transactions (if necessary) using either the balance sheet equation or the journal
entry approach. Be specific about account names. Be sure to label each account as Asset
(A) , Liability (L), or Equity (E). Equity (E) includes income statement items (i.e. revenue
and expense accounts).
(b) Indicate the effect of the transactions on the Indirect Cash Flow Statement (start with net
income and reconcile to Cash from Operations). Specify whether it affects the operating,
investing or financing section and indicate the net cash effects of each section affected by the
transaction. If there is no effect, write “no effect”.
The first event is given as example.
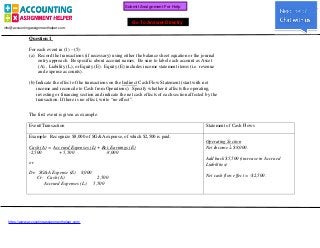
Event/Transaction Statement of Cash Flows
Example: Recognize $8,000 of SG&A expense, of which $2,500 is paid.
Operating Section
Cash (A) = Accrued Expenses (L) + Ret. Earnings (E) Net Income fl $8,000.
-2,500 + 5,500 -8,000
Add back $5,500 (increase in Accrued
or Liabilities)
Dr: SG&A Expense (E) 8,000
Net cash flow effect = -$2,500.
Cr: Cash (A) 2,500
Accrued Expenses (L) 5,500
Page 1 of 9
Submit Assignment For Help
Go To Answer Directly
info@accountingassignmenthelper.com.
https://www.accountingassignmenthelper.com/
2. Event/Transactions Statement of Cash Flows
(a) The company receives $50,000 cash for orders which will be delivered during the
next fiscal year. The company acquires $30,000 inventory on account to fill the order.
(b) The company delivers the all of the goods ordered in (a).
(c) Warehouse flooding ruins $5,000 of inventory which is thrown away. No provision
had been made for damaged inventory.
Page 2 of 9
3. Event/Transactions Statement of Cash Flows
(d) The company rents office space for one year, paying the entire year’s rent of $12,000
in advance and recognizing the first month’s rental expense.
(e) The company borrows $15,000 from the bank and purchases office equipment for
$10,000 cash
Page 3 of 9
4. Question 2: Accounts Receivable (16 Points)
The following is an excerpt from the 10-K of Tootsie Roll Industries Inc.:
Tootsie Roll Industries, Inc. and its consolidated subsidiaries (the
"Company") have been engaged in the manufacture and sale of candy for over 100
years. This is the only industry segment in which the Company operates and is
its only line of business. The majority of the Company's products are sold under
the registered trademarks TOOTSIE ROLL, TOOTSIE ROLL POPS, CHILD'S PLAY, CARAMEL
APPLE POPS, CHARMS, BLOW-POP, BLUE RAZZ, ZIP-A-DEE-DOO-DA POPS, CELLA'S, MASON
DOTS, MASON CROWS, JUNIOR MINT, CHARLESTON CHEW, SUGAR DADDY, SUGAR BABIES,
ANDES AND FLUFFY STUFF.
Please refer to the financial statements for Tootsie Roll for additional information. Assume all
sales are on account and there are no deferred revenues.
a. (3 points) What is the gross amount of Tootsie Roll's accounts receivable at the end of 2000?
b. (4 points) What percentage of these receivables does management estimate to be
uncollectible? How does this compare with 1999?
Page 4 of 9
5. c. (5 points) Using the balance sheet equation format or journal entries, reconstruct the
transactions for (a) bad debt expense and (b) the actual write-offs of uncollectible accounts
for the year ended December 31, 2000.
d. (4 points) Estimate the amount of cash Tootsie Roll collected from customers in 2000.
Page 5 of 9
6. Question 3: Inventory (15 points)
Please refer to the financial statements for Tootsie Roll for additional information. The
following footnote appears in Tootsie Roll’s 2000 10K:
INVENTORIES:
Inventories are stated at cost, not in excess of market. The cost of
inventories ($37,505 and $29,111 at December 31, 2000 and 1999, respectively)
has been determined by the last-in, first-out (LIFO) method. The excess of
current cost over LIFO cost of inventories approximates $2,993 and $5,008 at
December 31, 2000 and 1999, respectively.
a. (3 points) What is the 2000 LIFO reserve?
b. (4 points) Did Tootsie Roll experience inflation or deflation in raw materials costs during
2000? Provide evidence in support of your answer.
c. (8 points) Compute Tootsie Roll's inventory turnover (COGS / Average Inventory) in
2000 under LIFO. Compute inventory turnover under FIFO. Which measure gives the
more accurate economic picture of Tootsie Roll’s performance? Why?
Page 6 of 9
7. Question 4: Long-Lived Assets (14 points)
The following is an excerpt from the 10-K of William Wrigley Jr. Co’s for 2000:
The consolidated financial statements include the accounts of the Wm. Wrigley Jr.
Company and its associated companies (the Company). The Company's principal
business is manufacturing and selling chewing gum. All other businesses constitute
less than 10% of combined revenues, operating profit and identifiable assets.
Please refer to Wrigley’s balance sheet, statement of operations, and statement of cash when answering
the following questions.
a. (3 points) What was the gain or loss associated with the sale of property, plant and equipment in
2000? Be sure to specify whether it was a gain or a loss.
b. (3 points) Record the transaction (you may use either the balance sheet equation format or
journal entries) for the depreciation of property, plant and equipment for Wrigley for 2000?
c. (8 points) In addition to selling PP&E, Wrigley purchased some PP&E. Record the transactions
for (a) the purchase and (b) sale of retired PP&E. There were no non-cash purchases in 2000.
Page 7 of 9
8. Question 5: Miscellaneous (15 points)
Please refer to both Tootsie Roll’s and Wrigley’s financial statements when answering the following
questions.
a. (6 points) Calculate the components of return on assets (using the formulas below) for
Tootsie Roll and Wrigley for 2000. Use ending balances (vs. average balances) for the
balance sheet accounts.
ROA = Profitability x Asset Turnover
Net Income = Net Income x Sales
Assets Sales Assets
Tootsie Roll ____________ ____________ ____________
Wrigley ____________ ____________ ____________
b. (3 points) Which company generates higher returns from its assets? What is the source of the
higher returns?
(This question continues on the following page.)
Page 8 of 9
9. c. (6 points) Suppose it is determined in 2001 that Junior Mints cause amnesia in MBA students.
Tootsie Roll must reduce the value of intangible assets (the Junior Mints brand name) by $20
million. What would be the effect on each of the following ratios (increase, decrease, no effect)?
i. Quick Ratio [(Cash + AR + Inventory) / Current Liabilities]
ii. Return on Equity (Net Income / Shareholders’ Equity)
iii. Debt / Total Assets
Page 9 of 9
10. ---------------- ----------------
---------------- ----------------
---------------- ----------------
---------------- ----------------
---------------- ----------------
---------------- ----------------
---------------- ----------------
---------------- ----------------
----------------
---------------- ----------------
---------------- ----------------
---------------- ----------------
---------------- ----------------
---------------- ----------------
----------------
CONSOLIDATED STATEMENT OF FINANCIAL POSITION
TOOTSIE ROLL INDUSTRIES, INC. AND SUBSIDIARIES
(in thousands)
CURRENT ASSETS:
Cash and cash equivalents.....................
Investments...................................
Accounts receivable trade, less allowances of
$2,147 and $2,032.....................
Other receivables.............................
Inventories:
Finished goods and work-in-process............
Raw materials and supplies....................
Prepaid expenses..............................
Deferred income taxes.........................
Total current assets..........................
PROPERTY, PLANT AND EQUIPMENT, at cost:
Land.........................................
Buildings....................................
Machinery and equipment......................
Less--Accumulated depreciation..............
OTHER ASSETS:
Intangible assets, net of accumulated
amortization of $26,917 and $23,497..
Investments.................................
2000
$ 60,882
71,605
23,568
1,230
24,984
16,906
2,685
1,351
203,211
8,327
36,937
183,858
229,122
98,004
131,118
121,263
62,548
Cash surrender value of life insurance and other
December 31,
assets...............................
CURRENT LIABILITIES:
Accounts payable...........................
Dividends payable..........................
Accrued liabilities........................
Income taxes payable.......................
Total current liabilities..................
NONCURRENT LIABILITIES:
Deferred income taxes......................
Postretirement health care and life insurance
benefits...........................
Industrial development bonds...............
Deferred compensation and other liabilities.
Total noncurrent liabilities...............
SHAREHOLDERS' EQUITY:
Common stock, $.69-4/9 par value--
120,000 and 120,000 shares authorized--
32,986 and 32,854, respectively, issued....
Class B common stock, $.69-4/9 par value--
40,000 and 40,000 shares authorized--
16,056 and 15,707, respectively, issued....
Capital in excess of par value.............
Retained earnings .........................
Accumulated other comprehensive earnings (loss)
Treasury stock (at cost)...................
44,302
228,113
$562,442
================
$ 10,296
3,436
33,336
10,378
57,446
12,422
6,956
7,500
19,422
46,300
22,907
11,150
256,698
180,123
(10,190)
(1,992)
458,696
$562,442
1999
$ 88,504
71,002
19,032
5,716
20,689
14,396
3,124
2,069
224,532
7,981
30,330
145,789
184,100
88,203
95,897
85,137
87,167
36,683
208,987
$529,416
================
$ 12,845
3,035
31,945
8,284
56,109
9,520
6,557
7,500
19,084
42,661
22,815
10,908
249,236
158,619
(8,940)
(1,992)
430,646
$529,416
Page 1 of 6
11. ---------------- ---------------- ----------------
---------------- ---------------- ----------------
---------------- ---------------- ----------------
---------------- ---------------- ----------------
---------------- ---------------- ----------------
---------------- ---------------- ----------------
CONSOLIDATED STATEMENT OFEARNINGS,
TOOTSIE ROLL INDUSTRIES, INC. AND SUBSIDIARIES
(in thousands except per share data)
For the year ended December 31,
2000 1999 1998
Net sales..............................
Cost of goods sold.....................
$427,054
207,100
$396,750
192,561
$388,659
187,617
Gross margin........................... 219,954 204,189 201,042
Selling, marketing and administrative
expenses.............................
Provision for bad debts ...............
105,440
365
96,694
270
97,783
288
Amortization of intangible assets...... 3,420 2,706 2,706
Earnings from operations...............
Other income, net......................
110,729
7,079
104,519
6,928
101,265
4,798
Earnings before income taxes...........
Provision for income taxes.............
117,808
42,071
111,447
40,137
106,063
38,537
Net earnings........................... $ 75,737 $ 71,310 $ 67,526
================ ================ ================
Page 2 of 6
12. ----------------
----------------
----------------
--
---------------- ----------------
---------------- ----------------
--
--
--
---------------- ----------------
---------------- ----------------
---------------- ----------------
----------------
----------------
----------------
CONSOLIDATED STATEMENT OF CASH FLOWS
TOOTSIE ROLL INDUSTRIES, INC. AND SUBSIDIARIES
(in thousands)
CASH FLOWS FROM OPERATING ACTIVITIES:
Net earnings.......................
Adjustments to reconcile net
earnings to net cash provided
by operating activities:
Depreciation and
amortization.................
(Gain) loss on retirement of
fixed assets.................
Changes in operating assets and
liabilities, excluding
acquisitions:
Accounts receivable........
Other receivables..........
Inventories................
Prepaid expenses and other
assets...................
Accounts payable and
accrued liabilities......
Income taxes payable and
deferred.................
Postretirement health care
and life insurance
benefits.................
Deferred compensation and
other liabilities........
Other......................
Net cash provided by operating
activities.......................
CASH FLOWS FROM INVESTING ACTIVITIES:
Acquisitions of businesses, net of
cash acquired....................
Capital expenditures...............
Purchase of held to maturity
securities.......................
Maturity of held to maturity
securities.......................
Purchase of available for sale
securities.......................
Sale and maturity of available for
sale securities..................
Net cash used in investing
activities.......................
CASH FLOWS FROM FINANCING ACTIVITIES:
Issuance of notes payable..........
Repayments of notes payable........
Treasury stock purchases...........
Shares repurchased and retired.....
Dividends paid in cash.............
Net cash used in financing
activities.......................
Increase (decrease) in cash and cash
equivalents..........................
Cash and cash equivalents at beginning
of year..............................
Cash and cash equivalents at end of
year.................................
For the year ended December 31,
2000
$75,737
13,314
(46)
(4,460)
4,486
(768)
(7,903)
(1,717)
5,691
399
337
(189)
84,881
(74,293)
(16,189)
(156,322)
176,576
(78,993)
82,754
(66,467)
43,625
(43,625)
(32,945)
(13,091)
(46,036)
(27,622)
88,504
$60,882
================
1999
$71,310
9,979
(43)
400
(2,392)
1,592
(15,672)
968
2,232
412
4,162
(13)
72,935
(20,283)
(238,949)
235,973
(117,694)
113,960
(26,993)
(1,019)
(25,850)
(11,313)
(38,182)
7,760
80,744
$88,504
================
Page 3 of 6
13. WILLIAM WRIGLEY JR
CONSOLIDATED BALANCE SHEET
In thousands of dollars
ASSETS
Current assets:
Cash and cash equivalents
Short-term investments, at amortized cost
Accounts receivable
(less allowance for doubtful accounts: 2000 - $8,186; 1999 - $9,194)
Inventories
Finished goods
Raw materials and supplies
Other current assets
Deferred income taxes - current
Total current assets
Marketable equity securities, at fair value
Deferred charges and other assets
Deferred income taxes - noncurrent
Property, plant and equipment, at cost:
Land
Buildings and building equipment
Machinery and equipment
Less accumulated depreciation
Net property, plant and equipment
TOTAL ASSETS
LIABILITIES AND STOCKHOLDERS' EQUITY
Current liabilities:
Accounts payable
Accrued expenses
Dividends payable
Income and other taxes payable
Deferred income taxes - current
Total current liabilities
Deferred income taxes - noncurrent
Other noncurrent liabilities
Stockholders' equity:
Common Stock - no par value
Common Stock
Authorized: 400,000 shares
Issued: 2000 - 94,184 shares; 1999 - 93,607 shares
Class B Common Stock - convertible
Authorized: 80,000 shares
Issued and outstanding:
2000 - 22,037 shares; 1999 - 22,614 shares
Additional paid-in capital
Retained earnings
Common Stock in treasury, at cost
(2000 - 3,459 shares; 1999 - 1,725 shares)
Accumulated other comprehensive income
Foreign currency translation adjustment
Unrealized holding gains on marketable equity securities
Total stockholders' equity
TOTAL LIABILITIES AND STOCKHOLDERS' EQUITY
2000 1999
$ 300,599 288,386
29,301 18,528
191,570 181,720
64,676 60,885
188,615 196,785
253,291 257,670
39,728 42,301
14,226 15,141
828,715 803,746
28,535 43,201
83,713 114,796
26,743 26,862
39,125
344,457
756,050
1,139,632
37,527
312,663
712,585
1,062,775
532,598 503,635
607,034 559,140
$1,574,740 1,547,745
$ 94,377 86,583
92,531 74,816
39,467 40,073
60,976 49,654
859 699
288,210 251,825
40,144 44,963
113,489 112,182
12,558 12,481
2,938
346
1,492,547
3,015
273
1,322,137
(256,478) (125,712)
(136,365)
17,351
(119,014)
(100,270)
26,851
(73,419)
1,132,897 1,138,775
$ 1,574,740 $1,547,745
Page 4 of 6
14. -- --
WILLIAM WRIGLEY JR
CONSOLIDATED STATEMENT OF EARNINGS
In thousands of dollars except for per share amounts
2000
EARNINGS
Net sales $ 2,145,706
Cost of sales 904,266
Gross profit 1,241,440
Selling and general administrative 778,197
Gain related to factory sale
Operating income 463,243
Investment income 19,185
Other expense (3,116)
Earnings before income taxes 479,312
Income taxes 150,370
Net earnings $ 328,942
1999
2,061,602
904,183
1,157,419
721,813
435,606
17,636
(8,812)
444,430
136,247
308,183
1998
2,004,719
894,988
1,109,731
687,747
(10,404)
432,388
18,636
(10,145)
440,879
136,378
304,501
Page 5 of 6
15. -- --
WILLIAM WRIGLEY JR
CONSOLIDATED STATEMENT OF CASH FLOWS
In thousands of dollars
2000 1999 1998
OPERATING ACTIVITIES
Net earnings $ 328,942 308,183 304,501
Adjustments to reconcile net earnings to net cash
provided by operating activities:
Depreciation 57,880 61,225 55,774
(Gain) Loss on sales of retired property, plant and equipment 778 390 168
Gain related to factory sale (10,404)
(Increase) Decrease in:
Accounts receivable (18,483) (21,174) (12,297)
Inventories (2,812) (9,894) (6,299)
Other current assets 199 2,807 1,310
Other assets and deferred charges 30,408 (22,277) (17,350)
Increase (Decrease) in:
Accounts payable 11,068 13,519 4,499
Accrued expenses 19,935 9,734 (3,869)
Income and other taxes payable 14,670 2,649 (4,445)
Deferred income taxes 2,546 2,024 9,826
Other noncurrent liabilities 3,152 10,850 2,433
Net cash provided by operating activities 448,283 358,036 323,847
INVESTING ACTIVITIES
Additions to property, plant and equipment (107,680) (127,733) (148,027)
Proceeds from property retirements 1,128 7,909 10,662
Purchases of short-term investments (143,116) (32,078) (109,292)
Maturities of short-term investments 115,007 150,300 92,676
Net cash used in investing activities (134,661) (1,602) (153,981)
FINANCING ACTIVITIES
Dividends paid (159,138) (153,812) (150,835)
Common Stock purchased (131,765) (121,268) (7,679)
Net cash used in financing activities (290,903) (275,080) (158,514)
Effect of exchange rate changes on cash and cash equivalents (10,506) (7,540) (3,407)
Net increase in cash and cash equivalents 12,213 73,814 7,945
Cash and cash equivalents at beginning of year 288,386 214,572 206,627
Cash and cash equivalents at end of year $ 300,599 288,386 214,572
Page 6 of 6
16. Event/Transaction Statement of Cash Flows
a) Receives $50,000 cash for orders which will be delivered during the next fiscal year. Operating Section
The company acquires $30,000 of inventory on acount to fill these orders. Net Income 0
+ Increase in Adv from Cust. 50,000
Cash (A) + Inv (A) = AP + Adv from Cust. (L) + RE (E)
+50,000 +30,000 +30,000 +50,000
+Increase in AP 30,000
-Increase in Inventory -30,000
CFO +50,000
b) The company delivers all the goods ordered in (1). Operating Section
Net Income 20,000
Cash (A) + Inv (A) = Adv from Cust. (L) + RE (E)
- 30,000 -50,000 +20,000
- Increase in Adv from Cust. -50,000
+Decrease in Inventory +30,000
CFO 0
c) Warehouse flooding ruins $5,000 of inventory which is thrown away. No provision
had been made for damaged inventory.
Inventory (A) = RE (E)
-5,000 -5,000
Operating Section
Net Income -5,000
+Decrease in Inventory + 5,000
CFO 0
d) The company rents office space for one year, paying the entire year’s rent of $12,000 Operating Section
in advance and recognizing the first month’s rental expense. Net Income -1,000
- Increase in Prpd. Rent -11,000
Cash (A) + Prepaid Rent (A) = RE (E)
-12,000 +11,000 -1,000 CFO -12,000
e) The company borrows $15,000 from the bank and purchases office equipment for
$10,000 cash.
CFO 0
Cash (A) + PPE (A) = Debt(L)
5,000 +10,000 +15,000
CFI
Purchase of PPE -10,000
CFF
Borrow +15,000
Net Cash Flow +5,000
Page 1 of 5
SOLUTIONS
17. Question 2: Accounts Receivable (16 Points)
The following is an excerpt from the 10-K of Tootsie Roll Industries Inc.:
Tootsie Roll Industries, Inc. and its consolidated subsidiaries (the
"Company") have been engaged in the manufacture and sale of candy for over 100
years. This is the only industry segment in which the Company operates and is
its only line of business. The majority of the Company's products are sold under
the registered trademarks TOOTSIE ROLL, TOOTSIE ROLL POPS, CHILD'S PLAY, CARAMEL
APPLE POPS, CHARMS, BLOW-POP, BLUE RAZZ, ZIP-A-DEE-DOO-DA POPS, CELLA'S, MASON
DOTS, MASON CROWS, JUNIOR MINT, CHARLESTON CHEW, SUGAR DADDY, SUGAR BABIES,
ANDES AND FLUFFY STUFF.
Please refer to the financial statements for Tootsie for additional information. Assume all sales
are on account and there are no deferred revenues.
a. (3 points) What is the gross amount of Tootsie Roll's accounts receivable at the end of 2000?
(23,568 + 1,230) + 2,147 = 27,945
we also accepted
23,568 + 2,147 = 25,715 which omitted the “other receivables”
b. (4 points) What percentage of these receivables does management estimate to be
uncollectible? How does this compare with 1999?
2000: 2,147 / 25,715 = 8.3%
1999: 2,032 / (2,032 + 19,032) = 9.6%
Tootsie Roll has a lower percent of uncollectible accounts in 2000 vs. 1999, therefore
they believe they will be collecting more receivables.
c. (5 points) Using the balance sheet equation format or journal entries, reconstruct the
transactions for (a) bad debt expense and (b) the actual write-offs of uncollectible accounts
for the year ended December 31, 2000.
A/R -ADA = R.E.
-2,032
(a) -365 -365 (Bad Debt Expense from I/S)
(b) -250 +250**
-2,147
** 2,032 + 365 – 2,147 = 250
d. (4 points) Estimate the amount of cash Tootsie Roll collected from customers in 2000.
Using Account Receivable (Gross):
BB + Sales – Write Offs – EB = Cash Collections
(19,023 + 2,032) + 427,054 – 250 – (23,568 + 2,147) = 422,153
Page 2 of 5
18. Question 3: Inventory (15 points)
Please refer to the financial statements for Tootsie Roll for additional information. The following
footnote appears in Tootsie Roll’s 2000 10K:
INVENTORIES:
Inventories are stated at cost, not in excess of market. The cost of domestic
inventories ($37,505 and $29,111 at December 31, 2000 and 1999, respectively)
has been determined by the last-in, first-out (LIFO) method. The excess of
current cost over LIFO cost of inventories approximates $2,993 and $5,008 at
December 31, 2000 and 1999, respectively.
a) (3 points) What is the 2000 LIFO reserve?
$2,993
b) (4 points) Did Tootsie Roll experience inflation or deflation in raw materials costs during
2000? Provide evidence in support of your answer.
Change in LIFO Reserve = Inflation (Deflation) + Effect of Layer Dipping
(2,993 – 5,008) = X + 0
x = -2,105 thus deflation
c) (8 points) Compute Tootsie Roll's inventory turnover (COGS / Average Inventory) in 2000
under LIFO. Compute inventory turnover under FIFO. Which measure gives the more
accurate economic picture of Tootsie Roll’s performance? Why?
LIFO FIFO
207,100 207,100 - (2,993 – 5008) = 209,115
(41,890 + 35,085)/2 (41,890 + 2,993 + 35,085 + 5,008)/2
= 5.38 = 4.92
using domestic inventories only:
LIFO
207,100
(37,505 + 29,111)/2
= 6.22
FIFO
207,100 - (2,993 – 5008) = 209,115
(37,505 + 2,993 + 29,111 + 5,008)/2
= 5.61
FIFO is considered a better measure of economic performance because it matches
somewhat current costs in COGS to current costs in Inventory. LIFO has more distortion
because it matches current costs in COGS to older costs in Inventory.
Page 3 of 5
19. Question 4: Long-Lived Assets (14 points)
The following is an excerpt from the 10-K of William Wrigley Jr. Co’s for 2000:
The consolidated financial statements include the accounts of the Wm. Wrigley Jr.
Company and its associated companies (the Company). The Company's principal
business is manufacturing and selling chewing gum. All other businesses constitute
less than 10% of combined revenues, operating profit and identifiable assets.
Please refer to Wrigley’s balance sheet, statement of operations, and statement of cash flows when
answering the following questions.
a. (3 points) What was the gain or loss associated with the sale of property, plant and equipment in
2000? Be sure to specify whether it was a gain or a loss.
$778 loss
b. (3 points) Record the transaction (you may use either the balance sheet equation format or
journal entries) for the depreciation of property, plant and equipment for Wrigley for 2000?
PPE (A) - Accum. Depreciation (XA) = Retained Earnings (E)
57,880 -57,880
c. (8 points) In addition to selling PP&E, Wrigley purchased some PP&E. Record the transactions
for (a) the purchase and (b) sale of retired PP&E. There were no non-cash purchases in 2000.
Cash + PPE - AD = RE
BB 1,062,775 -503,635
-57,880
(a) -107,680 +107,680
(b) 1,128 -30,823* +28,917** -778
EB 1,139,632 -532,598
* 1,062,775 + 107,680 – 1,139,632
** -503,635 – 57,880 + 532,598
Page 4 of 5
20. Question 5: Miscellaneous (15 points)
Please refer to both Tootsie Roll’s and Wrigley’s financial statements when answering the following
questions.
a. (6 points) Calculate the components of return on assets (using the formulas below) for Tootsie
Roll and Wrigley for 2000. Use ending balances (vs. average balances) for the balance sheet
accounts.
ROA = Profitability x Asset Turnover
Net Income = Net Income x Sales
Assets Sales Assets
Tootsie Roll 13.5% 0.177 0.759
75,737 / 562,442 75,737 / 427,054 427,054 / 562,442
Wrigley 20.9% 0.153 1.36
328,942 / 1,574,740 328,942 / 2,145,706 2,145,706 / 1,574,740
b. (3 points) Which company generates higher returns from its assets? What is the source of the
higher returns?
Wrigley. Though it has lower profit margin (profit per $ of sales), the company
generates more sales per $ of assets.
c. (6 points) Suppose it is determined in 2001 that Junior Mints cause amnesia in MBA students.
Tootsie Roll must reduce the value of intangible assets (the Junior Mints brand name) by $20
million. What would be the effect on each of the following ratios (increase, decrease, no effect)?
NO EFFECT Quick Ratio [(Cash + AR + Inventory) / Current Liabilities]
(Cash/AR/Inv no effect, Current Liabilities no effect)
DECREASE Return on Equity (Net Income / Shareholders’ Equity)
(NI decrease $20, SE decrease $20)
INCREASE Debt / Total Assets
(Debt no effect, Assets decrease $20)
Page 5 of 5