![NAME : ANUSHA GOSWAMI
ROLL NO. : 16010121061
DIV: A BATCH: A3
K. J. Somaiya College of Engineering, Mumbai – 400 077
(A Constituent College of Somaiya Vidyavihar University)
Dept. of Science and Humanities
F.Y. B. Tech. Semester–II (2021-22)
Applied Mathematics-II IA-II
In December 2019 an outbreak of atypical
pneumonia (COVID-19) occurred in Wuhan,
the capital of Hubei Province in mainland
China, that was attributed to a novel
coronavirus of zoonotic origin [severe acute
respiratory syndrome coronavirus 2 (SARS-
CoV-2)]. The outbreak spread rapidly, with
over 50,000 cases and 1,000 deaths reported
domestically and 603 cases globally,
surpassing the 2003 outbreak of the severe
acute respiratory syndrome (SARS).
To contain the outbreak, China implemented
unprecedented intervention strategies on 23
January, 2020. Whole cities were quarantined, the
national holiday was extended, strict measures
limiting travel and public gatherings were
introduced, public spaces were closed and
rigorous temperature monitoring was
implemented nationwide. These control
measures have caused significant disruption to
the social and economic structure in China and
globally.
However, it is unknown whether these policies have
had an impact, and how long they should remain in
place. It is thus critical to assess the effects of these
control measures on the epidemic progression for the
benefit of global expectation. Here, we used a
modified susceptible-exposed-infected-removed
(SEIR) epidemiological model that incorporates the
domestic migration data before and after January 23
and the most recent COVID-19 epidemiological data
to predict the epidemic progression.
Sensitivity of epidemic curve to the change incubation period, σ.
We found that the epidemic of China should peak by
late February, showing gradual decline by end of
April. Lifting the Hubei quarantine would lead to a
second epidemic peak in Hubei province in mid-
March and extend the epidemic to late April.
Our dynamic SEIR model was effective in predicting
the COVID-19 epidemic peaks and sizes. The
implementation of control measures on January 23
2020 was indispensable in reducing the eventual
COVID-19 epidemic size.
References:-
https://docs.idmod.org/projects/emod-hiv/en/latest/model-
seir.html
https://sites.me.ucsb.edu/~moehlis/APC514/tutorials/tutorial_sea
sonal/node4.html
https://jtd.amegroups.com/article/view/36385/html](data:image/gif;base64,R0lGODlhAQABAIAAAAAAAP///yH5BAEAAAAALAAAAAABAAEAAAIBRAA7)
Recommended
Recommended
More Related Content
Similar to Anusha Goswami_A3_16010121061_AM-II_IA-II.pdf
Similar to Anusha Goswami_A3_16010121061_AM-II_IA-II.pdf (20)
Recently uploaded
Recently uploaded (20)
Anusha Goswami_A3_16010121061_AM-II_IA-II.pdf
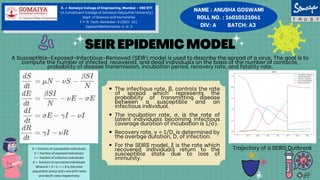
- 1. NAME : ANUSHA GOSWAMI ROLL NO. : 16010121061 DIV: A BATCH: A3 The infectious rate, β, controls the rate of spread which represents the probability of transmitting disease between a susceptible and an infectious individual. The incubation rate, σ, is the rate of latent individuals becoming infectious (average duration of incubation is 1/σ). Recovery rate, γ = 1/D, is determined by the average duration, D, of infection. For the SEIRS model, ξ is the rate which recovered individuals return to the susceptible state due to loss of immunity. K. J. Somaiya College of Engineering, Mumbai – 400 077 (A Constituent College of Somaiya Vidyavihar University) Dept. of Science and Humanities F.Y. B. Tech. Semester–II (2021-22) Applied Mathematics-II IA-II S = fraction of susceptible individuals E = fraction of exposed individuals I = fraction of infective individuals R = fraction of recovered individuals Where N = S + E + I + R is the total population and μ and ν are birth rates and death rates respectively. SEIREPIDEMICMODEL A Susceptible-Exposed-Infectious-Removed (SEIR) model is used to describe the spread of a virus. The goal is to compute the number of infected, recovered, and dead individuals on the basis of the number of contacts, probability of disease transmission, incubation period, recovery rate, and fatality rate. Trajectory of a SEIRS Outbreak
- 2. NAME : ANUSHA GOSWAMI ROLL NO. : 16010121061 DIV: A BATCH: A3 K. J. Somaiya College of Engineering, Mumbai – 400 077 (A Constituent College of Somaiya Vidyavihar University) Dept. of Science and Humanities F.Y. B. Tech. Semester–II (2021-22) Applied Mathematics-II IA-II In December 2019 an outbreak of atypical pneumonia (COVID-19) occurred in Wuhan, the capital of Hubei Province in mainland China, that was attributed to a novel coronavirus of zoonotic origin [severe acute respiratory syndrome coronavirus 2 (SARS- CoV-2)]. The outbreak spread rapidly, with over 50,000 cases and 1,000 deaths reported domestically and 603 cases globally, surpassing the 2003 outbreak of the severe acute respiratory syndrome (SARS). To contain the outbreak, China implemented unprecedented intervention strategies on 23 January, 2020. Whole cities were quarantined, the national holiday was extended, strict measures limiting travel and public gatherings were introduced, public spaces were closed and rigorous temperature monitoring was implemented nationwide. These control measures have caused significant disruption to the social and economic structure in China and globally. However, it is unknown whether these policies have had an impact, and how long they should remain in place. It is thus critical to assess the effects of these control measures on the epidemic progression for the benefit of global expectation. Here, we used a modified susceptible-exposed-infected-removed (SEIR) epidemiological model that incorporates the domestic migration data before and after January 23 and the most recent COVID-19 epidemiological data to predict the epidemic progression. Sensitivity of epidemic curve to the change incubation period, σ. We found that the epidemic of China should peak by late February, showing gradual decline by end of April. Lifting the Hubei quarantine would lead to a second epidemic peak in Hubei province in mid- March and extend the epidemic to late April. Our dynamic SEIR model was effective in predicting the COVID-19 epidemic peaks and sizes. The implementation of control measures on January 23 2020 was indispensable in reducing the eventual COVID-19 epidemic size. References:- https://docs.idmod.org/projects/emod-hiv/en/latest/model- seir.html https://sites.me.ucsb.edu/~moehlis/APC514/tutorials/tutorial_sea sonal/node4.html https://jtd.amegroups.com/article/view/36385/html