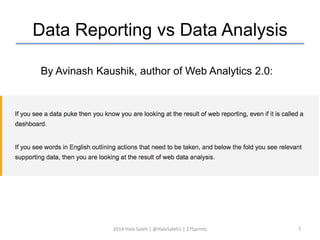
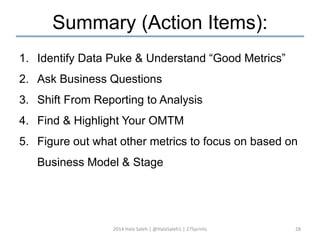
Be a data hero 
And drive business results 
Hala saleh
Be A Data Hero! 
• Intro 
• Don’t Be a Data Puker 
• Metrics: The Good, The Bad, & The 
Ugly 
• Lean Analytics & “The One Metric 
That Matters” 
• Other Metrics Matter Too 
2014 Hala Saleh | @HalaSaleh1 | 27Sprints 2
What does progress look like? 
# Subscriptions 
2014 Hala Saleh | @HalaSaleh1 | 27Sprints 3 
10 
76 
231 
567 
819 
900 
800 
700 
600 
500 
400 
300 
200 
100 
0 
Month1 Month2 Month3 Month4 Month5
100% of us lie to 
ourselves 
2014 Hala Saleh | @HalaSaleh1 | 27Sprints 4
“My Tweet got 13 Retweets. 
I NAILED it (and am a genius).” 
“My FB status got 231 Likes. 
I am kind of a big deal.” 
100% of us lie to 
ourselves 
2014 Hala Saleh | @HalaSaleh1 | 27Sprints 5 
“We’re killing it!” 
“The market isn’t ready.” 
“Our user base has increased 
100% We’re on a solid growth path.” 
“We got 10K views this week. 
Conversion will be a breeze!”
Data 
DON’T BE A DATA PUKER 
2014 Hala Saleh | @HalaSaleh1 | 27Sprints 6
Data Reporting vs Data Analysis 
By Avinash Kaushik, author of Web Analytics 2.0: 
2014 Hala Saleh | @HalaSaleh1 | 27Sprints 7
Data Puke 
* From www.kaushik.net/avinash 
2014 Hala Saleh | @HalaSaleh1 | 27Sprints 8
Not-Data-Puke 
* From www.kaushik.net/avinash 
2014 Hala Saleh | @HalaSaleh1 | 27Sprints 9
Break The Reporting Lifecycle 
Typical reporting lifecycle: 
Boss asks for specific 
metrics 
You find out how to 
Nothing happens 
You report the get the datas 
requested metrics 
2014 Hala Saleh | @HalaSaleh1 | 27Sprints 10
Break The Reporting Lifecycle 
Typical reporting lifecycle: 
Boss asks for specific 
metrics 
You find out how to 
Nothing happens 
You report the get the datas 
requested metrics 
2014 Hala Saleh | @HalaSaleh1 | 27Sprints 11 
Break 
This!
Rebel! Ask Business Qs! 
• Asking the right questions 
2014 Hala Saleh | @HalaSaleh1 | 27Sprints 12 
provides context. 
• Data analysis should lead to 
Actions & Business Decisions. 
• Exercise: In groups, list 3 to 5 
good business qs. 
REBEL 
WITH A CAUSE 
(Hint: Good Business Qs require analysis that leads to actions.)
METRICS: THE GOOD, THE 
BAD, & THE UGLY 
2014 Hala Saleh | @HalaSaleh1 | 27Sprints 13
Good Metrics 
1) Comparable: 
“90% click-through rate”, or “Decreased click-through rate”? 
2) Understandable: 
Ever heard “What the heck are search impressions?” 
Mmhmm. 
3) Ratios: 
“Purchases per free account” & “Purchases per paid account”, or 
“Purchases”? 
AND 
2014 Hala Saleh | @HalaSaleh1 | 27Sprints 14
Good metrics (Cont’d) 
4) They 
Change 
the way 
We 
Behave 
2014 Hala Saleh | @HalaSaleh1 | 27Sprints 15
Bad metrics 
Quiz: So what are characteristics or examples of ‘bad 
metrics’? 
Probably: Not comparable, not contextual, don’t 
answer a specific business question, not 
understandable by audience. 
Definitely: Bad if they are the wrong metric to 
track at the wrong time. 
2014 Hala Saleh | @HalaSaleh1 | 27Sprints 16
Ugly Metrics 
Now you’re just being mean. 
Stop calling people (and metrics) 
names. 
2014 Hala Saleh | @HalaSaleh1 | 27Sprints 17
LEAN ANALYTICS & 
THE ONE METRIC THAT MATTERS 
2014 Hala Saleh | @HalaSaleh1 | 27Sprints 18
Lean Analytics 
FAQ: 
1. Do “lean analytics” qualify as “big data”? 
2. But I don’t work for a startup, is this 
section for me? 
3. Wait. What are “Lean Analytics”? 
2014 Hala Saleh | @HalaSaleh1 | 27Sprints 19
Choosing the right metrics 
5 Things To Consider: 
1. Qualitative vs. Quantitative Metrics 
2. Vanity vs. Actionable Metrics 
3. Exploratory vs. Reporting Metrics 
4. Leading vs. Lagging Metrics 
5. Correlated vs. Causal Metrics 
2014 Hala Saleh | @HalaSaleh1 | 27Sprints 20
The One Metric That Matters 
• With a startup or a new product, FOCUS pays off. 
• Finding the One Metric That Matters (OMTM) doesn’t 
mean ignoring other metrics and KPIs. 
• It DOES mean identifying the ONE metric that you 
focus on ABOVE ALL OTHERS for your current stage 
& Business Model. 
2014 Hala Saleh | @HalaSaleh1 | 27Sprints 21
Why Have an OMTM? 
4 Good Reasons to Have an OMTM*: 
1. It answers the most important question you have 
2. It forces clear goal-setting and thresholds 
3. It focuses the entire company or team 
4. It creates a culture of experimentation 
* From Lean Analytics: Use Data to Build a Better Startup Faster 
2014 Hala Saleh | @HalaSaleh1 | 27Sprints 22
Other Metrics Matter Too 
Your business model and Stage inform the metrics you 
should focus on & track. 
2014 Hala Saleh | @HalaSaleh1 | 27Sprints 23 
Ex Business Models: 
1- E-Commerce 
2- SaaS 
3- Free Mobile App 
4- User-Generated 
Content 
Ex Business Stages: 
1- Empathy (Awareness) 
2- Stickiness 
3- Virality 
4- Revenue 
5- Scale
EXAMPLEEXAMPLE 
CASE STUDIES 
(SOME EXAMPLES) 
2014 Hala Saleh | @HalaSaleh1 | 27Sprints 24
Free Mobile App 
Metrics to Focus On: Free Mobile Apps: 
- Downloads (Includes App store Analytics) 
- Customer Acquisition Cost 
- Launch Rate 
- % of Active Users 
- % of Paying Users 
- Avg. Revenue Per User 
- Churn 
- Virality 
2014 Hala Saleh | @HalaSaleh1 | 27Sprints 25
E-Commerce 
Metrics to Focus On: E-Commerce Businesses: 
- Conversion Rate 
- Purchases per time period 
- Abandonment % 
- Revenue Per Customer 
- Top Search Terms 
- Virality 
2014 Hala Saleh | @HalaSaleh1 | 27Sprints 26
SaaS 
Metrics to Focus On: SaaS Businesses: 
- Acquisition + Retention 
- Activation 
- Stickiness 
- Conversion 
- Churn 
# Subscriptions 
10 
76 
231 
567 
819 
900 
800 
700 
600 
500 
400 
300 
200 
100 
0 
2014 Hala Saleh | @HalaSaleh1 | 27Sprints 27
Summary (Action Items): 
1. Identify Data Puke & Understand “Good Metrics” 
2. Ask Business Questions 
3. Shift From Reporting to Analysis 
4. Find & Highlight Your OMTM 
5. Figure out what other metrics to focus on based on 
Business Model & Stage 
2014 Hala Saleh | @HalaSaleh1 | 27Sprints 28
Q & A 
2014 Hala Saleh | @HalaSaleh1 | 27Sprints 29 
? 
? 
? 
?
Hello my name is: Hala 
Just launched! 
27Sprints: hands-on product success using 
lean startup & agile. 
2014 Hala Saleh | @HalaSaleh1 | 27Sprints 30
Thank you Sponsors!

Be a Data Hero and Drive Business Results

  • 1.
    Be a datahero And drive business results Hala saleh
  • 2.
    Be A DataHero! • Intro • Don’t Be a Data Puker • Metrics: The Good, The Bad, & The Ugly • Lean Analytics & “The One Metric That Matters” • Other Metrics Matter Too 2014 Hala Saleh | @HalaSaleh1 | 27Sprints 2
  • 3.
    What does progresslook like? # Subscriptions 2014 Hala Saleh | @HalaSaleh1 | 27Sprints 3 10 76 231 567 819 900 800 700 600 500 400 300 200 100 0 Month1 Month2 Month3 Month4 Month5
  • 4.
    100% of uslie to ourselves 2014 Hala Saleh | @HalaSaleh1 | 27Sprints 4
  • 5.
    “My Tweet got13 Retweets. I NAILED it (and am a genius).” “My FB status got 231 Likes. I am kind of a big deal.” 100% of us lie to ourselves 2014 Hala Saleh | @HalaSaleh1 | 27Sprints 5 “We’re killing it!” “The market isn’t ready.” “Our user base has increased 100% We’re on a solid growth path.” “We got 10K views this week. Conversion will be a breeze!”
  • 6.
    Data DON’T BEA DATA PUKER 2014 Hala Saleh | @HalaSaleh1 | 27Sprints 6
  • 7.
    Data Reporting vsData Analysis By Avinash Kaushik, author of Web Analytics 2.0: 2014 Hala Saleh | @HalaSaleh1 | 27Sprints 7
  • 8.
    Data Puke *From www.kaushik.net/avinash 2014 Hala Saleh | @HalaSaleh1 | 27Sprints 8
  • 9.
    Not-Data-Puke * Fromwww.kaushik.net/avinash 2014 Hala Saleh | @HalaSaleh1 | 27Sprints 9
  • 10.
    Break The ReportingLifecycle Typical reporting lifecycle: Boss asks for specific metrics You find out how to Nothing happens You report the get the datas requested metrics 2014 Hala Saleh | @HalaSaleh1 | 27Sprints 10
  • 11.
    Break The ReportingLifecycle Typical reporting lifecycle: Boss asks for specific metrics You find out how to Nothing happens You report the get the datas requested metrics 2014 Hala Saleh | @HalaSaleh1 | 27Sprints 11 Break This!
  • 12.
    Rebel! Ask BusinessQs! • Asking the right questions 2014 Hala Saleh | @HalaSaleh1 | 27Sprints 12 provides context. • Data analysis should lead to Actions & Business Decisions. • Exercise: In groups, list 3 to 5 good business qs. REBEL WITH A CAUSE (Hint: Good Business Qs require analysis that leads to actions.)
  • 13.
    METRICS: THE GOOD,THE BAD, & THE UGLY 2014 Hala Saleh | @HalaSaleh1 | 27Sprints 13
  • 14.
    Good Metrics 1)Comparable: “90% click-through rate”, or “Decreased click-through rate”? 2) Understandable: Ever heard “What the heck are search impressions?” Mmhmm. 3) Ratios: “Purchases per free account” & “Purchases per paid account”, or “Purchases”? AND 2014 Hala Saleh | @HalaSaleh1 | 27Sprints 14
  • 15.
    Good metrics (Cont’d) 4) They Change the way We Behave 2014 Hala Saleh | @HalaSaleh1 | 27Sprints 15
  • 16.
    Bad metrics Quiz:So what are characteristics or examples of ‘bad metrics’? Probably: Not comparable, not contextual, don’t answer a specific business question, not understandable by audience. Definitely: Bad if they are the wrong metric to track at the wrong time. 2014 Hala Saleh | @HalaSaleh1 | 27Sprints 16
  • 17.
    Ugly Metrics Nowyou’re just being mean. Stop calling people (and metrics) names. 2014 Hala Saleh | @HalaSaleh1 | 27Sprints 17
  • 18.
    LEAN ANALYTICS & THE ONE METRIC THAT MATTERS 2014 Hala Saleh | @HalaSaleh1 | 27Sprints 18
  • 19.
    Lean Analytics FAQ: 1. Do “lean analytics” qualify as “big data”? 2. But I don’t work for a startup, is this section for me? 3. Wait. What are “Lean Analytics”? 2014 Hala Saleh | @HalaSaleh1 | 27Sprints 19
  • 20.
    Choosing the rightmetrics 5 Things To Consider: 1. Qualitative vs. Quantitative Metrics 2. Vanity vs. Actionable Metrics 3. Exploratory vs. Reporting Metrics 4. Leading vs. Lagging Metrics 5. Correlated vs. Causal Metrics 2014 Hala Saleh | @HalaSaleh1 | 27Sprints 20
  • 21.
    The One MetricThat Matters • With a startup or a new product, FOCUS pays off. • Finding the One Metric That Matters (OMTM) doesn’t mean ignoring other metrics and KPIs. • It DOES mean identifying the ONE metric that you focus on ABOVE ALL OTHERS for your current stage & Business Model. 2014 Hala Saleh | @HalaSaleh1 | 27Sprints 21
  • 22.
    Why Have anOMTM? 4 Good Reasons to Have an OMTM*: 1. It answers the most important question you have 2. It forces clear goal-setting and thresholds 3. It focuses the entire company or team 4. It creates a culture of experimentation * From Lean Analytics: Use Data to Build a Better Startup Faster 2014 Hala Saleh | @HalaSaleh1 | 27Sprints 22
  • 23.
    Other Metrics MatterToo Your business model and Stage inform the metrics you should focus on & track. 2014 Hala Saleh | @HalaSaleh1 | 27Sprints 23 Ex Business Models: 1- E-Commerce 2- SaaS 3- Free Mobile App 4- User-Generated Content Ex Business Stages: 1- Empathy (Awareness) 2- Stickiness 3- Virality 4- Revenue 5- Scale
  • 24.
    EXAMPLEEXAMPLE CASE STUDIES (SOME EXAMPLES) 2014 Hala Saleh | @HalaSaleh1 | 27Sprints 24
  • 25.
    Free Mobile App Metrics to Focus On: Free Mobile Apps: - Downloads (Includes App store Analytics) - Customer Acquisition Cost - Launch Rate - % of Active Users - % of Paying Users - Avg. Revenue Per User - Churn - Virality 2014 Hala Saleh | @HalaSaleh1 | 27Sprints 25
  • 26.
    E-Commerce Metrics toFocus On: E-Commerce Businesses: - Conversion Rate - Purchases per time period - Abandonment % - Revenue Per Customer - Top Search Terms - Virality 2014 Hala Saleh | @HalaSaleh1 | 27Sprints 26
  • 27.
    SaaS Metrics toFocus On: SaaS Businesses: - Acquisition + Retention - Activation - Stickiness - Conversion - Churn # Subscriptions 10 76 231 567 819 900 800 700 600 500 400 300 200 100 0 2014 Hala Saleh | @HalaSaleh1 | 27Sprints 27
  • 28.
    Summary (Action Items): 1. Identify Data Puke & Understand “Good Metrics” 2. Ask Business Questions 3. Shift From Reporting to Analysis 4. Find & Highlight Your OMTM 5. Figure out what other metrics to focus on based on Business Model & Stage 2014 Hala Saleh | @HalaSaleh1 | 27Sprints 28
  • 29.
    Q & A 2014 Hala Saleh | @HalaSaleh1 | 27Sprints 29 ? ? ? ?
  • 30.
    Hello my nameis: Hala Just launched! 27Sprints: hands-on product success using lean startup & agile. 2014 Hala Saleh | @HalaSaleh1 | 27Sprints 30
  • 31.

Editor's Notes

  • #4 If # of subscriptions is increasing month over month, is that a guaranteed indicator of progress? Discuss (5 min) We’ll come back to this chart later
  • #5 - "We're killing it!" - "The market isn't ready." - "We're totally shipping on time." "Our user base has increased by 100%! We're on a solid growth path.” My facebook status got 231 Likes, I am Such A Big Deal My Tweet got 13 Retweets, I must be a genius - "We're about to close a HUGE deal." - "We aren't looking for funding."
  • #6 - "We're killing it!" - "The market isn't ready." - "We're totally shipping on time." "Our user base has increased by 100%! We're on a solid growth path.” My facebook status got 231 Likes, I am Such A Big Deal My Tweet got 13 Retweets, I must be a genius - "We're about to close a HUGE deal." - "We aren't looking for funding."
  • #7 * Also, don’t Google the word “puke”.
  • #8 Data puke is just a list of metrics, graphs, charts that do not relate or show or indicate a specific action to take
  • #11 Managers/bosses/execs typically think they know what metrics/#s will give them the right insights Sadly, that leads to a cycle where managers/execs ask for a list of metrics, like: I need to know how much traffic we’re getting I need to know the conversion rate on our funnel I need our bounce rate I need to know what our top referrer sites/channels were What do these have in common? All of the above “needs” do not state a specific business question
  • #12 Managers/bosses/execs typically think they know what metrics/#s will give them the right insights Sadly, that leads to a cycle where managers/execs ask for a list of metrics, like: I need to know how much traffic we’re getting I need to know the conversion rate on our funnel I need our bounce rate I need to know what our top referrer sites/channels were What do these have in common? All of the above “needs” do not state a specific business question
  • #13 EVERY business is unique, and so you need to be the voice of data reason and help your business owners ask the RIGHT questions that YOU can help answer Be the protector of the data’s integrity and value by demonstrating SMART data analysis When asked for specific metrics, turn the conversation around. Ask for questions that will require custom reporting, advanced segmentation, statistics, surveys, intelligence tools, and insights. This is similar to why successful software teams understand the reason/business need behind specific requirements. Then they can be creative about the solutions they deliver, vs. providing a standard, one-size-doesn’t-fit-all solution to a unique problem because they were given a requirement without business context. Examples: How do I improve revenue on the site by 10% in the next quarter? What is the impact on revenue from our latest targeted ad campaign? How can we improve customer satisfaction with regards to the clarity of our solution/workflow on our site?
  • #15 Comparable metrics give us a sense of progress or regression. Everyone must be able to understand a metric for it to be good. Ratios and rates are good for comparing factors that might be “opposed”, they are inherently comparative, and they are easier to act on (change one part of the ratio to impact the metric)
  • #16 What will you do differently (what will you CHANGE) based on the value of a metric? If you’re testing something, agree what change you will make BEFORE collecting the data! (I.e. if the picture of a cat on the homepage drives more revenue than our marketing text, we WILL use the picture of the cat. If > 30% of people we survey said they don’t use the feature, we will kill the feature, etc.) Go back to the slides that talk about asking Business Questions that require data ANALYSIS. Your data analysis should drive action items.
  • #17 Hints: Not comparable, not contextual to answering a specific business question, absolute values (not a ratio), not understood by your audience
  • #19 So how do we find our what metrics we should be tracking??? One framework for this is: Lean Analytics
  • #20 1) Maybe it’s Medium Data. Don’t be a Data Discriminator. 2) YES! We will discuss concepts that apply to any business 3) Lean analytics is a framework that works in conjunction with Lean Startup frameworks to help businesses use data to mitigate their biggest risk: Building Something No One Wants. Core idea: By knowing the following 2 things, you can track and optimize the One Metric that Matters to make the right decisions for business: The kind of business you are (e-Commerce? SaaS? Mobile App? Media Site? Two-sided marketplace?) and The stage your business is in
  • #21 Qualitative metrics are unstructured, tell a story, give insights, and are hard to aggregate. Quantitative involve stats, aggregation, numbers, but are harder to get insights from. Which do you think is more suited to your phase of business? Starts are looking for insights, are explorative, and so qualitative are going to be more insightful and helpful. Vanity metrics are metrics that do not clearly tie to a specific action. They exist to make us feel better (or sometimes worse), but don’t tell us anything about the why. Exploratory metrics are metrics YOU can help with. Ask probing questions, look for patterns of desirable behavior in unexpected places, and give your startup or new product development team insights they never expected! Leading metrics and lagging metrics are both useful, but in different ways. Early on, startup and new products won’t have enough info to relate a metric from today to one in the future, so lagging metrics are important. Later, MUST track leading metrics, like Qualified Leads, Customer complaints in a specific period, etc. Correlated metrics change together, but if one metric causes another to change, it’s causal. Correlation is GOOD. Causation is GREAT if you can find it.
  • #24 Stages: Empathy: In this phase, need to understand target market. What is their problem (REALLY) & do is it a problem ppl will pay for? (QUALITATIVE) Stickiness: In this phase, you need to need to find out if you can build a solution people WANT and WANT to use (WARNING: Don’t scale prematurely before you’ve proven this) Virality: After you’ve worked kinks out with your early adopters (who are more tolerant with kinks), it’s time to get them to spread the word. Do they love your solution enough to tell their family & friends? Test your onboarding and acquisition on these people. Revenue: Time to monetize. Maximize, optimize Scale: Time to grow the market – acquire more customers, experiment with different verticals, geographies, user segments, etc.
  • #26 Downloads/installation volume: Turns out getting featured in an app store has a HUGE impact on app sales/downloads. Getting featured has been shown to cause a jump by 42 places on the Android market, 27 on iPad app store, and 15 on the iPhone store. (According to research by Distimo) Also, being showcased on the home page of Apple’s App store ROUTINELY yields a hundredfold increase in traffic. (From Analytics firm Flurry) Making money off of a mobile app can happen in a number of different ways, including in-app purchases, advertising, and upgrades to unlock more features. MUST calculate ARPU and figure out how to MAXIMIZE this metric, but it’s TRICKY. Here is where smart app design (especially with games) comes into play, and where we learned that apps that are NOT games can benefit greatly from having elements of gamification. Goal is to keep users engaged, offer them the right in-app purchases (less expensive purchases for non-paying customers, more expensive for paying customers) while keeping the game playable (not too hard, not too easy), etc.
  • #27 Which one do you think is key for an e-commerce business? (All boils down to revenue per customer, which combines information from conversion rates, repeat purchases, and transaction sizes) Share your experiences
  • #28 - Which one do you think is key for a SaaS business? (Churn really determines whether you will keep all those users you acquired, and if you can continue to generate income from them). - Share stories about how each of these metrics relates to your business/company/product, and how you could benefit from maximizing or focusing on one.