Emission Statement - Issue 2 - Application
•
0 likes•45 views

Here it is - Issue 2. An introduction to characterising emissions reduction technologies by their Application, to aid project development.

Recommended
Recommended
More Related Content
What's hot
What's hot (20)
Similar to Emission Statement - Issue 2 - Application
Similar to Emission Statement - Issue 2 - Application (20)
Recently uploaded
Recently uploaded (20)
Emission Statement - Issue 2 - Application
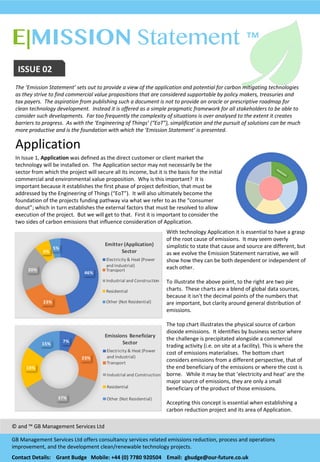
- 1. E|MISSION Statement ™ EMAIL enquiries@our- future.co.uk ISSUE 02 The ‘Emission Statement’ sets out to provide a view of the application and potential for carbon mitigating technologies as they strive to find commercial value propositions that are considered supportable by policy makers, treasuries and tax payers. The aspiration from publishing such a document is not to provide an oracle or prescriptive roadmap for clean technology development. Instead it is offered as a simple pragmatic framework for all stakeholders to be able to consider such developments. Far too frequently the complexity of situations is over analysed to the extent it creates barriers to progress. As with the ‘Engineering of Things’ (“EoT”), simplification and the pursuit of solutions can be much more productive and is the foundation with which the ‘Emission Statement’ is presented. Application Risk Management In Issue 1, Application was defined as the direct customer or client market the technology will be installed on. The Application sector may not necessarily be the sector from which the project will secure all its income, but it is the basis for the initial commercial and environmental value proposition. Why is this important? It is important because it establishes the first phase of project definition, that must be addressed by the Engineering of Things (“EoT”). It will also ultimately become the foundation of the projects funding pathway via what we refer to as the “consumer donut”; which in turn establishes the external factors that must be resolved to allow execution of the project. But we will get to that. First it is important to consider the two sides of carbon emissions that influence consideration of Application. © and ™ GB Management Services Ltd GB Management Services Ltd offers consultancy services related emissions reduction, process and operations improvement, and the development clean/renewable technology projects. Contact Details: Grant Budge Mobile: +44 (0) 7780 920504 Email: gbudge@our-‐future.co.uk With technology Application it is essential to have a grasp of the root cause of emissions. It may seem overly simplistic to state that cause and source are different, but as we evolve the Emission Statement narrative, we will show how they can be both dependent or independent of each other. To illustrate the above point, to the right are two pie charts. These charts are a blend of global data sources, because it isn't the decimal points of the numbers that are important, but clarity around general distribution of emissions. The top chart illustrates the physical source of carbon dioxide emissions. It identifies by business sector where the challenge is precipitated alongside a commercial trading activity (i.e. on site at a facility). This is where the cost of emissions materialises. The bottom chart considers emissions from a different perspective, that of the end beneficiary of the emissions or where the cost is borne. While it may be that ‘electricity and heat’ are the major source of emissions, they are only a small beneficiary of the product of those emissions. Accepting this concept is essential when establishing a carbon reduction project and its area of Application. 46% 23% 20% 6% 5% Emitter.(Application) Sector Electricity)&)Heat)(Power) and)Industrial) Transport Industrial)and)Construction Residential) Other)(Not)Residential) 7% 23% 37% 18% 15% Emissions. Beneficiary Sector Electricity)&)Heat)(Power) and)Industrial) Transport Industrial)and)Construction Residential Other)(Not)Residential)
- 2. EMAIL enquiries@our- future.co.uk © GB Management Services Ltd Contact Details: Grant Budge Mobile: +44 (0) 7780 920504 Email: gbudge@our-‐future.co.uk The Consumer Donut CADS With the basic characterisation accepted that emitter and beneficiary of emissions are different, we have developed the Consumer Donut to aid developers in framing their Application position. The Consumer Donut endeavours to provide a very basic model of how the Application of clean technologies works, and in so doing delivers a framework for communication of the same to all stakeholders. Within the Donut, we propose the definition of two Application groups: Consumer and Demand Side (“CADS”) and Process and Production Side or (“PAPS”) When developing a project or technology, it goes without saying, knowing your market position – your Application -‐ is key. But in emission reduction technologies it is even more important, because it will ultimately align to both your funding pathway and your communications strategy. So, what are these two umbrella Application groups and how do they interact? For this we provide a general summary of their characteristics below. Consumer and Demand Side (CADS) applications are characterised in the following way: • They are small in nature targeted at households and individuals. • They have relatively low unit costs to demonstrate. As such, they are an attractive investment opportunity, potentially being scalable and volume driven; which allows cost exposure to better align with returns. • Gains are minuscule for each installation, impact is incremental and through cumulative (i.e. volume) based utilisation; and as such they generally require cultural shifts to drive adoption, combined with Government backed incentives or subsidies. • They are mostly energy efficiency, energy switching and energy reduction focussed. • Energy switching CADS hold extended infrastructure influence, because the core energy demand is still required, but its load is shifted to another source, impacting PAPS . Process and Production Side (PAPS) applications are characterised in the following way: • They are large in nature and are industry/business led. • They require significant investment decisions, backed by a view of long term market security. • They have relatively high unit costs to demonstrate and still hold scaling risks beyond that demonstration. • PAPS have less influence on CADS, other than as a supplier of utilities and raw materials. With these definitions we can explore the dynamics of the Consumer Donut, which is illustrated on the next page. PAPS sit towards the core of the Donut. They are the backbone of economic and social existence and growth. Thermometers of national performance so to speak. A nation in boom will increase in PAPS size and by default, the donut will expand and present a greater challenge for emissions reduction and burden of cost. CADS seek to reduce the donut diameter through demand reduction. They achieve this by providing avenues to enhance disposable income (reduce demand through energy efficiency and education) and then seek to consume the released disposable income (provide cleaner or energy efficient products). However, what can be misunderstood here, is the transfer of undertaking regarding emissions. For example, an electric car may make the consumer feel good about his carbon footprint, because they are no longer an emitter, but that doesn’t eliminate their culpability for being the beneficiary of emissions, due to the increased electricity demand. Considering emissions must be holistic. Caught between the PAPS and CADS are the consumers – society. Many focus the burden of climate change to Governments and business to resolve and finance, ignoring the fact that it is societies right for existence and desires for an increasing standard of such existence, that is the driver of environmental change. Such rate of change, will always have variable ‘pull’ to it, expanding and contracting the Donut. In practice, the sole role of business is to use best endeavors to assess and develop Technologies for a lowest cost pathway (best available technology) and facilitate the passage of that cost to society. Alongside this, the role of Government is the application of Policy, Regulation, Legislation and provision of finance to stimulate or impose the adoption of will always sits at the end of the value chain and bare the burden of cost. The ‘Consumer Donut’ is not intended to be exhaustive, but is provided for low level mapping of Applications to Technologies and their collective impacts. It is the starting point for characterising Application and determining how the proposed project will influence and be influenced. E|MISSION Statement ™
- 3. © GB Management Services Ltd Contact Details: Grant Budge Mobile: +44 (0) 7780 920504 Email: gbudge@our-‐future.co.uk The Consumer Donut CADS PAPS THE 3 LAWS OF APPLICATION • CADS CAN INCREASE DEMAND FOR PAPS • THE GOVERNMENT MUST BE AN ENABLER FOR BOTH • THE CONSUMER PAYS NOTE: To aid continuity with future issues of the Emission Statement, we have profiled a selection of Technologies and Wider Impacts of each Application/Technology blend CADS GOVERNMENT CONSUMER PAPS GOVERNMENT TECHNOLOGY TECHNOLOGY EXTENDED3 INFRASTRUCTURE3 INFLUENCE THE3FLOW3OF3 FINANCIAL3BURDEN Application** Technology* Wider*Impact* Wholesale(Power( Nuclear( CCUS(/(BECCS( ( Tidal( Wind( Solar( Energy(Storage( Increased(cost(–(unknown(liability( Increased(cost(–(unknown(liability( New(Infrastructure( Increased(cost(–(defined(periodic(flow( Increased(cost(–(unpredictable(flow( Increased(cost(–(un(predictable(flow( Reduction(in(installed(capacity( Wholesale(Gas( CCUS/Hydrogen(Grid( Hydrolysis( Increased(cost(/(New(Infrastructure( Increased(cost(/(New(Infrastructure( Industrial((Direct( Energy)(&( Industrial((Indirect( Energy)( Biomass( Hydrogen( BECCS( CCUS( Impact(on(product(quality(and(press(performance( through(direct(energy.( Increased(cost(/(New(Infrastructure( ( E|MISSION Statement ™ Application** Technology* Wider*Impact* Transport) EV)&)Fuel)Cells) ) Biofuels) Increased)Electricity)Demand) New)Infrastructure)) New)Production)System) New)infrastructure) Domestic)Power) Smart)Metres) Low)Energy)Devices) Energy)Storage) Solar)Power) Potential)Reduced)Power)Demand) Potential)Reduced)Power)Demand) Potential)reduction)and)balancing)of)power)use) Reduction)in)Power)Demand) Domestic)Heat) Hydrogen)Grid) New)Infrastructure) New)appliance)burners) New)safety)standards) )