SlideShare a Scribd company logo
1 of 7
Download to read offline
E|MISSION Statement ™
EMAIL enquiries@our-
future.co.uk
ISSUE	
  05
The	
  ‘Emission	
  Statement’	
  sets	
  out	
  to	
  provide	
  a	
  view	
  of	
  the	
  application	
  and	
  potential	
  for	
  carbon	
  mitigating	
  technologies	
  
as	
  they	
  strive	
  to	
  find	
  commercial	
  value	
  propositions	
  that	
  are	
  considered	
  supportable	
  by	
  policy	
  makers,	
  treasuries	
  and	
  
tax	
  payers.	
  	
  The	
  aspiration	
  from	
  publishing	
  such	
  a	
  document	
  is	
  not	
  to	
  provide	
  an	
  oracle	
  or	
  prescriptive	
  roadmap	
  for	
  
clean	
  technology	
  development.	
  	
  Instead	
  it	
  is	
  offered	
  as	
  a	
  simple	
  pragmatic	
  framework	
  for	
  all	
  stakeholders	
  to	
  be	
  able	
  to	
  
consider	
  such	
  developments.	
  	
  Far	
  too	
  frequently	
  the	
  complexity	
  of	
  situations	
  is	
  over	
  analysed	
  to	
  the	
  extent	
  it	
  creates	
  
barriers	
  to	
  progress.	
  	
  As	
  with	
  the	
  ‘Engineering	
  of	
  Things’	
  (“EoT”)	
  though,	
  simplification	
  and	
  the	
  pursuit	
  of	
  solutions	
  can	
  
be	
  much	
  more	
  productive	
  and	
  is	
  the	
  foundation	
  with	
  which	
  the	
  ‘Emission	
  Statement’	
  is	
  presented.
Infrastructure
As	
  the	
  Emission	
  Statement	
  has	
  advanced	
  through	
  an	
  understanding	
  of	
  Application	
  and	
  
Technology	
  Design	
  for	
  a	
  cleaner	
  energy	
  structure,	
  we	
  have	
  highlighted	
  the	
  involvement	
  of	
  
national	
  government	
  in	
  providing	
  a	
  framework	
  (i.e.	
  policy	
  and	
  legislation)	
  and	
  funding	
  to	
  
stimulate	
  the	
  transition	
  to	
  a	
  lower	
  emissions	
  future;	
  whether	
  such	
  mechanisms	
  are	
  
targeted	
  at	
  CADS	
  or	
  PAPS.	
   With	
  consideration	
  of	
  the	
  criterion	
  of	
  Infrastructure,	
  this	
  is	
  
where	
  these	
  two	
  interventions	
  of	
  framework	
  and	
  funding	
  materially	
  precipitate,	
  which	
  is	
  
not	
  surprising,	
  because	
  internationally	
  such	
  infrastructure	
  are	
  still	
  or	
  were	
  originally	
  
national	
  assets.	
  	
  To	
  demonstrate	
  the	
  impact	
  of	
  infrastructure,	
  and	
  provide	
  continuity	
  to	
  
illustrating	
  our	
  approach,	
  we	
  will	
  continue	
  to	
  use	
  the	
  UK	
  as	
  a	
  reference	
  case.
©	
  and	
  ™	
  GB	
  Management	
  Services	
  Ltd
GB	
  Management	
  Services	
  Ltd	
  offers	
  consultancy	
  services	
  related	
  emissions	
  reduction,	
  process	
  and	
  operations	
  
improvement,	
  and	
  the	
  development	
  clean/renewable	
  technology	
  projects.	
  
Contact	
  Details:	


  Grant	
  Budge	
  	
  	
  Mobile:	
  +44	
  (0)	
  7780	
  920504 Email:	
  	
  gbudge@our-­‐future.co.uk
Risk
Management
46%
21%
25%
3% 5%
Domestic0Gas
Supply0Costs
Wholesale(Price
Network(Costs
Supplier(Cost(and(margin
Energy(&(Climate(Change(
Policies
37%
24%
22%
12%
5%
Domestic0Electricity0
Supply0Costs
Wholesale(Price
Network(Costs
Supplier(Cost(and(margin
Energy(&(Climate(Change(
Policies
Before	
  we	
  look	
  at	
  the	
  UK	
  from	
  an	
  energy	
  infrastructure	
  
perspective,	
  let	
  us	
  first	
  illustrate	
  why	
  good	
  
infrastructure	
  decision	
  making	
  is	
  so	
  important.	
  	
  To	
  the	
  
right	
  we	
  provide	
  two	
  charts	
  detailing	
  energy	
  supply	
  
costs;	
  one	
  for	
  gas	
  and	
  one	
  for	
  electricity.	
  	
  Between	
  
them	
  Network	
  Costs	
  – which	
  are	
  the	
  national	
  and	
  
regional	
  transmission/distribution	
  costs	
  – account	
  for	
  
an	
  average	
  23%	
  of	
  a	
  households	
  energy	
  bill.	
  	
  	
  In	
  
addition,	
  the	
  Wholesale	
  Costs	
  that	
  are	
  shown,	
  are	
  the	
  
costs	
  for	
  electricity	
  and	
  gas	
  at	
  the	
  point	
  it	
  enters	
  into	
  
the	
  national	
  transmission/distribution	
  network.	
  	
  The	
  
reason	
  that	
  is	
  important,	
  is	
  because	
  it	
  already	
  includes	
  
for	
  costs	
  of	
  production	
  based	
  infrastructure.	
  	
  
Combining	
  these	
  two	
  elements,	
  it	
  can	
  be	
  shown	
  that	
  
up	
  to	
  43%	
  of	
  our	
  total	
  energy	
  costs	
  are	
  recovering	
  
expenditure	
  for	
  the	
  development	
  and	
  maintenance	
  of	
  
infrastructure.	


  As	
  such,	
  when	
  infrastructure	
  decisions	
  
are	
  made,	
  they	
  lock	
  in	
  costs	
  for	
  generations	
  to	
  come;	
  
and	
  the	
  full	
  weight	
  of	
  those	
  decisions	
  are	
  borne	
  by	
  the	
  
consumer	
  i.e.	
  Inefficiencies	
  in	
  the	
  system	
  created	
  by	
  
unreliable	
  or	
  unpredictable	
  energy	
  supply,	
  force	
  
reliable	
  back-­‐up	
  capacity	
  to	
  be	
  available;	
  and	
  poor	
  
national	
  strategy	
  and	
  project	
  locations	
  embed	
  
unnecessary	
  connection,	
  distribution	
  and	
  transmission	
  
costs.	
  	
  Every	
  less	
  than	
  optimal	
  decision	
  further	
  gilds	
  the	
  
magnitude	
  of	
  these	
  long-­‐term	
  costs.	
  
©	
  GB	
  Management	
  Services	
  Ltd
Contact	
  Details:	


  Grant	
  Budge	
  	
  	
  Mobile:	
  +44	
  (0)	
  7780	
  920504 Email:	
  	
  gbudge@our-­‐future.co.uk
E|MISSION Statement ™
For	
  many	
  countries,	
  including	
  the	
  United	
  Kingdom,	
  Demand	
  Reduction	
  and	
  Source	
  Substitution	
  programmes	
  have	
  
already	
  yielded	
  environmental	
  benefits;	
  and	
  the	
  realisation	
  that	
  the	
  more	
  challenging	
  pathways	
  now	
  need	
  to	
  be	
  
progressed	
  has	
  dawned.	
  	
  So	
  how	
  do	
  we	
  navigate	
  this	
  challenge.	
  	
  First	
  it	
  is	
  important	
  for	
  a	
  nation	
  to	
  have	
  completed	
  a	
  
preliminary	
  plan	
  like	
  the	
  one	
  proposed	
  for	
  the	
  UK	
  in	
  Issue	
  4.	
  	
  Following	
  which	
  they	
  should	
  profile	
  what	
  infrastructure	
  
already	
  exists	
  to	
  support	
  that	
  plan.	
  	
  
For	
  our	
  infrastructure	
  review	
  we	
  will	
  consider	
  three	
  set	
  of	
  assets:	
  electricity	
  distribution	
  assets,	
  gas	
  distribution	
  assets,	
  
and	
  large	
  scale	
  emissions	
  assets	
  (power	
  and	
  industrial).	
  	
  Through	
  the	
  assessment	
  of	
  these,	
  we	
  propose	
  to	
  overlay	
  the	
  
plan	
  detailed	
  in	
  Issue	
  4	
  and	
  attribute	
  a	
  geographical	
  basis	
  for	
  its	
  deployment.	
  	
  At	
  the	
  heart	
  of	
  this	
  assessment	
  will	
  be	
  the	
  
EoT philosophy	
  of	
  Core	
  Process	
  Optimisation.	
  	
  The	
  process	
  here	
  being	
  how	
  to	
  best	
  enable	
  the	
  action	
  plan.	
  	
  And	
  while	
  
we	
  do	
  not	
  desire	
  to	
  become	
  UK	
  centric	
  in	
  using	
  the	
  Emissions	
  Model	
  framework,	
  we	
  will	
  be	
  cognisant	
  in	
  our	
  illustration	
  
of	
  the	
  recent	
  Parliamentary	
  review	
  which	
  identified	
  two	
  significant	
  failures	
  from	
  state	
  intervention	
  in	
  the	
  electricity	
  
market	
  so	
  far:	
  insecurity	
  of	
  supply	
  and	
  energy	
  prices.
The	
  basic	
  design	
  for	
  both	
  the	
  gas	
  and	
  
electricity	
  transmission	
  systems	
  is	
  
over	
  50	
  years	
  old,	
  and	
  is	
  
geographically	
  based	
  on	
  a	
  fossil	
  fuel	
  
architecture	
  related	
  to	
  domestic	
  coal	
  
and	
  gas	
  production	
  regions.	
  	
  
Major	
  points	
  of	
  landfall	
  for	
  natural	
  
gas	
  supplies	
  are	
  at	
  St	
  Fergus,	
  
Easington,	
  Theddlethorpe and	
  
Bacton.	
  	
  These	
  have	
  more	
  recently	
  
been	
  augmented	
  by	
  LNG	
  terminals	
  in	
  
South	
  Wales	
  and	
  Kent.	
  	
  And	
  
electricity	
  transmission	
  emanates	
  
from	
  the	
  North	
  East,	
  South	
  Wales,	
  
Staffordshire,	
  Nottinghamshire	
  and	
  
Yorkshire;	
  initiated	
  by	
  the	
  historic	
  
coal	
  production	
  in	
  these	
  areas.	
  It	
  is	
  
the	
  availability	
  and	
  development	
  of	
  
this	
  infrastructure	
  that	
  today’s	
  
Network	
  Costs	
  supports.
Each	
  time	
  a	
  new	
  production	
  asset	
  is	
  
established	
  away	
  from	
  this	
  
infrastructure,	
  new	
  long	
  term	
  
network	
  costs	
  are	
  created.	
  	
  While	
  
this	
  has	
  been	
  inevitable	
  for	
  
renewables,	
  nature	
  prescribing	
  their	
  
location;	
  it	
  should	
  not	
  be	
  accepted	
  as	
  
plans	
  to	
  continue	
  Source	
  
Substitution,	
  and	
  then	
  deliver	
  
Demand	
  Substitution,	
  Source	
  
Mitigation	
  and	
  Source	
  Containment	
  
are	
  implemented.	
  	
  With	
  these	
  latter	
  
three	
  in	
  particular,	
  we	
  should	
  seek	
  to	
  
minimise	
  infrastructure	
  costs,	
  
beyond	
  those	
  required	
  for	
  that	
  
particular	
  Technology	
  Design.	
  
So	
  accepting	
  the	
  network	
  
architecture	
  illustrated,	
  how	
  should
Transmission) Network
Scottish( Electricity(
Transmission(System
English(Electricity(
Transmission(System
Gas(Transmission(System
Terminal
LNG(Terminal((National( Grid)
LNG(Terminal
Gas(Interconnector
Electricity( Interconnector
we	
  consider	
  the	
  Application	
  and	
  Technology	
  Design	
  plan,	
  from	
  a	
  geographic	
  perspective,	
  to	
  mitigate	
  and	
  minimise	
  
incremental	
  costs	
  of	
  infrastructure.	
  For	
  this	
  we	
  will	
  address	
  each	
  element	
  of	
  the	
  plan	
  in	
  turn.
Source:	
  National	
  Grid
UK	
  Map	
  of	
  National	
  Gas	
  and	
  Electricity	
  
Infrastructure
©	
  GB	
  Management	
  Services	
  Ltd
Contact	
  Details:	


  Grant	
  Budge	
  	
  	
  Mobile:	
  +44	
  (0)	
  7780	
  920504 Email:	
  	
  gbudge@our-­‐future.co.uk
E|MISSION Statement ™
Source:	
  Atlas	
  of	
  UK	
  Marine	
  Energy	
  
Resources	
  (2004)
1. Solar	
  and	
  wind	
  should	
  be	
  capped	
  or	
  required	
  to	
  privately	
  reinvest
Due	
  to	
  the	
  nature	
  of	
  wind	
  and	
  solar,	
  there	
  is	
  little	
  that	
  can	
  be	
  done	
  on	
  a	
  project	
  basis	
  to	
  mitigate	
  the	
  influence	
  of	
  
infrastructure	
  on	
  the	
  cost	
  of	
  supply;	
  optimising the	
  potential	
  for	
  natural	
  energy	
  being	
  the	
  primary	
  location	
  determinant.	
  	
  
However,	
  what	
  can	
  be	
  done,	
  is	
  to	
  drive	
  the	
  performance	
  of	
  such	
  supply.	
  	
  
Overloading	
  any	
  supply	
  chain	
  with	
  unpredictability	
  will	
  lead	
  to	
  erosion	
  of	
  system	
  security	
  and	
  integrity.	
  Where	
  such	
  issues	
  
are	
  effectively	
  sponsored	
  (as	
  with	
  subsidies)	
  the	
  inevitable	
  response	
  is	
  to	
  act	
  to	
  compensate	
  for	
  these	
  effects,	
  embedding	
  
further	
  cost	
  to	
  manage	
  the	
  impact,	
  rather	
  than	
  deal	
  with	
  the	
  root	
  cause.	
  	
  This	
  is	
  EoT 101	
  -­‐ treat	
  the	
  root	
  cause	
  not	
  the	
  
symptom.	
  	
  Source	
  Containment	
  is	
  the	
  final	
  Technical	
  Design	
  solution	
  for	
  the	
  same	
  reason.	
  
Renewables	
  must	
  be	
  a	
  significant	
  part	
  of	
  the	
  worlds	
  climate	
  change	
  strategy,	
  but	
  it	
  needs	
  to	
  be	
  value	
  for	
  money.	
  	
  	
  And	
  as	
  
a	
  market	
  segment,	
  when	
  it	
  has	
  reached	
  25%	
  to	
  30%	
  of	
  a	
  national	
  source	
  of	
  electricity	
  supply;	
  we	
  would	
  propose	
  that	
  it	
  
has	
  reached	
  a	
  point	
  of	
  maturity,	
  that	
  finding	
  and	
  funding	
  its	
  own	
  solution	
  to	
  market	
  penetration,	
  must	
  be	
  part	
  of	
  the	
  
business	
  model.	
  	
  The	
  UK	
  is	
  now	
  at	
  this	
  inflection	
  point.
The	
  solution	
  can	
  be	
  simple.	
  	
  Set	
  a	
  performance	
  standard	
  that	
  all	
  new	
  projects	
  must	
  adhere	
  to;	
  and	
  that	
  all	
  existing	
  
operators	
  must	
  meet	
  within	
  10	
  years.	
  	
  We	
  would	
  propose	
  that	
  such	
  a	
  generator	
  standard	
  could	
  be	
  for	
  assets	
  to	
  deliver	
  a	
  
minimum	
  power	
  dispatch	
  of	
  75%	
  of	
  generate-­‐able	
  power	
  to	
  the	
  grid.	
  	
  Such	
  a	
  standard	
  would	
  require	
  asset	
  owners	
  to	
  
invest	
  in	
  energy	
  storage	
  capability	
  and	
  would	
  require	
  independent	
  verification	
  based	
  on	
  an	
  agreed	
  industry	
  availability	
  
standard,	
  and	
  local	
  weather	
  data.	
  	
  	
  But	
  if	
  implemented,	
  could	
  independently	
  drive	
  the	
  market	
  merits	
  of	
  these	
  renewables	
  
beyond	
  a	
  subsidised platform.
2.	
  Tidal	
  range	
  should	
  be	
  prioritised	
  over	
  Nuclear	
  for	
  flexible	
  baseload	
  capacity
The	
  UK	
  is	
  acknowledged	
  to	
  be	
  home	
  to	
  50%	
  of	
  Europe’s	
  tidal	
  energy	
  potential.	
  	
  The	
  
two	
  figures	
  to	
  the	
  right	
  illustrate	
  the	
  coastal	
  areas	
  of	
  greatest	
  tidal	
  height	
  differential	
  
(i.e.	
  tidal	
  range)	
  and	
  sub-­‐surface	
  water	
  flow	
  (i.e.	
  tidal	
  stream)	
  potential.	
  However,	
  for	
  
now,	
  we	
  advocate	
  that	
  tidal	
  range	
  should	
  be	
  prioritised,	
  because	
  it	
  has	
  been	
  
commercially	
  demonstrated	
  and	
  offers	
  comparable	
  scale	
  to	
  nuclear.	
  	
  
However,	
  before	
  addressing	
  our	
  proposal	
  to	
  prioritise tidal	
  range	
  over	
  nuclear	
  
power,	
  a	
  statement	
  regarding	
  off-­‐shore	
  wind	
  is	
  considered	
  appropriate.	
  	
  It	
  may	
  be	
  
cited	
  that	
  the	
  environmental	
  impact	
  from	
  large	
  scale	
  impounding	
  of	
  the	
  sea	
  is	
  too	
  
significant.	
  	
  However,	
  current	
  best	
  in	
  class	
  off-­‐shore	
  wind	
  yields	
  around	
  4MW	
  per	
  
square	
  kilometer, while	
  tidal	
  range	
  is	
  16MW.	
  	
  	
  As	
  such,	
  it	
  could	
  be	
  proposed	
  under	
  a	
  
‘best	
  available	
  technology’	
  analysis	
  	
  that	
  wind	
  has	
  the	
  potential	
  to	
  create	
  a	
  higher	
  
environmental	
  impact	
  per	
  MW	
  produced	
  or	
  tonne of	
  CO2 mitigated.
So	
  to	
  nuclear,	
  why	
  should	
  the	
  UK	
  pursue	
  nuclear	
  without	
  appropriate	
  consideration	
  
of	
  tidal	
  range.	
  	
  As	
  foundation	
  to	
  this	
  remark,	
  we	
  summarise below	
  key	
  metrics	
  for	
  
comparison	
  of	
  the	
  two	
  technologies.	
  	
  With	
  capital	
  costs	
  of	
  	
  generation	
  infrastructure	
  
being	
  the	
  main	
  driver	
  of	
  wholesale	
  costs	
  of	
  supply;	
  then	
  surely	
  minimising these	
  
must	
  be	
  central	
  to	
  low	
  cost	
  electricity	
  supply	
  in	
  the	
  future.	


TIDAL	
  RANGE
Resources
TIDAL	
  STREAM
Resources
KPI	
  Comparison	
  Table Tidal	
  Range Nuclear
Total	
  Installed	
  Capital	
  Cost	
  (£/kW) 2,800	
   4,500	
  
Operating	
  Costs	
  (£/kWh) 0.01 0.04
Minimum	
  Design	
  Life	
  (Years) >100 60
Decommissioning	
  Liability No Yes
Legacy	
  Environmental	
  Liabilities Limited Yes
Energy	
  Independence Yes No
Design	
  Complexity	
   Low High
Source	
  Substitution
Contact	
  Details:	


  Grant	
  Budge	
  	
  	
  Mobile:	
  +44	
  (0)	
  7780	
  920504 Email:	
  	
  gbudge@our-­‐future.co.uk
E|MISSION Statement ™©	
  GB	
  Management	
  Services	
  Ltd
3.	
  Domestic	
  decarbonisation	
  through	
  hydrogen	
  grids	
  should	
  be	
  
embraced
Here	
  the	
  infrastructure	
  costs	
  impact	
  production,	
  distribution	
  and	
  
supply.	
  	
  Demand	
  Substitution	
  by	
  hydrogen	
  also	
  requires	
  
regulated	
  and	
  safe	
  domestic	
  CADS	
  products	
  to	
  be	
  available;	
  but	
  
when	
  we	
  acknowledge	
  that	
  the	
  UK	
  use	
  to	
  be	
  heated	
  
predominantly	
  by	
  town	
  gas	
  only	
  50	
  years	
  ago,	
  then	
  it	
  is	
  
conceivable	
  that	
  a	
  pathway	
  for	
  such	
  products	
  could	
  be	
  enabled	
  
by	
  a	
  policy	
  to	
  focus	
  on	
  heat	
  decarbonisation	
  through	
  hydrogen.	
  	
  
Infrastructure	
  costs	
  here	
  though	
  are	
  likely	
  to	
  be	
  significant	
  and	
  
must	
  be	
  led	
  by	
  a	
  ‘fit	
  for	
  purpose’	
  assessment	
  of	
  current	
  
installations.	
  	
  
Following	
  a	
  ‘fit	
  for	
  purpose’	
  assessment,	
  the	
  question	
  of	
  where	
  to	
  
begin	
  arises.	
  	
  Evolution	
  of	
  any	
  new	
  system	
  requires	
  careful	
  
project	
  management	
  based	
  on	
  a	
  stage	
  gate	
  strategy	
  for	
  
expansion.	
  	
  So	
  to	
  assess	
  this	
  and	
  location,	
  we	
  propose	
  to	
  consider	
  
three	
  factors.	
  	
  First	
  the	
  profile	
  of	
  UK	
  carbon	
  emissions	
  sources	
  
(see	
  University	
  College	
  London	
  map	
  below);	
  second	
  the	
  known	
  
potential	
  areas	
  for	
  CO2 storage	
  (superimposed	
  below);	
  and	
  third	
  
the	
  UK’s	
  population	
  density	
  (see	
  map	
  to	
  the	
  right).	
  	
  Overlaying	
  
these	
  three	
  criteria,	
  it	
  becomes	
  relatively	
  clear	
  that	
  a	
  pragmatic	
  
and	
  least	
  cost	
  approach	
  should	
  be	
  to	
  focus	
  across	
  central	
  UK.
Demand	
  Substitution
Source:	
  	
  Office	
  for	
  National	
  Statistics.	
  2011
Such	
  an	
  approach	
  would	
  also	
  allow	
  funding	
  to	
  be	
  
targeted	
  towards	
  areas	
  which	
  have	
  sufficient	
  market	
  
scale	
  for	
  products	
  as	
  well	
  as	
  for	
  common	
  national	
  
infrastructure;	
  and	
  with	
  43%	
  of	
  gas	
  supplies	
  entering	
  
through	
  terminals	
  in	
  the	
  Humberside	
  region,	
  central	
  
UK	
  could	
  provide	
  a	
  cost	
  effective	
  centralised	
  location	
  
to	
  enable	
  gas	
  grid	
  decarbonisation	
  and	
  CO2 storage.	
  
4.	
  EV	
  and	
  Fuel	
  Cell	
  transport	
  should	
  be	
  embraced
When	
  we	
  consider	
  how	
  to	
  create	
  markets	
  for	
  both	
  EV	
  
and	
  fuel	
  cell	
  technology,	
  we	
  again	
  would	
  review	
  
population	
  density,	
  but	
  more	
  importantly,	
  look	
  to	
  
ensure	
  that	
  each	
  element	
  of	
  the	
  national	
  plan	
  is	
  
ultimately	
  reinforcing	
  and	
  building	
  on	
  previous	
  
actions.	
  	
  With	
  this	
  latter	
  objective	
  central	
  to	
  our	
  view,	
  
we	
  would	
  propose	
  that	
  incentives	
  are	
  offered	
  for	
  
hydrogen	
  and	
  fuel	
  cell	
  technology	
  developers	
  to	
  
establish	
  themselves	
  within	
  the	
  central	
  UK	
  region.	
  	
  
Beyond	
  this,	
  we	
  would	
  propose	
  balancing	
  this	
  
geographic	
  bias	
  by	
  providing	
  comparable	
  incentives	
  
and	
  support	
  to	
  EV	
  infrastructure	
  developers	
  within	
  
major	
  cities	
  where,	
  population	
  density,	
  shorter	
  
average	
  journeys	
  and	
  restricted	
  car	
  charging	
  options	
  
(i.e.	
  for	
  flats)	
  would	
  warrant	
  such	
  support.	
  	
  
Establishing	
  the	
  infrastructure	
  for	
  these	
  technologies	
  
in	
  defined	
  areas	
  will	
  provide	
  investor	
  confidence	
  to	
  
develop	
  and	
  market	
  their	
  products.Source:	
  	
  University	
  College	
  London
UK	
  Map	
  of	
  
Population	
  Density
CO2 Store
UK	
  Map	
  of	
  CO2 Emissions	
  
Intensity	
  and	
  Storage
Locations
Contact	
  Details:	


  Grant	
  Budge	
  	
  	
  Mobile:	
  +44	
  (0)	
  7780	
  920504 Email:	
  	
  gbudge@our-­‐future.co.uk
E|MISSION Statement ™©	
  GB	
  Management	
  Services	
  Ltd
Source	
  Mitigation
6.	
  CCS	
  should	
  be	
  prioritised	
  on	
  all	
  industrial	
  applications	
  where	
  biomass	
  is	
  used	
  as	
  a	
  feedstock
If	
  	
  industry	
  has	
  taken	
  the	
  steps	
  towards	
  carbon	
  emissions	
  neutrality	
  through	
  the	
  carbon	
  cycle	
  of	
  biomass;	
  then	
  it	
  would	
  
seem	
  an	
  appropriate	
  strategy	
  to	
  augment	
  these	
  facilities	
  and	
  create	
  carbon	
  negative	
  products,	
  through	
  the	
  combined	
  
full	
  or	
  partial	
  application	
  of	
  CCS.	
  	
  Dependent	
  on	
  the	
  industrial	
  process,	
  there	
  may	
  not	
  be	
  a	
  benefit	
  from	
  an	
  immediate	
  
step	
  to	
  100%	
  implementation	
  of	
  carbon	
  capture.	
  	
  In	
  fact	
  we	
  advocate	
  that	
  where	
  biomass	
  has	
  been	
  deployed,	
  post	
  
carbon	
  neutral	
  CCS	
  capacity	
  should	
  be	
  built	
  up	
  over	
  time	
  in	
  line	
  with	
  market	
  driven	
  inclusion	
  of	
  the	
  cost	
  of	
  carbon	
  into	
  
the	
  product	
  value	
  chain;	
  thus	
  constraining	
  any	
  premature	
  consumer	
  burden	
  through	
  taxation.	
  	
  	
  An	
  illustration	
  of	
  such	
  a	
  
progression	
  is	
  provided	
  below,	
  where	
  an	
  Integrated	
  Basic	
  Oxygen	
  Steel	
  Mill	
  (production	
  capacity	
  1.6	
  million	
  tonne	
  per	
  
annum),	
  phases	
  the	
  utilisation	
  of	
  biomass	
  as	
  a	
  raw	
  energy	
  feedstock;	
  and	
  the	
  application	
  of	
  carbon	
  capture	
  and	
  storage.	
  
It	
  should	
  further	
  be	
  noted	
  that	
  it	
  may	
  also	
  be	
  possible	
  to	
  include	
  CO2	
  utilisation	
  up	
  to	
  Case	
  3,	
  thus	
  deferring	
  some	
  
infrastructure	
  costs	
  and	
  creating	
  an	
  additional	
  source	
  of	
  revenue.
5.	
  Biomass	
  should	
  be	
  prioritised	
  for	
  use	
  in	
  industrial	
  applications
Currently	
  23.7	
  million	
  tonnes	
  oil	
  equivalent	
  of	
  energy	
  is	
  used	
  across	
  
the	
  UK’s	
  industrial	
  sector.	
  	
  This	
  demand	
  covers	
  a	
  variety	
  of	
  needs	
  as	
  
illustrated	
  in	
  the	
  pie	
  chart	
  (top	
  right).	
  	
  More	
  than	
  half	
  of	
  these	
  needs	
  
could	
  be	
  supplied	
  through	
  electrification,	
  emissions	
  being	
  addressed	
  
more	
  efficiently	
  upstream	
  in	
  the	
  energy	
  supply	
  chain;	
  but	
  process	
  
heating	
  (high	
  and	
  low)	
  must	
  find	
  an	
  alternative	
  pathway	
  to	
  emissions	
  
reduction.
We	
  mentioned	
  in	
  Issue	
  3,	
  that	
  direct	
  and	
  indirect	
  process	
  heating	
  can	
  
impact	
  alternatives	
  available.	
  	
  For	
  indirect	
  heating	
  where	
  the	
  energy	
  
source	
  and	
  process	
  flow	
  do	
  not	
  make	
  direct	
  contact,	
  substitution	
  can	
  
be	
  relatively	
  straight	
  forward.	
  	
  But	
  for	
  direct	
  process	
  heating,	
  
consideration	
  must	
  be	
  given	
  to	
  potential	
  contaminants,	
  new	
  or	
  
affected	
  by-­‐products,	
  changes	
  to	
  process	
  productivity	
  due	
  to	
  rate	
  of	
  
heating,	
  and	
  variations	
  to	
  charge	
  characteristics	
  or	
  mass	
  flow	
  rates. Source:	
  	
  Digest	
  of	
  UK	
  Energy	
  Statistics
It	
  is	
  forecast	
  that	
  by	
  2050,	
  the	
  UK	
  will	
  be	
  able	
  to	
  supply	
  approximately	
  
28	
  million	
  tonnes	
  per	
  annum	
  of	
  biomass;	
  which	
  at	
  an	
  average	
  
15GJ/tonne	
  could	
  provide	
  420million	
  Giga	
  Joules	
  of	
  energy.	
  	
  The	
  
industrial	
  sector	
  as	
  a	
  whole	
  consumes	
  990million	
  Giga	
  Joules	
  of	
  energy	
  
per	
  annum,	
  48%	
  of	
  which	
  (476	
  million	
  Giga	
  Joules)	
  is	
  process	
  heat	
  
related	
  (chart	
  top	
  right).	
  	
  The	
  fuel	
  used	
  for	
  process	
  energy	
  is	
  unclear,	
  
but	
  will	
  predominantly	
  come	
  from	
  solid,	
  liquid	
  or	
  gaseous	
  fuels	
  (see	
  
chart	
  middle	
  right	
  for	
  profile	
  of	
  raw	
  energy	
  use	
  in	
  the	
  industrial	
  sector).
Other	
  than	
  closure	
  of	
  assets	
  or	
  an	
  unparalleled	
  advance	
  in	
  production	
  
technology,	
  few	
  solutions	
  other	
  than	
  biomass	
  can	
  support	
  industrial	
  
emissions	
  reductions.	
  Considering	
  biomass	
  supply	
  constraints,	
  it	
  would	
  
make	
  sense	
  to	
  direct	
  product	
  to	
  these	
  applications;	
  commencing	
  with	
  
solid	
  fuel	
  switching,	
  ahead	
  of	
  liquid	
  or	
  gas	
  switching.	
  It	
  should	
  also	
  be	
  
remembered	
  that	
  gas	
  switching	
  may	
  also	
  be	
  supported	
  by	
  action	
  3.
Source	
  Containment
Coal
Petroleum
Natural,Gas
Electricity
Bio4Energy
Source:	
  	
  Digest	
  of	
  UK	
  Energy	
  Statistics
Scenario	
  Profile	
  Table Base	
  Case Case	
  1 Case	
  2 Case	
  3 Case	
  4
CO2 Produced	
  (tpa) 4,145,600	
   4,992,400	
   4,992,400	
   5,251,300	
   5,251,300	
  
%	
  Biomass	
  Substitution -­‐ 23% 23% 50% 50%
%	
  CCS	
  Installed -­‐ 0% 23% 23% 50%
CO2	
  Avoided	
  (tpa) -­‐ 654,700	
   1,553,200	
   2,147,550	
   4,094,343	
  
%	
  CO2 Avoided -­‐ 16% 37% 52% 99%
Lighting Refrigeration
Compressed2
Air
Motors
Space2
Heating
Drying2/2
Separation
Other
High2
Temperature2
Prcoess
Low2
Temperature2
Process
Industrial	
  Energy	
  Use
Industrial	
  Energy	
  Source
Contact	
  Details:	


  Grant	
  Budge	
  	
  	
  Mobile:	
  +44	
  (0)	
  7780	
  920504 Email:	
  	
  gbudge@our-­‐future.co.uk
E|MISSION Statement ™©	
  GB	
  Management	
  Services	
  Ltd
Timetable
Source	
  Containment	
  (Continued)
No	
  matter	
  what	
  the	
  architecture	
  of	
  electricity	
  supply,	
  there	
  will	
  
continue	
  to	
  be	
  a	
  need	
  for	
  flexible	
  and	
  rapid	
  response	
  
generation.	
  	
  From	
  a	
  total	
  installed	
  capital	
  cost,	
  fixed	
  operating	
  
cost	
  and	
  unabated	
  emissions	
  performance	
  perspective,	
  
Combined	
  Cycle	
  Gas	
  Turbine	
  (“CCGT”)	
  is	
  still	
  the	
  industry	
  
benchmark	
  for	
  such	
  generation.	
  	
  It	
  would	
  be	
  expected	
  that	
  
with	
  a	
  forecast	
  2050	
  peak	
  electricity	
  demand	
  (including	
  10%	
  
installed	
  capacity	
  margin)	
  of	
  between	
  110GW	
  and	
  140GW,	
  that	
  
at	
  least	
  15%	
  of	
  this	
  should	
  be	
  flexible	
  rapid	
  response	
  CCGT	
  
generation	
  (i.e.	
  up	
  to	
  16.5GW	
  to	
  21GW).	
  	
  	
  However,	
  despite	
  its	
  
emissions	
  performance,	
  this	
  capacity	
  should	
  not	
  be	
  unabated	
  
and	
  must	
  be	
  enabled	
  at	
  the	
  right	
  time	
  with	
  CCS.	
  	
  As	
  such,	
  and	
  
in	
  acceptance	
  of	
  the	
  preceding	
  actions,	
  it	
  is	
  proposed	
  that	
  this	
  
infrastructure	
  is	
  developed	
  within	
  the	
  central	
  eastern	
  corridor	
  
of	
  the	
  UK	
  – namely	
  Humberside/Yorkshire.	
  	
  
One	
  critical	
  factor	
  that	
  hasn’t	
  been	
  presented	
  and	
  that	
  materially	
  influences	
  this	
  proposed	
  plan,	
  is	
  time. It	
  takes	
  time	
   to	
  
develop	
  new	
  infrastructure.	
  	
  Concept	
  clearance	
  to	
  execution	
  of	
  hydrogen	
  gas	
  mains	
  enablement	
  takes	
  time.	
  	
  Without	
  
policy	
  and	
  strategy	
  to	
  support	
  its	
  creation,	
  investors	
  in	
  PAPS	
  and	
  CADS	
  can	
  not	
  justify	
  the	
  development	
  costs.
It	
  takes	
  time	
  to	
  develop	
  source	
  projects,	
  industrial	
  or	
  generation	
  (PAPS).	
  	
  On	
  average	
  it	
  would	
  be	
  reasonable	
  to	
  say	
  this	
  
period	
  from	
  idea	
  to	
  commercial	
  operation	
  would	
  be	
  a	
  minimum	
  5	
  years	
  up	
  to	
  a	
  maximum	
  of	
  8	
  years.	
  	
  Such	
  decision	
  
require	
  long	
  term	
  market	
  certainty,	
  supported	
  by	
  guarantees	
  that	
  the	
  biomass	
  supply	
  chain	
  and/or	
  hydrogen	
  grid	
  
and/or	
  CO2 transport	
  and	
  storage	
  capacity	
  will	
  be	
  available.
The	
  objective	
  from	
  the	
  plan	
  proposed	
  here,	
  is	
  that	
  by	
  establishing	
  a	
  geographic	
  framework	
  alongside	
  a	
  decarbonisation	
  
strategy,	
  a	
  national	
  plan	
  can	
  be	
  accelerated.	
   But	
  it	
  will	
  require	
  all	
  stakeholders	
  to	
  be	
  altruistic	
  and	
  see	
  that	
  a	
  race	
  to	
  be	
  
first	
  is	
  futile,	
  unless	
  you	
  know	
  where	
  the	
  finish	
  line	
  is.	


Generating	
  
Infrastructure
Capacity	
  
(GW)
Infrastructure
Status
Drax 3.9 Potential	
  CCGT
Eggborough 2 Potential	
  CCGT
Ferrybridge 2 Potential	
  CCGT
Keadby 0.7 Existing	
  CCGT
Saltend 1.2 Existing	
  CCGT
Immingham 1.18 Existing	
  CCGT
Thorpe	
  Marsh 1.5 Consented	
  CCGT
Hatfield 0.9 Consented	
  CCGT
Knottingley 1.5 Consented	
  CCGT
TOTAL 14.88
7.	
  Balance	
  of	
  installed	
  power	
  capacity	
  should	
  be	
  CCGT	
  with	
  CCS:
The	
  table	
  above	
  illustrates	
  the	
  existing	
  CCGT	
  capacity,	
  the	
  consented	
  CCGT	
  capacity	
  and	
  the	
  extended	
  generation	
  
capacity	
  (i.e.	
  coal)	
  that	
  can	
  be	
  repurposed	
  within	
  a	
  1,000	
  square	
  kilometer	
  area	
  of	
  Humberside.	


  With	
  the	
  actions	
  
detailed	
  under	
  items	
  3,	
  4	
  and	
  6	
  being	
  targeted	
  within	
  the	
  central	
  UK	
  region,	
  this	
  	
  CCS	
  capacity	
  should	
  have	
  relatively	
  
low	
  transport	
  and	
  storage	
  costs,	
  ensuring	
  such	
  flexible	
  capacity	
  is	
  best	
  value	
  for	
  the	
  consumer.	
  	
  We	
  illustrate	
  below	
  
how	
  this	
  would	
  work	
  in	
  practice	
  as	
  emissions	
  reductions	
  progress	
  through	
  the	
  sequential	
  actions	
  proposed.	
  
0%
10%
20%
30%
40%
50%
60%
70%
80%
90%
100%
25% 50% 75% 100%
Relative(Costs(per(Tonne(Stored
Shared((Transport(and(Storage)(Infrastructure(Capacity(Utilisation,(%
Relative(Cost(per(tonne(Vs(Shared(Infrastructure(Capacity(Utilisation
30(£/t
24(£/t
18(£/t
13.5(£/t
Effective(shared(cost(of(transport(and(storage(in(£/t
Action	
  3	
  &	
  4
Decarbonise Heat	
  (Hydrogen	
  Grid)	
  
Action	
  6
Industrial	
  CCS
Action	
  7
Power	
  CCS
Contact	
  Details:	


  Grant	
  Budge	
  	
  	
  Mobile:	
  +44	
  (0)	
  7780	
  920504 Email:	
  	
  gbudge@our-­‐future.co.uk
E|MISSION Statement ™©	
  GB	
  Management	
  Services	
  Ltd
A	
  Consolidated	
  Infrastructure	
  Strategy
Through-­‐out	
  Issue	
  5	
  there	
  have	
  been	
  three	
  interlinked	
  Engineering	
  of	
  Things	
  basic	
  philosophies	
  that	
  have	
  filtered	
  
through	
  every	
  element	
  of	
  the	
  infrastructure	
  design	
  and	
  progression	
  considered.	
  	
  They	
  are:
Centralisation:	
  	
  Centralised	
  solutions	
  are:	
  easier	
  to	
  implement	
  through	
  clear	
  strategy,	
  standardised	
  policy	
  and	
  
practice:	
  ensures	
  continuity	
  of	
  approach	
  across	
  the	
  system:	
  are	
  easier	
  to	
  coordinate,	
  especially	
  around	
  budgets:	
  and	
  
allow	
  for	
  quicker	
  decision	
  making.	
  During	
  the	
  early	
  stages	
  of	
  multiple	
  interlinked	
  industry	
  evolution,	
  this	
  is	
  the	
  most	
  
appropriate	
  design	
  management	
  structure.	


Economies	
  of	
  Scale:	
  Scale	
  brings	
  unit	
  cost	
  reductions.	
  	
  Through	
  setting	
  out	
  a	
  geographic	
  strategy,	
  economies	
  of	
  scale	
  
can	
  be	
  accelerated	
  across	
  several	
  actions.	
  	
  These	
  economies	
  become	
  reinforcing,	
  reducing	
  the	
  state	
  sponsored	
  risk	
  
capital	
  required	
  to	
  reach	
  a	
  competitive	
  market	
  place.	
  	
  
Shared	
  Infrastructure:	
  This	
  is	
  a	
  consolidation	
  of	
  the	
  above	
  two,	
  but	
  warrants	
  separate	
  identification.
With	
  these	
  three	
  underlying	
  principals	
  we	
  can	
  set	
  a	
  foundation	
  for	
  a	
  geographically	
  targeted	
  enabling	
  action	
  plan,	
  
supported	
  by	
  an	
  overlapping	
  deployment	
  strategy	
  that	
  can	
  deliver	
  lowest	
  cost	
  emissions	
  reduction	
  for	
  the	
  UK’s	
  
obligations,	
  from	
  the	
  end	
  of	
  the	
  3rd carbon	
  budget	
  up	
  to	
  2050.	
  	
  
Electricity
Heat
Transport
Industrial
Action	
  6	
  and	
  7
Focused	
  Enabling	
  CCS	
  Infrastructure	
  
for	
  Industry	
  and	
  Power
Action	
  2
Targeted	
  Tidal	
  
Range	
  Capacity
Action	
  3	
  &	
  4
Targeted	
  Electrification	
  &	
  
Enabling	
  EV	
  Infrastructure
Action	
  3	
  &	
  4
Focused	
  Enabling	
  
Hydrogen	
  and	
  Fuel	
  Cell	
  
Infrastructure	
  
Action	
  5
Targeted	
  Industrial	
  
Biomass	
  Deployment
New	
  Wind	
  &	
  Solar	
  
With	
  Energy	
  Storage
Drives	
  Need	
  For	
  
Predictable	
  Tidal	
  
Range	
  Power
New	
  Capacity	
  
Enables	
  Heat	
  
Electrification
Enable	
  Regional	
  
Hydrogen	
  Grid	
  
Baseload	
  Volume	
  
Demand	
  for	
  CCS	
  
New	
  Capacity	
  
Enables	
  EV
Deployment
Hydrogen	
  Grid	
  
Enables	
  Fuel	
  Cell	
  
Deployment
Biomass	
  Deployment	
  
on	
  Industrial	
  
Processes	
  Reduces	
  
Emissions
Allows	
  2nd Stage	
  
Expansion	
  of	
  CCS	
  and	
  
Integrated	
  CCU
Provides	
  Low	
  Cost	
  
Platform	
  for	
  Flexible	
  
Power	
  and	
  3rd Stage	
  
CCS	
  Expansion
3
4
5
6
7
1
2
3
4
GEOGRAPHIC	
  INFRASTRUCTURE	
  
ENABLING
REINFORCING	
  INFRASTRUCTURE
DEVELOPMENT	
  PLAN

More Related Content

What's hot

Accounting for changes in investment flows in a soft-linked hybrid model
Accounting for changes in investment flows in a soft-linked hybrid modelAccounting for changes in investment flows in a soft-linked hybrid model
Accounting for changes in investment flows in a soft-linked hybrid modelIEA-ETSAP
 
2021 1H Consolidated results
2021 1H Consolidated results2021 1H Consolidated results
2021 1H Consolidated resultsSnam
 
Connecting the gaps: Energy demand projections and the disparity between curr...
Connecting the gaps: Energy demand projections and the disparity between curr...Connecting the gaps: Energy demand projections and the disparity between curr...
Connecting the gaps: Energy demand projections and the disparity between curr...IEA-ETSAP
 
Pushing the limits of TIAM - Achieving well-below 2 degrees scenarios
Pushing the limits of TIAM - Achieving well-below 2 degrees scenariosPushing the limits of TIAM - Achieving well-below 2 degrees scenarios
Pushing the limits of TIAM - Achieving well-below 2 degrees scenariosIEA-ETSAP
 
FY 2020 results
FY 2020 resultsFY 2020 results
FY 2020 resultsSnam
 
Policy feedback FGD (power) Indonesian 2019
Policy feedback FGD (power) Indonesian 2019Policy feedback FGD (power) Indonesian 2019
Policy feedback FGD (power) Indonesian 2019Danang Yogisworo
 
Energy in Ireland Report Launch 2021
Energy in Ireland Report Launch 2021Energy in Ireland Report Launch 2021
Energy in Ireland Report Launch 2021SustainableEnergyAut
 
FARCROSS project Innovative solutions for increased regional cross-border coo...
FARCROSS project Innovative solutions for increased regional cross-border coo...FARCROSS project Innovative solutions for increased regional cross-border coo...
FARCROSS project Innovative solutions for increased regional cross-border coo...Leonardo ENERGY
 
SEAI - National Energy Research and Policy Conference 2021 - Session 3
SEAI - National Energy Research and Policy Conference 2021 - Session 3SEAI - National Energy Research and Policy Conference 2021 - Session 3
SEAI - National Energy Research and Policy Conference 2021 - Session 3SustainableEnergyAut
 
Why Policy Matters - Renewable Energy Market Momentum at Risk - June 2015
Why Policy Matters - Renewable Energy Market Momentum at Risk - June 2015Why Policy Matters - Renewable Energy Market Momentum at Risk - June 2015
Why Policy Matters - Renewable Energy Market Momentum at Risk - June 2015Scott Clausen
 
7 andreas tuerk better_zagreb_09_12 10h03
7 andreas tuerk  better_zagreb_09_12 10h037 andreas tuerk  better_zagreb_09_12 10h03
7 andreas tuerk better_zagreb_09_12 10h03UNDPhr
 
EPA's Clean Power Plan: Basics and Implications of the Proposed CO2 Emissions...
EPA's Clean Power Plan: Basics and Implications of the Proposed CO2 Emissions...EPA's Clean Power Plan: Basics and Implications of the Proposed CO2 Emissions...
EPA's Clean Power Plan: Basics and Implications of the Proposed CO2 Emissions...The Brattle Group
 
Electric vehicle grid integration policies to benefit consumers
Electric vehicle grid integration policies to benefit consumersElectric vehicle grid integration policies to benefit consumers
Electric vehicle grid integration policies to benefit consumersLeonardo ENERGY
 
Snam 2020 - 1Q Results
Snam 2020 - 1Q Results Snam 2020 - 1Q Results
Snam 2020 - 1Q Results Snam
 
SEAI - National Energy Research and Policy Conference 2021 - Session 2
SEAI - National Energy Research and Policy Conference 2021 - Session 2SEAI - National Energy Research and Policy Conference 2021 - Session 2
SEAI - National Energy Research and Policy Conference 2021 - Session 2SustainableEnergyAut
 
Implementing Agreement for Co-operation in the Research, Development and Depl...
Implementing Agreement for Co-operation in the Research, Development and Depl...Implementing Agreement for Co-operation in the Research, Development and Depl...
Implementing Agreement for Co-operation in the Research, Development and Depl...SustainableEnergyAut
 
The benefits of european TSO cooperation, Peder Ø. Andreasen, ENTSO-E, Sähköv...
The benefits of european TSO cooperation, Peder Ø. Andreasen, ENTSO-E, Sähköv...The benefits of european TSO cooperation, Peder Ø. Andreasen, ENTSO-E, Sähköv...
The benefits of european TSO cooperation, Peder Ø. Andreasen, ENTSO-E, Sähköv...Fingrid Oyj
 
EGK 2011: Energy 01 LAFTO TURBINE
EGK 2011: Energy 01 LAFTO TURBINEEGK 2011: Energy 01 LAFTO TURBINE
EGK 2011: Energy 01 LAFTO TURBINEicebauhaus
 
A Generalized Equilibrium Approach to Balance the Residual Abatements Resulti...
A Generalized Equilibrium Approach to Balance the Residual Abatements Resulti...A Generalized Equilibrium Approach to Balance the Residual Abatements Resulti...
A Generalized Equilibrium Approach to Balance the Residual Abatements Resulti...IEA-ETSAP
 
OECD-ENV Vietnam questionnaire key points
OECD-ENV Vietnam questionnaire key pointsOECD-ENV Vietnam questionnaire key points
OECD-ENV Vietnam questionnaire key pointsOECD Environment
 

What's hot (20)

Accounting for changes in investment flows in a soft-linked hybrid model
Accounting for changes in investment flows in a soft-linked hybrid modelAccounting for changes in investment flows in a soft-linked hybrid model
Accounting for changes in investment flows in a soft-linked hybrid model
 
2021 1H Consolidated results
2021 1H Consolidated results2021 1H Consolidated results
2021 1H Consolidated results
 
Connecting the gaps: Energy demand projections and the disparity between curr...
Connecting the gaps: Energy demand projections and the disparity between curr...Connecting the gaps: Energy demand projections and the disparity between curr...
Connecting the gaps: Energy demand projections and the disparity between curr...
 
Pushing the limits of TIAM - Achieving well-below 2 degrees scenarios
Pushing the limits of TIAM - Achieving well-below 2 degrees scenariosPushing the limits of TIAM - Achieving well-below 2 degrees scenarios
Pushing the limits of TIAM - Achieving well-below 2 degrees scenarios
 
FY 2020 results
FY 2020 resultsFY 2020 results
FY 2020 results
 
Policy feedback FGD (power) Indonesian 2019
Policy feedback FGD (power) Indonesian 2019Policy feedback FGD (power) Indonesian 2019
Policy feedback FGD (power) Indonesian 2019
 
Energy in Ireland Report Launch 2021
Energy in Ireland Report Launch 2021Energy in Ireland Report Launch 2021
Energy in Ireland Report Launch 2021
 
FARCROSS project Innovative solutions for increased regional cross-border coo...
FARCROSS project Innovative solutions for increased regional cross-border coo...FARCROSS project Innovative solutions for increased regional cross-border coo...
FARCROSS project Innovative solutions for increased regional cross-border coo...
 
SEAI - National Energy Research and Policy Conference 2021 - Session 3
SEAI - National Energy Research and Policy Conference 2021 - Session 3SEAI - National Energy Research and Policy Conference 2021 - Session 3
SEAI - National Energy Research and Policy Conference 2021 - Session 3
 
Why Policy Matters - Renewable Energy Market Momentum at Risk - June 2015
Why Policy Matters - Renewable Energy Market Momentum at Risk - June 2015Why Policy Matters - Renewable Energy Market Momentum at Risk - June 2015
Why Policy Matters - Renewable Energy Market Momentum at Risk - June 2015
 
7 andreas tuerk better_zagreb_09_12 10h03
7 andreas tuerk  better_zagreb_09_12 10h037 andreas tuerk  better_zagreb_09_12 10h03
7 andreas tuerk better_zagreb_09_12 10h03
 
EPA's Clean Power Plan: Basics and Implications of the Proposed CO2 Emissions...
EPA's Clean Power Plan: Basics and Implications of the Proposed CO2 Emissions...EPA's Clean Power Plan: Basics and Implications of the Proposed CO2 Emissions...
EPA's Clean Power Plan: Basics and Implications of the Proposed CO2 Emissions...
 
Electric vehicle grid integration policies to benefit consumers
Electric vehicle grid integration policies to benefit consumersElectric vehicle grid integration policies to benefit consumers
Electric vehicle grid integration policies to benefit consumers
 
Snam 2020 - 1Q Results
Snam 2020 - 1Q Results Snam 2020 - 1Q Results
Snam 2020 - 1Q Results
 
SEAI - National Energy Research and Policy Conference 2021 - Session 2
SEAI - National Energy Research and Policy Conference 2021 - Session 2SEAI - National Energy Research and Policy Conference 2021 - Session 2
SEAI - National Energy Research and Policy Conference 2021 - Session 2
 
Implementing Agreement for Co-operation in the Research, Development and Depl...
Implementing Agreement for Co-operation in the Research, Development and Depl...Implementing Agreement for Co-operation in the Research, Development and Depl...
Implementing Agreement for Co-operation in the Research, Development and Depl...
 
The benefits of european TSO cooperation, Peder Ø. Andreasen, ENTSO-E, Sähköv...
The benefits of european TSO cooperation, Peder Ø. Andreasen, ENTSO-E, Sähköv...The benefits of european TSO cooperation, Peder Ø. Andreasen, ENTSO-E, Sähköv...
The benefits of european TSO cooperation, Peder Ø. Andreasen, ENTSO-E, Sähköv...
 
EGK 2011: Energy 01 LAFTO TURBINE
EGK 2011: Energy 01 LAFTO TURBINEEGK 2011: Energy 01 LAFTO TURBINE
EGK 2011: Energy 01 LAFTO TURBINE
 
A Generalized Equilibrium Approach to Balance the Residual Abatements Resulti...
A Generalized Equilibrium Approach to Balance the Residual Abatements Resulti...A Generalized Equilibrium Approach to Balance the Residual Abatements Resulti...
A Generalized Equilibrium Approach to Balance the Residual Abatements Resulti...
 
OECD-ENV Vietnam questionnaire key points
OECD-ENV Vietnam questionnaire key pointsOECD-ENV Vietnam questionnaire key points
OECD-ENV Vietnam questionnaire key points
 

Similar to Emission Statement - Issue 5 - Infrastructure

Emission Statement - Technology Design - Issue 3
Emission Statement - Technology Design -  Issue 3Emission Statement - Technology Design -  Issue 3
Emission Statement - Technology Design - Issue 3Grant Budge
 
Summary of NETR Published by PWC - Sep 2023
Summary of NETR Published by PWC - Sep 2023Summary of NETR Published by PWC - Sep 2023
Summary of NETR Published by PWC - Sep 2023WeiCongTan4
 
Emission Statement - Issue 2 - Application
Emission Statement - Issue 2 - ApplicationEmission Statement - Issue 2 - Application
Emission Statement - Issue 2 - ApplicationGrant Budge
 
Linlithgow Natural Grid_Initial Report
Linlithgow Natural Grid_Initial ReportLinlithgow Natural Grid_Initial Report
Linlithgow Natural Grid_Initial ReportChrisJCook
 
Sample energy saving proposal
Sample energy saving proposalSample energy saving proposal
Sample energy saving proposalRoyal Mail
 
Bioenergy insights-into-the-future-uk-bioenergy-sector-gained-using-the-et is...
Bioenergy insights-into-the-future-uk-bioenergy-sector-gained-using-the-et is...Bioenergy insights-into-the-future-uk-bioenergy-sector-gained-using-the-et is...
Bioenergy insights-into-the-future-uk-bioenergy-sector-gained-using-the-et is...Ivy Chen
 
Connectix Commercial Overview Dc Session 5 The Uk Carbon Reduction Commit...
Connectix Commercial Overview   Dc Session 5   The Uk Carbon Reduction Commit...Connectix Commercial Overview   Dc Session 5   The Uk Carbon Reduction Commit...
Connectix Commercial Overview Dc Session 5 The Uk Carbon Reduction Commit...paul_mathews
 
Planning for a sustainable transmission service and grid – an approach to max...
Planning for a sustainable transmission service and grid – an approach to max...Planning for a sustainable transmission service and grid – an approach to max...
Planning for a sustainable transmission service and grid – an approach to max...Power System Operation
 
KIC Coal and Gas Technologies Report
KIC Coal and Gas Technologies ReportKIC Coal and Gas Technologies Report
KIC Coal and Gas Technologies ReportMarcin Lewenstein
 
THE CHALLENGES AND OPPORTUNITIES FOR LOCAL AREA ENERGY SYSTEMS IN THE UK ENER...
THE CHALLENGES AND OPPORTUNITIES FOR LOCAL AREA ENERGY SYSTEMS IN THE UK ENER...THE CHALLENGES AND OPPORTUNITIES FOR LOCAL AREA ENERGY SYSTEMS IN THE UK ENER...
THE CHALLENGES AND OPPORTUNITIES FOR LOCAL AREA ENERGY SYSTEMS IN THE UK ENER...Peter Jones
 
energy assessments5
energy assessments5energy assessments5
energy assessments5Steve Tester
 
SMART Seminar: Governance of Integrated Infrastructure
SMART Seminar: Governance of Integrated InfrastructureSMART Seminar: Governance of Integrated Infrastructure
SMART Seminar: Governance of Integrated InfrastructureSMART Infrastructure Facility
 
Using the TIMES-Ireland Model (TIM) to understand Ireland's Carbon Budget imp...
Using the TIMES-Ireland Model (TIM) to understand Ireland's Carbon Budget imp...Using the TIMES-Ireland Model (TIM) to understand Ireland's Carbon Budget imp...
Using the TIMES-Ireland Model (TIM) to understand Ireland's Carbon Budget imp...IEA-ETSAP
 
Educause Green It Summit Nov 13
Educause Green It Summit   Nov 13Educause Green It Summit   Nov 13
Educause Green It Summit Nov 13Bill St. Arnaud
 

Similar to Emission Statement - Issue 5 - Infrastructure (20)

Emission Statement - Technology Design - Issue 3
Emission Statement - Technology Design -  Issue 3Emission Statement - Technology Design -  Issue 3
Emission Statement - Technology Design - Issue 3
 
Summary of NETR Published by PWC - Sep 2023
Summary of NETR Published by PWC - Sep 2023Summary of NETR Published by PWC - Sep 2023
Summary of NETR Published by PWC - Sep 2023
 
Sgcp14ellerington
Sgcp14elleringtonSgcp14ellerington
Sgcp14ellerington
 
Emission Statement - Issue 2 - Application
Emission Statement - Issue 2 - ApplicationEmission Statement - Issue 2 - Application
Emission Statement - Issue 2 - Application
 
Linlithgow Natural Grid_Initial Report
Linlithgow Natural Grid_Initial ReportLinlithgow Natural Grid_Initial Report
Linlithgow Natural Grid_Initial Report
 
WB alternative energy
WB alternative energyWB alternative energy
WB alternative energy
 
Sample energy saving proposal
Sample energy saving proposalSample energy saving proposal
Sample energy saving proposal
 
Bioenergy insights-into-the-future-uk-bioenergy-sector-gained-using-the-et is...
Bioenergy insights-into-the-future-uk-bioenergy-sector-gained-using-the-et is...Bioenergy insights-into-the-future-uk-bioenergy-sector-gained-using-the-et is...
Bioenergy insights-into-the-future-uk-bioenergy-sector-gained-using-the-et is...
 
CCS Financing January 09
CCS Financing January 09CCS Financing January 09
CCS Financing January 09
 
Connectix Commercial Overview Dc Session 5 The Uk Carbon Reduction Commit...
Connectix Commercial Overview   Dc Session 5   The Uk Carbon Reduction Commit...Connectix Commercial Overview   Dc Session 5   The Uk Carbon Reduction Commit...
Connectix Commercial Overview Dc Session 5 The Uk Carbon Reduction Commit...
 
Planning for a sustainable transmission service and grid – an approach to max...
Planning for a sustainable transmission service and grid – an approach to max...Planning for a sustainable transmission service and grid – an approach to max...
Planning for a sustainable transmission service and grid – an approach to max...
 
KIC Coal and Gas Technologies Report
KIC Coal and Gas Technologies ReportKIC Coal and Gas Technologies Report
KIC Coal and Gas Technologies Report
 
marine_action_plan
marine_action_planmarine_action_plan
marine_action_plan
 
THE CHALLENGES AND OPPORTUNITIES FOR LOCAL AREA ENERGY SYSTEMS IN THE UK ENER...
THE CHALLENGES AND OPPORTUNITIES FOR LOCAL AREA ENERGY SYSTEMS IN THE UK ENER...THE CHALLENGES AND OPPORTUNITIES FOR LOCAL AREA ENERGY SYSTEMS IN THE UK ENER...
THE CHALLENGES AND OPPORTUNITIES FOR LOCAL AREA ENERGY SYSTEMS IN THE UK ENER...
 
Energy Policy in Wales
Energy Policy in WalesEnergy Policy in Wales
Energy Policy in Wales
 
energy assessments5
energy assessments5energy assessments5
energy assessments5
 
SMART Seminar: Governance of Integrated Infrastructure
SMART Seminar: Governance of Integrated InfrastructureSMART Seminar: Governance of Integrated Infrastructure
SMART Seminar: Governance of Integrated Infrastructure
 
Sgcp13ellerington
Sgcp13elleringtonSgcp13ellerington
Sgcp13ellerington
 
Using the TIMES-Ireland Model (TIM) to understand Ireland's Carbon Budget imp...
Using the TIMES-Ireland Model (TIM) to understand Ireland's Carbon Budget imp...Using the TIMES-Ireland Model (TIM) to understand Ireland's Carbon Budget imp...
Using the TIMES-Ireland Model (TIM) to understand Ireland's Carbon Budget imp...
 
Educause Green It Summit Nov 13
Educause Green It Summit   Nov 13Educause Green It Summit   Nov 13
Educause Green It Summit Nov 13
 

Recently uploaded

VIP Call Girls Mahadevpur Colony ( Hyderabad ) Phone 8250192130 | ₹5k To 25k ...
VIP Call Girls Mahadevpur Colony ( Hyderabad ) Phone 8250192130 | ₹5k To 25k ...VIP Call Girls Mahadevpur Colony ( Hyderabad ) Phone 8250192130 | ₹5k To 25k ...
VIP Call Girls Mahadevpur Colony ( Hyderabad ) Phone 8250192130 | ₹5k To 25k ...Suhani Kapoor
 
Call On 6297143586 Pimpri Chinchwad Call Girls In All Pune 24/7 Provide Call...
Call On 6297143586  Pimpri Chinchwad Call Girls In All Pune 24/7 Provide Call...Call On 6297143586  Pimpri Chinchwad Call Girls In All Pune 24/7 Provide Call...
Call On 6297143586 Pimpri Chinchwad Call Girls In All Pune 24/7 Provide Call...tanu pandey
 
Verified Trusted Kalyani Nagar Call Girls 8005736733 𝐈𝐍𝐃𝐄𝐏𝐄𝐍𝐃𝐄𝐍𝐓 Call 𝐆𝐈𝐑𝐋 𝐕...
Verified Trusted Kalyani Nagar Call Girls  8005736733 𝐈𝐍𝐃𝐄𝐏𝐄𝐍𝐃𝐄𝐍𝐓 Call 𝐆𝐈𝐑𝐋 𝐕...Verified Trusted Kalyani Nagar Call Girls  8005736733 𝐈𝐍𝐃𝐄𝐏𝐄𝐍𝐃𝐄𝐍𝐓 Call 𝐆𝐈𝐑𝐋 𝐕...
Verified Trusted Kalyani Nagar Call Girls 8005736733 𝐈𝐍𝐃𝐄𝐏𝐄𝐍𝐃𝐄𝐍𝐓 Call 𝐆𝐈𝐑𝐋 𝐕...tanu pandey
 
Hot Call Girls |Delhi |Preet Vihar ☎ 9711199171 Book Your One night Stand
Hot Call Girls |Delhi |Preet Vihar ☎ 9711199171 Book Your One night StandHot Call Girls |Delhi |Preet Vihar ☎ 9711199171 Book Your One night Stand
Hot Call Girls |Delhi |Preet Vihar ☎ 9711199171 Book Your One night Standkumarajju5765
 
Call Girls Magarpatta Call Me 7737669865 Budget Friendly No Advance Booking
Call Girls Magarpatta Call Me 7737669865 Budget Friendly No Advance BookingCall Girls Magarpatta Call Me 7737669865 Budget Friendly No Advance Booking
Call Girls Magarpatta Call Me 7737669865 Budget Friendly No Advance Bookingroncy bisnoi
 
(ANAYA) Call Girls Hadapsar ( 7001035870 ) HI-Fi Pune Escorts Service
(ANAYA) Call Girls Hadapsar ( 7001035870 ) HI-Fi Pune Escorts Service(ANAYA) Call Girls Hadapsar ( 7001035870 ) HI-Fi Pune Escorts Service
(ANAYA) Call Girls Hadapsar ( 7001035870 ) HI-Fi Pune Escorts Serviceranjana rawat
 
VIP Call Girls Service Chaitanyapuri Hyderabad Call +91-8250192130
VIP Call Girls Service Chaitanyapuri Hyderabad Call +91-8250192130VIP Call Girls Service Chaitanyapuri Hyderabad Call +91-8250192130
VIP Call Girls Service Chaitanyapuri Hyderabad Call +91-8250192130Suhani Kapoor
 
Call Girls In Faridabad(Ballabgarh) Book ☎ 8168257667, @4999
Call Girls In Faridabad(Ballabgarh) Book ☎ 8168257667, @4999Call Girls In Faridabad(Ballabgarh) Book ☎ 8168257667, @4999
Call Girls In Faridabad(Ballabgarh) Book ☎ 8168257667, @4999Tina Ji
 
Call Girls Budhwar Peth Call Me 7737669865 Budget Friendly No Advance Booking
Call Girls Budhwar Peth Call Me 7737669865 Budget Friendly No Advance BookingCall Girls Budhwar Peth Call Me 7737669865 Budget Friendly No Advance Booking
Call Girls Budhwar Peth Call Me 7737669865 Budget Friendly No Advance Bookingroncy bisnoi
 
BOOK Call Girls in (Dwarka) CALL | 8377087607 Delhi Escorts Services
BOOK Call Girls in (Dwarka) CALL | 8377087607 Delhi Escorts ServicesBOOK Call Girls in (Dwarka) CALL | 8377087607 Delhi Escorts Services
BOOK Call Girls in (Dwarka) CALL | 8377087607 Delhi Escorts Servicesdollysharma2066
 
Proposed Amendments to Chapter 15, Article X: Wetland Conservation Areas
Proposed Amendments to Chapter 15, Article X: Wetland Conservation AreasProposed Amendments to Chapter 15, Article X: Wetland Conservation Areas
Proposed Amendments to Chapter 15, Article X: Wetland Conservation Areas💥Victoria K. Colangelo
 
CSR_Module5_Green Earth Initiative, Tree Planting Day
CSR_Module5_Green Earth Initiative, Tree Planting DayCSR_Module5_Green Earth Initiative, Tree Planting Day
CSR_Module5_Green Earth Initiative, Tree Planting DayGeorgeDiamandis11
 
Russian Call Girls Nashik Anjali 7001305949 Independent Escort Service Nashik
Russian Call Girls Nashik Anjali 7001305949 Independent Escort Service NashikRussian Call Girls Nashik Anjali 7001305949 Independent Escort Service Nashik
Russian Call Girls Nashik Anjali 7001305949 Independent Escort Service Nashikranjana rawat
 
The Most Attractive Pune Call Girls Shirwal 8250192130 Will You Miss This Cha...
The Most Attractive Pune Call Girls Shirwal 8250192130 Will You Miss This Cha...The Most Attractive Pune Call Girls Shirwal 8250192130 Will You Miss This Cha...
The Most Attractive Pune Call Girls Shirwal 8250192130 Will You Miss This Cha...ranjana rawat
 
VIP Call Girls Moti Ganpur ( Hyderabad ) Phone 8250192130 | ₹5k To 25k With R...
VIP Call Girls Moti Ganpur ( Hyderabad ) Phone 8250192130 | ₹5k To 25k With R...VIP Call Girls Moti Ganpur ( Hyderabad ) Phone 8250192130 | ₹5k To 25k With R...
VIP Call Girls Moti Ganpur ( Hyderabad ) Phone 8250192130 | ₹5k To 25k With R...Suhani Kapoor
 
CSR_Tested activities in the classroom -EN
CSR_Tested activities in the classroom -ENCSR_Tested activities in the classroom -EN
CSR_Tested activities in the classroom -ENGeorgeDiamandis11
 
webinaire-green-mirror-episode-2-Smart contracts and virtual purchase agreeme...
webinaire-green-mirror-episode-2-Smart contracts and virtual purchase agreeme...webinaire-green-mirror-episode-2-Smart contracts and virtual purchase agreeme...
webinaire-green-mirror-episode-2-Smart contracts and virtual purchase agreeme...Cluster TWEED
 
Call Girls Ramtek Call Me 7737669865 Budget Friendly No Advance Booking
Call Girls Ramtek Call Me 7737669865 Budget Friendly No Advance BookingCall Girls Ramtek Call Me 7737669865 Budget Friendly No Advance Booking
Call Girls Ramtek Call Me 7737669865 Budget Friendly No Advance Bookingroncy bisnoi
 
Booking open Available Pune Call Girls Parvati Darshan 6297143586 Call Hot I...
Booking open Available Pune Call Girls Parvati Darshan  6297143586 Call Hot I...Booking open Available Pune Call Girls Parvati Darshan  6297143586 Call Hot I...
Booking open Available Pune Call Girls Parvati Darshan 6297143586 Call Hot I...Call Girls in Nagpur High Profile
 

Recently uploaded (20)

VIP Call Girls Mahadevpur Colony ( Hyderabad ) Phone 8250192130 | ₹5k To 25k ...
VIP Call Girls Mahadevpur Colony ( Hyderabad ) Phone 8250192130 | ₹5k To 25k ...VIP Call Girls Mahadevpur Colony ( Hyderabad ) Phone 8250192130 | ₹5k To 25k ...
VIP Call Girls Mahadevpur Colony ( Hyderabad ) Phone 8250192130 | ₹5k To 25k ...
 
Call On 6297143586 Pimpri Chinchwad Call Girls In All Pune 24/7 Provide Call...
Call On 6297143586  Pimpri Chinchwad Call Girls In All Pune 24/7 Provide Call...Call On 6297143586  Pimpri Chinchwad Call Girls In All Pune 24/7 Provide Call...
Call On 6297143586 Pimpri Chinchwad Call Girls In All Pune 24/7 Provide Call...
 
Call Girls In Pratap Nagar꧁❤ 🔝 9953056974🔝❤꧂ Escort ServiCe
Call Girls In Pratap Nagar꧁❤ 🔝 9953056974🔝❤꧂ Escort ServiCeCall Girls In Pratap Nagar꧁❤ 🔝 9953056974🔝❤꧂ Escort ServiCe
Call Girls In Pratap Nagar꧁❤ 🔝 9953056974🔝❤꧂ Escort ServiCe
 
Verified Trusted Kalyani Nagar Call Girls 8005736733 𝐈𝐍𝐃𝐄𝐏𝐄𝐍𝐃𝐄𝐍𝐓 Call 𝐆𝐈𝐑𝐋 𝐕...
Verified Trusted Kalyani Nagar Call Girls  8005736733 𝐈𝐍𝐃𝐄𝐏𝐄𝐍𝐃𝐄𝐍𝐓 Call 𝐆𝐈𝐑𝐋 𝐕...Verified Trusted Kalyani Nagar Call Girls  8005736733 𝐈𝐍𝐃𝐄𝐏𝐄𝐍𝐃𝐄𝐍𝐓 Call 𝐆𝐈𝐑𝐋 𝐕...
Verified Trusted Kalyani Nagar Call Girls 8005736733 𝐈𝐍𝐃𝐄𝐏𝐄𝐍𝐃𝐄𝐍𝐓 Call 𝐆𝐈𝐑𝐋 𝐕...
 
Hot Call Girls |Delhi |Preet Vihar ☎ 9711199171 Book Your One night Stand
Hot Call Girls |Delhi |Preet Vihar ☎ 9711199171 Book Your One night StandHot Call Girls |Delhi |Preet Vihar ☎ 9711199171 Book Your One night Stand
Hot Call Girls |Delhi |Preet Vihar ☎ 9711199171 Book Your One night Stand
 
Call Girls Magarpatta Call Me 7737669865 Budget Friendly No Advance Booking
Call Girls Magarpatta Call Me 7737669865 Budget Friendly No Advance BookingCall Girls Magarpatta Call Me 7737669865 Budget Friendly No Advance Booking
Call Girls Magarpatta Call Me 7737669865 Budget Friendly No Advance Booking
 
(ANAYA) Call Girls Hadapsar ( 7001035870 ) HI-Fi Pune Escorts Service
(ANAYA) Call Girls Hadapsar ( 7001035870 ) HI-Fi Pune Escorts Service(ANAYA) Call Girls Hadapsar ( 7001035870 ) HI-Fi Pune Escorts Service
(ANAYA) Call Girls Hadapsar ( 7001035870 ) HI-Fi Pune Escorts Service
 
VIP Call Girls Service Chaitanyapuri Hyderabad Call +91-8250192130
VIP Call Girls Service Chaitanyapuri Hyderabad Call +91-8250192130VIP Call Girls Service Chaitanyapuri Hyderabad Call +91-8250192130
VIP Call Girls Service Chaitanyapuri Hyderabad Call +91-8250192130
 
Call Girls In Faridabad(Ballabgarh) Book ☎ 8168257667, @4999
Call Girls In Faridabad(Ballabgarh) Book ☎ 8168257667, @4999Call Girls In Faridabad(Ballabgarh) Book ☎ 8168257667, @4999
Call Girls In Faridabad(Ballabgarh) Book ☎ 8168257667, @4999
 
Call Girls Budhwar Peth Call Me 7737669865 Budget Friendly No Advance Booking
Call Girls Budhwar Peth Call Me 7737669865 Budget Friendly No Advance BookingCall Girls Budhwar Peth Call Me 7737669865 Budget Friendly No Advance Booking
Call Girls Budhwar Peth Call Me 7737669865 Budget Friendly No Advance Booking
 
BOOK Call Girls in (Dwarka) CALL | 8377087607 Delhi Escorts Services
BOOK Call Girls in (Dwarka) CALL | 8377087607 Delhi Escorts ServicesBOOK Call Girls in (Dwarka) CALL | 8377087607 Delhi Escorts Services
BOOK Call Girls in (Dwarka) CALL | 8377087607 Delhi Escorts Services
 
Proposed Amendments to Chapter 15, Article X: Wetland Conservation Areas
Proposed Amendments to Chapter 15, Article X: Wetland Conservation AreasProposed Amendments to Chapter 15, Article X: Wetland Conservation Areas
Proposed Amendments to Chapter 15, Article X: Wetland Conservation Areas
 
CSR_Module5_Green Earth Initiative, Tree Planting Day
CSR_Module5_Green Earth Initiative, Tree Planting DayCSR_Module5_Green Earth Initiative, Tree Planting Day
CSR_Module5_Green Earth Initiative, Tree Planting Day
 
Russian Call Girls Nashik Anjali 7001305949 Independent Escort Service Nashik
Russian Call Girls Nashik Anjali 7001305949 Independent Escort Service NashikRussian Call Girls Nashik Anjali 7001305949 Independent Escort Service Nashik
Russian Call Girls Nashik Anjali 7001305949 Independent Escort Service Nashik
 
The Most Attractive Pune Call Girls Shirwal 8250192130 Will You Miss This Cha...
The Most Attractive Pune Call Girls Shirwal 8250192130 Will You Miss This Cha...The Most Attractive Pune Call Girls Shirwal 8250192130 Will You Miss This Cha...
The Most Attractive Pune Call Girls Shirwal 8250192130 Will You Miss This Cha...
 
VIP Call Girls Moti Ganpur ( Hyderabad ) Phone 8250192130 | ₹5k To 25k With R...
VIP Call Girls Moti Ganpur ( Hyderabad ) Phone 8250192130 | ₹5k To 25k With R...VIP Call Girls Moti Ganpur ( Hyderabad ) Phone 8250192130 | ₹5k To 25k With R...
VIP Call Girls Moti Ganpur ( Hyderabad ) Phone 8250192130 | ₹5k To 25k With R...
 
CSR_Tested activities in the classroom -EN
CSR_Tested activities in the classroom -ENCSR_Tested activities in the classroom -EN
CSR_Tested activities in the classroom -EN
 
webinaire-green-mirror-episode-2-Smart contracts and virtual purchase agreeme...
webinaire-green-mirror-episode-2-Smart contracts and virtual purchase agreeme...webinaire-green-mirror-episode-2-Smart contracts and virtual purchase agreeme...
webinaire-green-mirror-episode-2-Smart contracts and virtual purchase agreeme...
 
Call Girls Ramtek Call Me 7737669865 Budget Friendly No Advance Booking
Call Girls Ramtek Call Me 7737669865 Budget Friendly No Advance BookingCall Girls Ramtek Call Me 7737669865 Budget Friendly No Advance Booking
Call Girls Ramtek Call Me 7737669865 Budget Friendly No Advance Booking
 
Booking open Available Pune Call Girls Parvati Darshan 6297143586 Call Hot I...
Booking open Available Pune Call Girls Parvati Darshan  6297143586 Call Hot I...Booking open Available Pune Call Girls Parvati Darshan  6297143586 Call Hot I...
Booking open Available Pune Call Girls Parvati Darshan 6297143586 Call Hot I...
 

Emission Statement - Issue 5 - Infrastructure

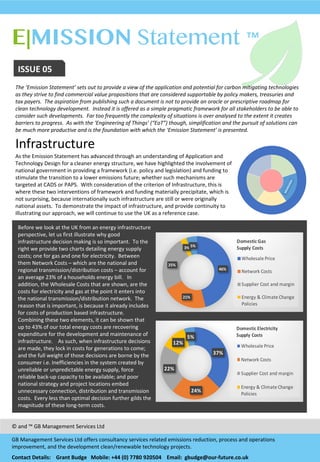
  • 1. E|MISSION Statement ™ EMAIL enquiries@our- future.co.uk ISSUE  05 The  ‘Emission  Statement’  sets  out  to  provide  a  view  of  the  application  and  potential  for  carbon  mitigating  technologies   as  they  strive  to  find  commercial  value  propositions  that  are  considered  supportable  by  policy  makers,  treasuries  and   tax  payers.    The  aspiration  from  publishing  such  a  document  is  not  to  provide  an  oracle  or  prescriptive  roadmap  for   clean  technology  development.    Instead  it  is  offered  as  a  simple  pragmatic  framework  for  all  stakeholders  to  be  able  to   consider  such  developments.    Far  too  frequently  the  complexity  of  situations  is  over  analysed  to  the  extent  it  creates   barriers  to  progress.    As  with  the  ‘Engineering  of  Things’  (“EoT”)  though,  simplification  and  the  pursuit  of  solutions  can   be  much  more  productive  and  is  the  foundation  with  which  the  ‘Emission  Statement’  is  presented. Infrastructure As  the  Emission  Statement  has  advanced  through  an  understanding  of  Application  and   Technology  Design  for  a  cleaner  energy  structure,  we  have  highlighted  the  involvement  of   national  government  in  providing  a  framework  (i.e.  policy  and  legislation)  and  funding  to   stimulate  the  transition  to  a  lower  emissions  future;  whether  such  mechanisms  are   targeted  at  CADS  or  PAPS.   With  consideration  of  the  criterion  of  Infrastructure,  this  is   where  these  two  interventions  of  framework  and  funding  materially  precipitate,  which  is   not  surprising,  because  internationally  such  infrastructure  are  still  or  were  originally   national  assets.    To  demonstrate  the  impact  of  infrastructure,  and  provide  continuity  to   illustrating  our  approach,  we  will  continue  to  use  the  UK  as  a  reference  case. ©  and  ™  GB  Management  Services  Ltd GB  Management  Services  Ltd  offers  consultancy  services  related  emissions  reduction,  process  and  operations   improvement,  and  the  development  clean/renewable  technology  projects.   Contact  Details:        Grant  Budge      Mobile:  +44  (0)  7780  920504 Email:    gbudge@our-­‐future.co.uk Risk Management 46% 21% 25% 3% 5% Domestic0Gas Supply0Costs Wholesale(Price Network(Costs Supplier(Cost(and(margin Energy(&(Climate(Change( Policies 37% 24% 22% 12% 5% Domestic0Electricity0 Supply0Costs Wholesale(Price Network(Costs Supplier(Cost(and(margin Energy(&(Climate(Change( Policies Before  we  look  at  the  UK  from  an  energy  infrastructure   perspective,  let  us  first  illustrate  why  good   infrastructure  decision  making  is  so  important.    To  the   right  we  provide  two  charts  detailing  energy  supply   costs;  one  for  gas  and  one  for  electricity.    Between   them  Network  Costs  – which  are  the  national  and   regional  transmission/distribution  costs  – account  for   an  average  23%  of  a  households  energy  bill.      In   addition,  the  Wholesale  Costs  that  are  shown,  are  the   costs  for  electricity  and  gas  at  the  point  it  enters  into   the  national  transmission/distribution  network.    The   reason  that  is  important,  is  because  it  already  includes   for  costs  of  production  based  infrastructure.     Combining  these  two  elements,  it  can  be  shown  that   up  to  43%  of  our  total  energy  costs  are  recovering   expenditure  for  the  development  and  maintenance  of   infrastructure.        As  such,  when  infrastructure  decisions   are  made,  they  lock  in  costs  for  generations  to  come;   and  the  full  weight  of  those  decisions  are  borne  by  the   consumer  i.e.  Inefficiencies  in  the  system  created  by   unreliable  or  unpredictable  energy  supply,  force   reliable  back-­‐up  capacity  to  be  available;  and  poor   national  strategy  and  project  locations  embed   unnecessary  connection,  distribution  and  transmission   costs.    Every  less  than  optimal  decision  further  gilds  the   magnitude  of  these  long-­‐term  costs.  
  • 2. ©  GB  Management  Services  Ltd Contact  Details:        Grant  Budge      Mobile:  +44  (0)  7780  920504 Email:    gbudge@our-­‐future.co.uk E|MISSION Statement ™ For  many  countries,  including  the  United  Kingdom,  Demand  Reduction  and  Source  Substitution  programmes  have   already  yielded  environmental  benefits;  and  the  realisation  that  the  more  challenging  pathways  now  need  to  be   progressed  has  dawned.    So  how  do  we  navigate  this  challenge.    First  it  is  important  for  a  nation  to  have  completed  a   preliminary  plan  like  the  one  proposed  for  the  UK  in  Issue  4.    Following  which  they  should  profile  what  infrastructure   already  exists  to  support  that  plan.     For  our  infrastructure  review  we  will  consider  three  set  of  assets:  electricity  distribution  assets,  gas  distribution  assets,   and  large  scale  emissions  assets  (power  and  industrial).    Through  the  assessment  of  these,  we  propose  to  overlay  the   plan  detailed  in  Issue  4  and  attribute  a  geographical  basis  for  its  deployment.    At  the  heart  of  this  assessment  will  be  the   EoT philosophy  of  Core  Process  Optimisation.    The  process  here  being  how  to  best  enable  the  action  plan.    And  while   we  do  not  desire  to  become  UK  centric  in  using  the  Emissions  Model  framework,  we  will  be  cognisant  in  our  illustration   of  the  recent  Parliamentary  review  which  identified  two  significant  failures  from  state  intervention  in  the  electricity   market  so  far:  insecurity  of  supply  and  energy  prices. The  basic  design  for  both  the  gas  and   electricity  transmission  systems  is   over  50  years  old,  and  is   geographically  based  on  a  fossil  fuel   architecture  related  to  domestic  coal   and  gas  production  regions.     Major  points  of  landfall  for  natural   gas  supplies  are  at  St  Fergus,   Easington,  Theddlethorpe and   Bacton.    These  have  more  recently   been  augmented  by  LNG  terminals  in   South  Wales  and  Kent.    And   electricity  transmission  emanates   from  the  North  East,  South  Wales,   Staffordshire,  Nottinghamshire  and   Yorkshire;  initiated  by  the  historic   coal  production  in  these  areas.  It  is   the  availability  and  development  of   this  infrastructure  that  today’s   Network  Costs  supports. Each  time  a  new  production  asset  is   established  away  from  this   infrastructure,  new  long  term   network  costs  are  created.    While   this  has  been  inevitable  for   renewables,  nature  prescribing  their   location;  it  should  not  be  accepted  as   plans  to  continue  Source   Substitution,  and  then  deliver   Demand  Substitution,  Source   Mitigation  and  Source  Containment   are  implemented.    With  these  latter   three  in  particular,  we  should  seek  to   minimise  infrastructure  costs,   beyond  those  required  for  that   particular  Technology  Design.   So  accepting  the  network   architecture  illustrated,  how  should Transmission) Network Scottish( Electricity( Transmission(System English(Electricity( Transmission(System Gas(Transmission(System Terminal LNG(Terminal((National( Grid) LNG(Terminal Gas(Interconnector Electricity( Interconnector we  consider  the  Application  and  Technology  Design  plan,  from  a  geographic  perspective,  to  mitigate  and  minimise   incremental  costs  of  infrastructure.  For  this  we  will  address  each  element  of  the  plan  in  turn. Source:  National  Grid UK  Map  of  National  Gas  and  Electricity   Infrastructure
  • 3. ©  GB  Management  Services  Ltd Contact  Details:        Grant  Budge      Mobile:  +44  (0)  7780  920504 Email:    gbudge@our-­‐future.co.uk E|MISSION Statement ™ Source:  Atlas  of  UK  Marine  Energy   Resources  (2004) 1. Solar  and  wind  should  be  capped  or  required  to  privately  reinvest Due  to  the  nature  of  wind  and  solar,  there  is  little  that  can  be  done  on  a  project  basis  to  mitigate  the  influence  of   infrastructure  on  the  cost  of  supply;  optimising the  potential  for  natural  energy  being  the  primary  location  determinant.     However,  what  can  be  done,  is  to  drive  the  performance  of  such  supply.     Overloading  any  supply  chain  with  unpredictability  will  lead  to  erosion  of  system  security  and  integrity.  Where  such  issues   are  effectively  sponsored  (as  with  subsidies)  the  inevitable  response  is  to  act  to  compensate  for  these  effects,  embedding   further  cost  to  manage  the  impact,  rather  than  deal  with  the  root  cause.    This  is  EoT 101  -­‐ treat  the  root  cause  not  the   symptom.    Source  Containment  is  the  final  Technical  Design  solution  for  the  same  reason.   Renewables  must  be  a  significant  part  of  the  worlds  climate  change  strategy,  but  it  needs  to  be  value  for  money.      And  as   a  market  segment,  when  it  has  reached  25%  to  30%  of  a  national  source  of  electricity  supply;  we  would  propose  that  it   has  reached  a  point  of  maturity,  that  finding  and  funding  its  own  solution  to  market  penetration,  must  be  part  of  the   business  model.    The  UK  is  now  at  this  inflection  point. The  solution  can  be  simple.    Set  a  performance  standard  that  all  new  projects  must  adhere  to;  and  that  all  existing   operators  must  meet  within  10  years.    We  would  propose  that  such  a  generator  standard  could  be  for  assets  to  deliver  a   minimum  power  dispatch  of  75%  of  generate-­‐able  power  to  the  grid.    Such  a  standard  would  require  asset  owners  to   invest  in  energy  storage  capability  and  would  require  independent  verification  based  on  an  agreed  industry  availability   standard,  and  local  weather  data.      But  if  implemented,  could  independently  drive  the  market  merits  of  these  renewables   beyond  a  subsidised platform. 2.  Tidal  range  should  be  prioritised  over  Nuclear  for  flexible  baseload  capacity The  UK  is  acknowledged  to  be  home  to  50%  of  Europe’s  tidal  energy  potential.    The   two  figures  to  the  right  illustrate  the  coastal  areas  of  greatest  tidal  height  differential   (i.e.  tidal  range)  and  sub-­‐surface  water  flow  (i.e.  tidal  stream)  potential.  However,  for   now,  we  advocate  that  tidal  range  should  be  prioritised,  because  it  has  been   commercially  demonstrated  and  offers  comparable  scale  to  nuclear.     However,  before  addressing  our  proposal  to  prioritise tidal  range  over  nuclear   power,  a  statement  regarding  off-­‐shore  wind  is  considered  appropriate.    It  may  be   cited  that  the  environmental  impact  from  large  scale  impounding  of  the  sea  is  too   significant.    However,  current  best  in  class  off-­‐shore  wind  yields  around  4MW  per   square  kilometer, while  tidal  range  is  16MW.      As  such,  it  could  be  proposed  under  a   ‘best  available  technology’  analysis    that  wind  has  the  potential  to  create  a  higher   environmental  impact  per  MW  produced  or  tonne of  CO2 mitigated. So  to  nuclear,  why  should  the  UK  pursue  nuclear  without  appropriate  consideration   of  tidal  range.    As  foundation  to  this  remark,  we  summarise below  key  metrics  for   comparison  of  the  two  technologies.    With  capital  costs  of    generation  infrastructure   being  the  main  driver  of  wholesale  costs  of  supply;  then  surely  minimising these   must  be  central  to  low  cost  electricity  supply  in  the  future.               TIDAL  RANGE Resources TIDAL  STREAM Resources KPI  Comparison  Table Tidal  Range Nuclear Total  Installed  Capital  Cost  (£/kW) 2,800   4,500   Operating  Costs  (£/kWh) 0.01 0.04 Minimum  Design  Life  (Years) >100 60 Decommissioning  Liability No Yes Legacy  Environmental  Liabilities Limited Yes Energy  Independence Yes No Design  Complexity   Low High Source  Substitution
  • 4. Contact  Details:        Grant  Budge      Mobile:  +44  (0)  7780  920504 Email:    gbudge@our-­‐future.co.uk E|MISSION Statement ™©  GB  Management  Services  Ltd 3.  Domestic  decarbonisation  through  hydrogen  grids  should  be   embraced Here  the  infrastructure  costs  impact  production,  distribution  and   supply.    Demand  Substitution  by  hydrogen  also  requires   regulated  and  safe  domestic  CADS  products  to  be  available;  but   when  we  acknowledge  that  the  UK  use  to  be  heated   predominantly  by  town  gas  only  50  years  ago,  then  it  is   conceivable  that  a  pathway  for  such  products  could  be  enabled   by  a  policy  to  focus  on  heat  decarbonisation  through  hydrogen.     Infrastructure  costs  here  though  are  likely  to  be  significant  and   must  be  led  by  a  ‘fit  for  purpose’  assessment  of  current   installations.     Following  a  ‘fit  for  purpose’  assessment,  the  question  of  where  to   begin  arises.    Evolution  of  any  new  system  requires  careful   project  management  based  on  a  stage  gate  strategy  for   expansion.    So  to  assess  this  and  location,  we  propose  to  consider   three  factors.    First  the  profile  of  UK  carbon  emissions  sources   (see  University  College  London  map  below);  second  the  known   potential  areas  for  CO2 storage  (superimposed  below);  and  third   the  UK’s  population  density  (see  map  to  the  right).    Overlaying   these  three  criteria,  it  becomes  relatively  clear  that  a  pragmatic   and  least  cost  approach  should  be  to  focus  across  central  UK. Demand  Substitution Source:    Office  for  National  Statistics.  2011 Such  an  approach  would  also  allow  funding  to  be   targeted  towards  areas  which  have  sufficient  market   scale  for  products  as  well  as  for  common  national   infrastructure;  and  with  43%  of  gas  supplies  entering   through  terminals  in  the  Humberside  region,  central   UK  could  provide  a  cost  effective  centralised  location   to  enable  gas  grid  decarbonisation  and  CO2 storage.   4.  EV  and  Fuel  Cell  transport  should  be  embraced When  we  consider  how  to  create  markets  for  both  EV   and  fuel  cell  technology,  we  again  would  review   population  density,  but  more  importantly,  look  to   ensure  that  each  element  of  the  national  plan  is   ultimately  reinforcing  and  building  on  previous   actions.    With  this  latter  objective  central  to  our  view,   we  would  propose  that  incentives  are  offered  for   hydrogen  and  fuel  cell  technology  developers  to   establish  themselves  within  the  central  UK  region.     Beyond  this,  we  would  propose  balancing  this   geographic  bias  by  providing  comparable  incentives   and  support  to  EV  infrastructure  developers  within   major  cities  where,  population  density,  shorter   average  journeys  and  restricted  car  charging  options   (i.e.  for  flats)  would  warrant  such  support.     Establishing  the  infrastructure  for  these  technologies   in  defined  areas  will  provide  investor  confidence  to   develop  and  market  their  products.Source:    University  College  London UK  Map  of   Population  Density CO2 Store UK  Map  of  CO2 Emissions   Intensity  and  Storage Locations
  • 5. Contact  Details:        Grant  Budge      Mobile:  +44  (0)  7780  920504 Email:    gbudge@our-­‐future.co.uk E|MISSION Statement ™©  GB  Management  Services  Ltd Source  Mitigation 6.  CCS  should  be  prioritised  on  all  industrial  applications  where  biomass  is  used  as  a  feedstock If    industry  has  taken  the  steps  towards  carbon  emissions  neutrality  through  the  carbon  cycle  of  biomass;  then  it  would   seem  an  appropriate  strategy  to  augment  these  facilities  and  create  carbon  negative  products,  through  the  combined   full  or  partial  application  of  CCS.    Dependent  on  the  industrial  process,  there  may  not  be  a  benefit  from  an  immediate   step  to  100%  implementation  of  carbon  capture.    In  fact  we  advocate  that  where  biomass  has  been  deployed,  post   carbon  neutral  CCS  capacity  should  be  built  up  over  time  in  line  with  market  driven  inclusion  of  the  cost  of  carbon  into   the  product  value  chain;  thus  constraining  any  premature  consumer  burden  through  taxation.      An  illustration  of  such  a   progression  is  provided  below,  where  an  Integrated  Basic  Oxygen  Steel  Mill  (production  capacity  1.6  million  tonne  per   annum),  phases  the  utilisation  of  biomass  as  a  raw  energy  feedstock;  and  the  application  of  carbon  capture  and  storage.   It  should  further  be  noted  that  it  may  also  be  possible  to  include  CO2  utilisation  up  to  Case  3,  thus  deferring  some   infrastructure  costs  and  creating  an  additional  source  of  revenue. 5.  Biomass  should  be  prioritised  for  use  in  industrial  applications Currently  23.7  million  tonnes  oil  equivalent  of  energy  is  used  across   the  UK’s  industrial  sector.    This  demand  covers  a  variety  of  needs  as   illustrated  in  the  pie  chart  (top  right).    More  than  half  of  these  needs   could  be  supplied  through  electrification,  emissions  being  addressed   more  efficiently  upstream  in  the  energy  supply  chain;  but  process   heating  (high  and  low)  must  find  an  alternative  pathway  to  emissions   reduction. We  mentioned  in  Issue  3,  that  direct  and  indirect  process  heating  can   impact  alternatives  available.    For  indirect  heating  where  the  energy   source  and  process  flow  do  not  make  direct  contact,  substitution  can   be  relatively  straight  forward.    But  for  direct  process  heating,   consideration  must  be  given  to  potential  contaminants,  new  or   affected  by-­‐products,  changes  to  process  productivity  due  to  rate  of   heating,  and  variations  to  charge  characteristics  or  mass  flow  rates. Source:    Digest  of  UK  Energy  Statistics It  is  forecast  that  by  2050,  the  UK  will  be  able  to  supply  approximately   28  million  tonnes  per  annum  of  biomass;  which  at  an  average   15GJ/tonne  could  provide  420million  Giga  Joules  of  energy.    The   industrial  sector  as  a  whole  consumes  990million  Giga  Joules  of  energy   per  annum,  48%  of  which  (476  million  Giga  Joules)  is  process  heat   related  (chart  top  right).    The  fuel  used  for  process  energy  is  unclear,   but  will  predominantly  come  from  solid,  liquid  or  gaseous  fuels  (see   chart  middle  right  for  profile  of  raw  energy  use  in  the  industrial  sector). Other  than  closure  of  assets  or  an  unparalleled  advance  in  production   technology,  few  solutions  other  than  biomass  can  support  industrial   emissions  reductions.  Considering  biomass  supply  constraints,  it  would   make  sense  to  direct  product  to  these  applications;  commencing  with   solid  fuel  switching,  ahead  of  liquid  or  gas  switching.  It  should  also  be   remembered  that  gas  switching  may  also  be  supported  by  action  3. Source  Containment Coal Petroleum Natural,Gas Electricity Bio4Energy Source:    Digest  of  UK  Energy  Statistics Scenario  Profile  Table Base  Case Case  1 Case  2 Case  3 Case  4 CO2 Produced  (tpa) 4,145,600   4,992,400   4,992,400   5,251,300   5,251,300   %  Biomass  Substitution -­‐ 23% 23% 50% 50% %  CCS  Installed -­‐ 0% 23% 23% 50% CO2  Avoided  (tpa) -­‐ 654,700   1,553,200   2,147,550   4,094,343   %  CO2 Avoided -­‐ 16% 37% 52% 99% Lighting Refrigeration Compressed2 Air Motors Space2 Heating Drying2/2 Separation Other High2 Temperature2 Prcoess Low2 Temperature2 Process Industrial  Energy  Use Industrial  Energy  Source
  • 6. Contact  Details:        Grant  Budge      Mobile:  +44  (0)  7780  920504 Email:    gbudge@our-­‐future.co.uk E|MISSION Statement ™©  GB  Management  Services  Ltd Timetable Source  Containment  (Continued) No  matter  what  the  architecture  of  electricity  supply,  there  will   continue  to  be  a  need  for  flexible  and  rapid  response   generation.    From  a  total  installed  capital  cost,  fixed  operating   cost  and  unabated  emissions  performance  perspective,   Combined  Cycle  Gas  Turbine  (“CCGT”)  is  still  the  industry   benchmark  for  such  generation.    It  would  be  expected  that   with  a  forecast  2050  peak  electricity  demand  (including  10%   installed  capacity  margin)  of  between  110GW  and  140GW,  that   at  least  15%  of  this  should  be  flexible  rapid  response  CCGT   generation  (i.e.  up  to  16.5GW  to  21GW).      However,  despite  its   emissions  performance,  this  capacity  should  not  be  unabated   and  must  be  enabled  at  the  right  time  with  CCS.    As  such,  and   in  acceptance  of  the  preceding  actions,  it  is  proposed  that  this   infrastructure  is  developed  within  the  central  eastern  corridor   of  the  UK  – namely  Humberside/Yorkshire.     One  critical  factor  that  hasn’t  been  presented  and  that  materially  influences  this  proposed  plan,  is  time. It  takes  time   to   develop  new  infrastructure.    Concept  clearance  to  execution  of  hydrogen  gas  mains  enablement  takes  time.    Without   policy  and  strategy  to  support  its  creation,  investors  in  PAPS  and  CADS  can  not  justify  the  development  costs. It  takes  time  to  develop  source  projects,  industrial  or  generation  (PAPS).    On  average  it  would  be  reasonable  to  say  this   period  from  idea  to  commercial  operation  would  be  a  minimum  5  years  up  to  a  maximum  of  8  years.    Such  decision   require  long  term  market  certainty,  supported  by  guarantees  that  the  biomass  supply  chain  and/or  hydrogen  grid   and/or  CO2 transport  and  storage  capacity  will  be  available. The  objective  from  the  plan  proposed  here,  is  that  by  establishing  a  geographic  framework  alongside  a  decarbonisation   strategy,  a  national  plan  can  be  accelerated.   But  it  will  require  all  stakeholders  to  be  altruistic  and  see  that  a  race  to  be   first  is  futile,  unless  you  know  where  the  finish  line  is.         Generating   Infrastructure Capacity   (GW) Infrastructure Status Drax 3.9 Potential  CCGT Eggborough 2 Potential  CCGT Ferrybridge 2 Potential  CCGT Keadby 0.7 Existing  CCGT Saltend 1.2 Existing  CCGT Immingham 1.18 Existing  CCGT Thorpe  Marsh 1.5 Consented  CCGT Hatfield 0.9 Consented  CCGT Knottingley 1.5 Consented  CCGT TOTAL 14.88 7.  Balance  of  installed  power  capacity  should  be  CCGT  with  CCS: The  table  above  illustrates  the  existing  CCGT  capacity,  the  consented  CCGT  capacity  and  the  extended  generation   capacity  (i.e.  coal)  that  can  be  repurposed  within  a  1,000  square  kilometer  area  of  Humberside.        With  the  actions   detailed  under  items  3,  4  and  6  being  targeted  within  the  central  UK  region,  this    CCS  capacity  should  have  relatively   low  transport  and  storage  costs,  ensuring  such  flexible  capacity  is  best  value  for  the  consumer.    We  illustrate  below   how  this  would  work  in  practice  as  emissions  reductions  progress  through  the  sequential  actions  proposed.   0% 10% 20% 30% 40% 50% 60% 70% 80% 90% 100% 25% 50% 75% 100% Relative(Costs(per(Tonne(Stored Shared((Transport(and(Storage)(Infrastructure(Capacity(Utilisation,(% Relative(Cost(per(tonne(Vs(Shared(Infrastructure(Capacity(Utilisation 30(£/t 24(£/t 18(£/t 13.5(£/t Effective(shared(cost(of(transport(and(storage(in(£/t Action  3  &  4 Decarbonise Heat  (Hydrogen  Grid)   Action  6 Industrial  CCS Action  7 Power  CCS
  • 7. Contact  Details:        Grant  Budge      Mobile:  +44  (0)  7780  920504 Email:    gbudge@our-­‐future.co.uk E|MISSION Statement ™©  GB  Management  Services  Ltd A  Consolidated  Infrastructure  Strategy Through-­‐out  Issue  5  there  have  been  three  interlinked  Engineering  of  Things  basic  philosophies  that  have  filtered   through  every  element  of  the  infrastructure  design  and  progression  considered.    They  are: Centralisation:    Centralised  solutions  are:  easier  to  implement  through  clear  strategy,  standardised  policy  and   practice:  ensures  continuity  of  approach  across  the  system:  are  easier  to  coordinate,  especially  around  budgets:  and   allow  for  quicker  decision  making.  During  the  early  stages  of  multiple  interlinked  industry  evolution,  this  is  the  most   appropriate  design  management  structure.           Economies  of  Scale:  Scale  brings  unit  cost  reductions.    Through  setting  out  a  geographic  strategy,  economies  of  scale   can  be  accelerated  across  several  actions.    These  economies  become  reinforcing,  reducing  the  state  sponsored  risk   capital  required  to  reach  a  competitive  market  place.     Shared  Infrastructure:  This  is  a  consolidation  of  the  above  two,  but  warrants  separate  identification. With  these  three  underlying  principals  we  can  set  a  foundation  for  a  geographically  targeted  enabling  action  plan,   supported  by  an  overlapping  deployment  strategy  that  can  deliver  lowest  cost  emissions  reduction  for  the  UK’s   obligations,  from  the  end  of  the  3rd carbon  budget  up  to  2050.     Electricity Heat Transport Industrial Action  6  and  7 Focused  Enabling  CCS  Infrastructure   for  Industry  and  Power Action  2 Targeted  Tidal   Range  Capacity Action  3  &  4 Targeted  Electrification  &   Enabling  EV  Infrastructure Action  3  &  4 Focused  Enabling   Hydrogen  and  Fuel  Cell   Infrastructure   Action  5 Targeted  Industrial   Biomass  Deployment New  Wind  &  Solar   With  Energy  Storage Drives  Need  For   Predictable  Tidal   Range  Power New  Capacity   Enables  Heat   Electrification Enable  Regional   Hydrogen  Grid   Baseload  Volume   Demand  for  CCS   New  Capacity   Enables  EV Deployment Hydrogen  Grid   Enables  Fuel  Cell   Deployment Biomass  Deployment   on  Industrial   Processes  Reduces   Emissions Allows  2nd Stage   Expansion  of  CCS  and   Integrated  CCU Provides  Low  Cost   Platform  for  Flexible   Power  and  3rd Stage   CCS  Expansion 3 4 5 6 7 1 2 3 4 GEOGRAPHIC  INFRASTRUCTURE   ENABLING REINFORCING  INFRASTRUCTURE DEVELOPMENT  PLAN