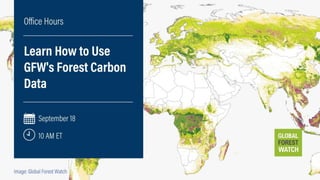
GFW Carbon Data Office Hours_September 18 2023

Global Forest Watch
Global Forest WatchGlobal Forest Watch
GFW Carbon Data Office Hours_September 18 2023
Presenters
David Gibbs
Research Associate
Global Forest Watch
Isabela Barriga
Engagement Specialist​
Global Forest Watch
Moderator
Mel Rose
GIS Research Analyst
Global Forest Watch
Office Hours Instructions
• Enter questions or comments through the “Q&A” button. We will
have a Q&A at the end of the presentation
• To ask a question live, please raise your hand
AGENDA
• Intro to Office Hours
• Overview of GFW Carbon Data
• Questions from the Audience
• Wrap Up
GLOBAL FOREST WATCH
GFW offers a suite of forest
monitoring tools designed to:
• Increase knowledge and
transparency about forest
landscapes
• Harness information to
mobilize local action by
governments and civil society
• Advance private sector action
to stop commodity-driven
deforestation and manage
forests sustainably
GOALS OF
OFFICE HOURS:
• Community engagement
• Workshop questions or
problems
• Share lessons learned and
best practices
Poll!
Photo: World Resources Institute
WE BROADLY UNDERSTAND WHERE FORESTS
STORE CARBON
ESA CCI (2017)
GEDI griddedAGB (around 2020) Harris et al. 2021 (2000)
Saatchi et al. 2011 (early 2000s)
How much? 
Where? 
Why? 
FOREST CARBON FLUXES ARE MORE COMPLICATED
Note: Removals refers to carbon captured (sequestered) by forests.
SIMPLE ESTIMATE OF TROPICAL FOREST EMISSIONS
Emissions (t CO2) = Tree Cover Loss (ha) x Pre-disturbance Carbon Density (tonnes/ha)
CO2 emissions “Activity Data” “Emission Factor”
Zarin et al. 2016,
as formerly shown on GFW
Removals (t CO2) = Tree Cover Extent/Gain (ha) x Annual Sequestration Rate (tonnes/ha/yr)
CO2 removals “Activity Data” “RemovalFactor”
Harris et al. 2021
Create globally consistent 30-m maps of forest-
related greenhouse gas gross emissions, gross
removals, and net flux by combining spatial data on
forests with IPCC national GHG inventory methods
THE GOAL
FLEXIBLY MAPPING EMISSIONS AND REMOVALS
MODIS Burned Areas
Peatlands Plantations Intact Forests
Tree Biomass/Carbon Soil Carbon Young Forest Regrowth C Rates
and IPCC Default Rates
Tree Cover, Loss and Gain
And many more…
Harris et al. 2021; https://www.wri.org/insights/forests-absorb-twice-much-carbon-they-emit-each-year
Drivers of Forest Loss
WHAT CAN YOU DO WITH THESE MAPS?
Yes No
Estimate historical emissions, removals,
and net flux from forests in areas of
interest
Estimate carbon fluxes for all land uses
Estimate emissions and removals due to
all causes (human and natural)
Attribute emissions and removals to
human or natural activities at fine scale
Make globally standardized flux estimates
based on remote sensing data
Generate carbon credits/offsets(project,
REDD+, etc.)
Compare with national greenhouse gas
inventories and other forest flux estimates
Expect that these will be the same as
other forest flux estimates
Identify places with substantial emissions
and removals to prioritize for intervention
Make detailed decisions about specific
places and land uses without additional
local information
Note: Not an exhaustive list
MAPPING POTENTIAL CARBON SEQUESTRATION
FOR NATURALLY REGENERATING FORESTS <30 YEARS
Cook-Patton et al. 2020
RECENT UPDATES
Changed with 2022 tree cover loss release:
1. Locally variable root-to-shoot ratios to calculate belowground
biomass, used to calculate both emissions and sequestration
2. Tree cover gain extended from 2000-2012 to 2000-2020
3. Higher resolution identificationof tree cover loss due to fires
4. Updated peat extent maps
5. Updated Global Warming Potential (GWP) values
Described in https://www.globalforestwatch.org/blog/data-and-
research/whats-new-carbon-flux-monitoring/
UPCOMING UPDATES RELATED
Two updates related to carbon sequestration rates:
1. IPCC Tier 1 Temperate Removal Factors and standard
deviations
2. Spatial Database of Planted Trees 2.0
– 45 additional countries
– 1319 additional planted forest classes
OVERVIEW OF GFW CARBON DATA
• GFW Map
• Dashboard
• National Data Spreadsheets
• Open Data Portal
• API
GFW MAP
www.globalforestwatch.org
GFW Carbon Data Office Hours_September 18 2023
https://www.globalforestwatch.org/help/developers/
COMMONLY ASKED QUESTIONS
• Why are the emissions an annual timeseries but the removals and net
flux an average over the entire model?
• Is emissions from degradation included in the model?
• How are the carbon sequestration rates determined?
• Can these maps be used for carbon offsets?
• How do the fluxes from these maps compare to national greenhouse
gas inventories?
• I’ve heard that the GLAD lab is going to release some different tree
cover data next year. How is that going to change this flux model?
• How can I get total emissions or removals in my protected area?
Thank you! Questions?
David Gibbs
Research Associate
Global Forest Watch
Isabela Barriga
Engagement Specialist​
Global Forest Watch
Moderator
Mel Rose
GIS Research Analyst
Global Forest Watch
REACH OUT TO OUR TEAM AT GFW@WRI.ORG
1 of 33

Recommended

Gfw presentation for wb master class 27march15 by
Gfw presentation for wb master class 27march15Gfw presentation for wb master class 27march15
Gfw presentation for wb master class 27march15Nancy Harris
254 views56 slides
Recommendations to better align FREL with the TACCC principles by
Recommendations to better align FREL with the TACCC principlesRecommendations to better align FREL with the TACCC principles
Recommendations to better align FREL with the TACCC principlesCIFOR-ICRAF
412 views15 slides
CIFOR-ICRAF Trees, forests and landscapes for people and the planet by
CIFOR-ICRAF Trees, forests and landscapes for people and the planetCIFOR-ICRAF Trees, forests and landscapes for people and the planet
CIFOR-ICRAF Trees, forests and landscapes for people and the planetCIFOR-ICRAF
113 views16 slides
Differences in land CO2 fluxes between global models and country GHG inventor... by
Differences in land CO2 fluxes between global models and country GHG inventor...Differences in land CO2 fluxes between global models and country GHG inventor...
Differences in land CO2 fluxes between global models and country GHG inventor...ipcc-media
668 views19 slides
Different approaches to estimating land GHG emissions: a crash course overview by
Different approaches to estimating land GHG emissions: a crash course overviewDifferent approaches to estimating land GHG emissions: a crash course overview
Different approaches to estimating land GHG emissions: a crash course overviewipcc-media
206 views16 slides
Capacity Building on the IPCC 2013 Wetlands Supplement, FREL Diagnostic and U... by
Capacity Building on the IPCC 2013 Wetlands Supplement, FREL Diagnostic and U...Capacity Building on the IPCC 2013 Wetlands Supplement, FREL Diagnostic and U...
Capacity Building on the IPCC 2013 Wetlands Supplement, FREL Diagnostic and U...CIFOR-ICRAF
583 views10 slides

More Related Content

Similar to GFW Carbon Data Office Hours_September 18 2023

Climate Action Planning - Waste by
Climate Action Planning - WasteClimate Action Planning - Waste
Climate Action Planning - WasteBruce Peninsula Biosphere Association
103 views10 slides
D3_IPCC_emissions.ppt by
D3_IPCC_emissions.pptD3_IPCC_emissions.ppt
D3_IPCC_emissions.pptPraDeep11414
6 views21 slides
Terrestrial habitats and carbon web by
Terrestrial habitats and carbon webTerrestrial habitats and carbon web
Terrestrial habitats and carbon webSussex Wildlife Trust
81 views32 slides
The political economy of REDD+ in the DRC by
The political economy of REDD+ in the DRCThe political economy of REDD+ in the DRC
The political economy of REDD+ in the DRCCIFOR-ICRAF
39 views21 slides
DRC forest reference emission level methodological framework by
DRC forest reference emission level methodological frameworkDRC forest reference emission level methodological framework
DRC forest reference emission level methodological frameworkCIFOR-ICRAF
596 views15 slides
Land sector briner(oecd) accounting-ccxg gf sep2014 by
Land sector briner(oecd) accounting-ccxg gf sep2014Land sector briner(oecd) accounting-ccxg gf sep2014
Land sector briner(oecd) accounting-ccxg gf sep2014OECD Environment
412 views13 slides

Similar to GFW Carbon Data Office Hours_September 18 2023(20)

The political economy of REDD+ in the DRC by CIFOR-ICRAF
The political economy of REDD+ in the DRCThe political economy of REDD+ in the DRC
The political economy of REDD+ in the DRC
CIFOR-ICRAF39 views
DRC forest reference emission level methodological framework by CIFOR-ICRAF
DRC forest reference emission level methodological frameworkDRC forest reference emission level methodological framework
DRC forest reference emission level methodological framework
CIFOR-ICRAF596 views
Land sector briner(oecd) accounting-ccxg gf sep2014 by OECD Environment
Land sector briner(oecd) accounting-ccxg gf sep2014Land sector briner(oecd) accounting-ccxg gf sep2014
Land sector briner(oecd) accounting-ccxg gf sep2014
OECD Environment412 views
Nick Willenbrock - Future DoW CoP by IES / IAQM
Nick Willenbrock - Future DoW CoPNick Willenbrock - Future DoW CoP
Nick Willenbrock - Future DoW CoP
IES / IAQM212 views
Zambia’s forest reference emission level for the unfccc by CIFOR-ICRAF
Zambia’s forest reference emission level for the unfcccZambia’s forest reference emission level for the unfccc
Zambia’s forest reference emission level for the unfccc
CIFOR-ICRAF1.2K views
Deforestation diagnostics by CIFOR-ICRAF
Deforestation diagnosticsDeforestation diagnostics
Deforestation diagnostics
CIFOR-ICRAF36 views
Introduction to redd+ 17 april 2017 A Presentation By Mr. Allah dad Khan Vis... by Mr.Allah Dad Khan
Introduction to redd+ 17 april 2017 A Presentation ByMr. Allah  dad KhanVis...Introduction to redd+ 17 april 2017 A Presentation ByMr. Allah  dad KhanVis...
Introduction to redd+ 17 april 2017 A Presentation By Mr. Allah dad Khan Vis...
Mr.Allah Dad Khan197 views
Restoration of degraded peatlands: connecting science with policy and practice by CIFOR-ICRAF
Restoration of degraded peatlands: connecting science with policy and practiceRestoration of degraded peatlands: connecting science with policy and practice
Restoration of degraded peatlands: connecting science with policy and practice
CIFOR-ICRAF193 views
Research on REDD+ MRV and carbon stocks/emissions measurement by CIFOR-ICRAF
Research on REDD+ MRV and carbon stocks/emissions measurementResearch on REDD+ MRV and carbon stocks/emissions measurement
Research on REDD+ MRV and carbon stocks/emissions measurement
CIFOR-ICRAF686 views
Description of TACCC principles by CIFOR-ICRAF
Description of TACCC principlesDescription of TACCC principles
Description of TACCC principles
CIFOR-ICRAF890 views
EcoTas13 BradEvans e-MAST framework by TERN Australia
EcoTas13 BradEvans e-MAST frameworkEcoTas13 BradEvans e-MAST framework
EcoTas13 BradEvans e-MAST framework
TERN Australia606 views

Recently uploaded

Exceeding-returning-Intro-v1Dec-final.pptx by
Exceeding-returning-Intro-v1Dec-final.pptxExceeding-returning-Intro-v1Dec-final.pptx
Exceeding-returning-Intro-v1Dec-final.pptxipcc-media
56 views29 slides
Physical Science Challenges for AR7 by
Physical Science Challenges for AR7Physical Science Challenges for AR7
Physical Science Challenges for AR7ipcc-media
206 views55 slides
ORAL_PRESENTATION.pdf by
ORAL_PRESENTATION.pdfORAL_PRESENTATION.pdf
ORAL_PRESENTATION.pdfahmadalfalasim
33 views5 slides
Sustainable IT by
Sustainable ITSustainable IT
Sustainable ITDr. Salem Baidas
5 views20 slides
Activity 9 Sustainability System.pptx by
Activity 9 Sustainability System.pptxActivity 9 Sustainability System.pptx
Activity 9 Sustainability System.pptxAkarshSingh57
8 views24 slides
feel the nature by
feel the naturefeel the nature
feel the naturemrudusahithi
5 views1 slide

Recently uploaded(20)

Exceeding-returning-Intro-v1Dec-final.pptx by ipcc-media
Exceeding-returning-Intro-v1Dec-final.pptxExceeding-returning-Intro-v1Dec-final.pptx
Exceeding-returning-Intro-v1Dec-final.pptx
ipcc-media56 views
Physical Science Challenges for AR7 by ipcc-media
Physical Science Challenges for AR7Physical Science Challenges for AR7
Physical Science Challenges for AR7
ipcc-media206 views
Activity 9 Sustainability System.pptx by AkarshSingh57
Activity 9 Sustainability System.pptxActivity 9 Sustainability System.pptx
Activity 9 Sustainability System.pptx
AkarshSingh578 views
Citizen science of the Great Barrier Reef and Coral Sea Expedition by Dr Adam Smith
Citizen science of the Great Barrier Reef and Coral Sea ExpeditionCitizen science of the Great Barrier Reef and Coral Sea Expedition
Citizen science of the Great Barrier Reef and Coral Sea Expedition
Dr Adam Smith46 views
Low-emission food system perspectives in Viet Nam by CIFOR-ICRAF
Low-emission food system perspectives in Viet NamLow-emission food system perspectives in Viet Nam
Low-emission food system perspectives in Viet Nam
CIFOR-ICRAF7 views
Business X Design - Digital for People, Product, and Planet - an Intersection... by Matt Gibson
Business X Design - Digital for People, Product, and Planet - an Intersection...Business X Design - Digital for People, Product, and Planet - an Intersection...
Business X Design - Digital for People, Product, and Planet - an Intersection...
Matt Gibson40 views
Where is global warming in relation to the long-term temperature goal? by ipcc-media
Where is global warming in relation to the long-term temperature goal?Where is global warming in relation to the long-term temperature goal?
Where is global warming in relation to the long-term temperature goal?
ipcc-media26 views
climate and the world by Basel Ahmed
climate and the worldclimate and the world
climate and the world
Basel Ahmed35 views

GFW Carbon Data Office Hours_September 18 2023

  • 2. Presenters David Gibbs Research Associate Global Forest Watch Isabela Barriga Engagement Specialist​ Global Forest Watch Moderator Mel Rose GIS Research Analyst Global Forest Watch
  • 3. Office Hours Instructions • Enter questions or comments through the “Q&A” button. We will have a Q&A at the end of the presentation • To ask a question live, please raise your hand
  • 4. AGENDA • Intro to Office Hours • Overview of GFW Carbon Data • Questions from the Audience • Wrap Up
  • 5. GLOBAL FOREST WATCH GFW offers a suite of forest monitoring tools designed to: • Increase knowledge and transparency about forest landscapes • Harness information to mobilize local action by governments and civil society • Advance private sector action to stop commodity-driven deforestation and manage forests sustainably
  • 6. GOALS OF OFFICE HOURS: • Community engagement • Workshop questions or problems • Share lessons learned and best practices
  • 8. WE BROADLY UNDERSTAND WHERE FORESTS STORE CARBON ESA CCI (2017) GEDI griddedAGB (around 2020) Harris et al. 2021 (2000) Saatchi et al. 2011 (early 2000s)
  • 9. How much?  Where?  Why?  FOREST CARBON FLUXES ARE MORE COMPLICATED Note: Removals refers to carbon captured (sequestered) by forests.
  • 10. SIMPLE ESTIMATE OF TROPICAL FOREST EMISSIONS Emissions (t CO2) = Tree Cover Loss (ha) x Pre-disturbance Carbon Density (tonnes/ha) CO2 emissions “Activity Data” “Emission Factor” Zarin et al. 2016, as formerly shown on GFW Removals (t CO2) = Tree Cover Extent/Gain (ha) x Annual Sequestration Rate (tonnes/ha/yr) CO2 removals “Activity Data” “RemovalFactor”
  • 11. Harris et al. 2021 Create globally consistent 30-m maps of forest- related greenhouse gas gross emissions, gross removals, and net flux by combining spatial data on forests with IPCC national GHG inventory methods THE GOAL
  • 12. FLEXIBLY MAPPING EMISSIONS AND REMOVALS MODIS Burned Areas Peatlands Plantations Intact Forests Tree Biomass/Carbon Soil Carbon Young Forest Regrowth C Rates and IPCC Default Rates Tree Cover, Loss and Gain And many more… Harris et al. 2021; https://www.wri.org/insights/forests-absorb-twice-much-carbon-they-emit-each-year Drivers of Forest Loss
  • 13. WHAT CAN YOU DO WITH THESE MAPS? Yes No Estimate historical emissions, removals, and net flux from forests in areas of interest Estimate carbon fluxes for all land uses Estimate emissions and removals due to all causes (human and natural) Attribute emissions and removals to human or natural activities at fine scale Make globally standardized flux estimates based on remote sensing data Generate carbon credits/offsets(project, REDD+, etc.) Compare with national greenhouse gas inventories and other forest flux estimates Expect that these will be the same as other forest flux estimates Identify places with substantial emissions and removals to prioritize for intervention Make detailed decisions about specific places and land uses without additional local information Note: Not an exhaustive list
  • 14. MAPPING POTENTIAL CARBON SEQUESTRATION FOR NATURALLY REGENERATING FORESTS <30 YEARS Cook-Patton et al. 2020
  • 15. RECENT UPDATES Changed with 2022 tree cover loss release: 1. Locally variable root-to-shoot ratios to calculate belowground biomass, used to calculate both emissions and sequestration 2. Tree cover gain extended from 2000-2012 to 2000-2020 3. Higher resolution identificationof tree cover loss due to fires 4. Updated peat extent maps 5. Updated Global Warming Potential (GWP) values Described in https://www.globalforestwatch.org/blog/data-and- research/whats-new-carbon-flux-monitoring/
  • 16. UPCOMING UPDATES RELATED Two updates related to carbon sequestration rates: 1. IPCC Tier 1 Temperate Removal Factors and standard deviations 2. Spatial Database of Planted Trees 2.0 – 45 additional countries – 1319 additional planted forest classes
  • 17. OVERVIEW OF GFW CARBON DATA • GFW Map • Dashboard • National Data Spreadsheets • Open Data Portal • API
  • 32. COMMONLY ASKED QUESTIONS • Why are the emissions an annual timeseries but the removals and net flux an average over the entire model? • Is emissions from degradation included in the model? • How are the carbon sequestration rates determined? • Can these maps be used for carbon offsets? • How do the fluxes from these maps compare to national greenhouse gas inventories? • I’ve heard that the GLAD lab is going to release some different tree cover data next year. How is that going to change this flux model? • How can I get total emissions or removals in my protected area?
  • 33. Thank you! Questions? David Gibbs Research Associate Global Forest Watch Isabela Barriga Engagement Specialist​ Global Forest Watch Moderator Mel Rose GIS Research Analyst Global Forest Watch REACH OUT TO OUR TEAM AT GFW@WRI.ORG