1. SPE 10022
SPE
Society of Petroleum Engineers
The Role of Numerical Simulation in Reservoir
Management of a West Texas Carbonate Reservoir
by Kenneth J. Harpole, *t and Charles L. Hearn,* Cities Service Company
"Member SPE-AIME
tNow associated with Keplinger & Associates, Inc., Tulsa.
';;opyright 1982, Society of Petroleum Engineers
This paper was presented at the International Petroleum Exhibition and Technical Symposi~m.of the Soci~ty of p~troleum Engineers held in
Bejing, China, 18·26 March, 1982. The material is subject to correction by the author. Permission to copy IS restricted to an abstract of not
more than 300 words. Write SPE, 6200 North Central Expressway, Dallas, Texas, 75206 USA. Telex 730989
INTRODUCTION
An effective reservoir management program
is designed to optimize reservoir performance by
assuring maximum economic return and recovery
over the life of the reservoir. Such a program
requires a continuing process of engineering and
geologic study. Numerical reservoir simulation
models provide a powerful tool for analyzing the
production history of a reservoir and for
predicting future performance under a variety of
possible operating methods. Experience has
shown that an accurate reservoir description is
essential to the success of any numerical
simulation study and to the development of an
effective reservoir management plan 1 ,2.
The mechanics of conducting a numerical
simulation of reservoir performance are essentially
the same for either a carbonate or sandstone
reservoir. The most important difference in
modeling these two general reservoir types
involves the conceptual approach required to
describe the lateral and vertical continuity of flow
units within the reservoir. The continuity and
internal characteristics of sandstones are
controlled primarily by the original depositional
system and environment, with usually only minor
post-depositional changes. In carbonates, the
distribution of porosity and permeability and the
continuity of reservoir-quality units can be
determined either by the original depositional
environment, by post-depositional diagenetic
changes, or, most commonly, by a combination of
these factors.
Carbonate reservoir rock types are formed in
a variety of depositional settings and show great
diversity in size and form, ranging from reefs
covering one or two square kilometers to
extensive carbonate banks covering thousands of
square kilometers3 . The common characteristic of
carbonate reservoirs is the extreme heterogeneity
of porosity types and permeability distribution
References and illustrations at end of paper.
759
which results from the complex interaction of
the physical, biological, and chemical processes
that form these rocks. In addition, carbonate
rocks are particularly susceptible to
post-depositional diagenetic changes. Some of
the more important diagenetic processes which
act to alter the original rock texture in
carbonates are dolomitization, recrystallization,
cementation, and leaching or solution.
A reservoir study 4 conducted by Cities
Service Company on a large carbonate reservoir
in West Texas provides an excellent example of
the approach and the type of data needed to
support a numerical simulation study for
improved reservoir management. The West
Seminole field (Fig. 1) produces from the San
Andres Formation at an average depth of
approximately 5,100 ft (1550 m). Fig. 2A
shows the general structural configuration of
the reservoir, which consists of a large main
dome with a smaller dome structure to the east.
A large primary gas cap, shown schematically in
Fig. 28, covers most of the field area. A
summary of basic reservoir and fluid data is
presented in Table 1.
The field was discovered in 1948. During
the late 1960's and early 1970's, efforts were
made to reduce the pressure decline in the
reservoir by re-injection of produced gas into
the gas cap and by peripheral water injection.
Neither of these was entirely successful in
effecting pressure maintenance. In the
mid-1970's, the decision was made to develop a
40-acre (16.2-ha) five-spot pattern waterflood
in the main dome area of the field (Fig. 3).
Twenty-eight infill water injection wells were
drilled during 1973-1975.
Throughout the field's producing life,
there had been a question about the extent of
vertical communication within the reservoir,
particularly between the oil zone and the
overlying gas cap. This question became a
critical operating consideration when the pattern
2. 2
THE ROLE OF NUMERICAL SIMULATION IN RESERVOIR MANAGEMENT
OF A WEST TEXAS CARBONATE RESERVOIR SPE 10022
waterflood was proposed. Significant
communication between porosity zones in the oil
leg and those in the gas cap could have a
drastic effect on waterflood performance
through loss of oi I to the gas cap, as
illustrated schematically in Fig. 4. To answer
this question, Cities Service began to obtain
the data necessary to support an extensive
reservoir study. The overall objective was to
develop the most profitable and effective
reservoir management program for the West
Seminole field. The following specific
objectives and procedures were developed for
the work:
1) Use all available geologic and
engineering data to develop a
detailed and accurate reservoir
description for this field.
2) Incorporate the reservoir description
information into a black oil computer
simulation model. Use the simulator
to verify and further refine the
reservoir description by history
matching the pressure and
production data.
3)
4)
Use the history-matched simulation
model to project future reservoir
performance under current
waterflood operations.
Evaluate various alternative
operating plans and recommend the
most effective reservoir management
program for the field.
RESERVOIR DESCRIPTION
The San Andres is a prolific producing
formation found throughout much of west
Texas. The typical San Andres reservoir rock
is a heterogeneous carbonate characterized by
extreme vertical and lateral variation in
porosity and permeability development.
Previous work by Ghauri, et al s and George
and Stiles6 illustrates the efforts made recently
to better characterize these complex reservoirs
and to develop improved techniques to evaluate
and predict their waterflood performance.
Geologic Study
Core data provided the most valuable
source of information for developing a geologic
description of the field. All of the 28 infill
wells drilled between 1973 and 1975 were cored
through most of the reservoir section. After
routine core analysis, 24 of these cores were
slabbed and polished. This provided over
6,000 feet (1830 m) of core for geologic study.
An extensive geologic evaluation of the West
Seminole reservoir7 was conducted using the
cores and logs from these 24 wells. This work
provided a detailed description of the internal
anatomy of the reservoir as well as a
description of its depositional and diagenetic
history.
760
The producing section in the upper San
Andres in West Seminole is contained within
some 600 feet (180 m) of carbonate section
deposited during an overall regression of the
Permian sea at the eastern margin of the
Central Basin Platform. This basin margin was
probably a carbonate ramp with depositional
patterns similar to those of the Trucial Coast in
the Persian Gulf7. Sediments were most Ii kely
deposited on this shelf ramp in a series of
facies belts, roughly following bathymetric
contours.
The retreat of the sea was very erratic,
with the result that the facies belts migrated up
and down this ramp as sea level fluctuated.
This resulted in deposition of a complex
interlayering of different carbonate facies. Two
of the larger of these minor transgressions
produced field-wide unconformities within the
reservoi r section. These unconformities divide
the reservoir section into three distinct
transgressive-regressive depositional cycles.
Each cycle shows a progression upward from a
basal, relatively deep water, low energy
subtidal facies into a shallower, higher energy
shoaling environment.
The cyclic nature of the deposition caused
by the erratic sea level fluctuations produced a
layered structure in the rocks. This situation
was modified somewhat by post-depositional
diagenetic changes. These changes were both
constructive, that is, acting to improve
reservoir porosity and permeability (the most
important processes here were dolomitization and
leaching), and destructive, that is, acting to
destroy porosity and permeability (the most
important of these was deposition of anhydrite).
The interpretation of the resulting porosity
and permeability distribution was made easier
because the types and intensities of diagenetic
changes seemed to be closely related to the
original depositional facies. This is not the
case in all carbonate reservoirs. Of particular
importance to reservoi r performance was the
fact that the deep, quite water fusulinid
wackestone facies seemed to be particularly
subject to anhydritization 7. As a result,
several thin zones extending across the field
were extensively cemented with anhydrite.
These zones formed potential barriers to
vertical movement of fluids within the reservoir
section.
It was essential to obtain a detailed and
accurate correlation of stratigraphic units prior
to identifying their porosity and permeability
characteristics. This prevented the
cross-correlation of different geologic units
which happened to show similar permeability
and/or porosity characteristics on logs or in
cores. This was particularly important when
correlating a specific impermeable zone from well
to well across the field.
Based on the geologic
reservoir section was divided
evaluation, the
into six major
3. SPE 10022 K. J. HARPOLE AND C. L. HEARN
zones, or layers as illustrated in Fig. 5. The
boundaries between layers corresponded to
prominent low porosity, low permeability zones
which had been extensively cemented with
anhydrite. Thus, the geologic study provided
the framework for the reservoir description and
was the primary basis for the layering scheme
used in the simulation model grid system.
Porosity and Permeability Distribution
Conventional, whole-core analyses were
available for over 7,500 feet (2290 m) of core
from 44 different wells in the West Seminole field.
All of the core analyses were digitized for
computer analysis. This allowed extensive use of
the computer in statistical analysis, plotting, and
mapping of the core data. The core data were
used to construct contour maps showing the areal
distribution of porosity and permeability within
each of the six geologically-defined layers.
Structure contour and isopach maps were also
generated for each layer.
By combining the core data and the geologic
reservoi r description, the th ree-dimensional
distribution of porosity and permeability in the
reservoir could be described in detail. Fig. 6
illustrates the permeability distribution for an
east-west cross-section through the northern
portion of the field. The cross-section shows the
extreme lateral and vertical variations in reservoi r
quality characteristic of the San Andres.
No consistent relationship between porosity
and permeability development was observed in the
core data. Core samples with fairly low porosity
often showed excellent permeability, and vice
versa. It is fairly common to find such a lack of
correlation between porosity and permeability in
carbonate reservoirs. This is often the result of
selective leaching of fossil fragments or solution
of material creating moldic or vuggy porosity that
is not interconnected to form a continuous flow
system. The correlation of porosity with
permeability was much better within individual
reservoir zones identified in the geologic study.
The West Seminole reservoir does exhibit a
distinctly layered structure. Lateral pay
continuity within the primary waterflood zone was
observed to be much better than is normally seen
in the San Andres. Fig. 7 shows the
permeability stratification and correlation of seven
sub-zones within one of the six major layers.
Fig. 7 also illustrates the general trend of an
overall thickening of the entire reservoir section
to the south (paleo-seaward direction)
accompanied by a general decrease in porosity
and permeability throughout the section.
Pressure Transient Work
Extensive pressure transient testing was
conducted in the reservoir. A major program
consisting of long-term buildup tests and
interference tests was conducted between Nov.
1975 and July 19764 • This program involved 11
separate well pairs, in three groups, distributed
across the field. The tests were conducted using
761
sensitive
pressure
equipment.
Hewlett-Packard quartz
gauges and surface
crystal
recording
The primary purposes of this program
were (1) to identify any matrix directional
permeability, fracture systems, or channeling
which may be controlling fluid movement in the
reservoir, (2) to help assess the degree of
stratification and the effective vertical communi-
cation between porosity zones within the
reservoir section, and (3) to evaluate pay
continuity, particularly between injectors and
producers, at the current pattern well spacing.
The interference testing revealed no evi-
dence of channeling or obvious fracture flow
systems in the reservoi r. In addition, no
fieldwide preferential flow direction was
indicated by the testing.
There was considerable evidence in the
test data indicating that the reservoir acts as a
distinctly layered system with restricted vertical
communication between layers. Static pressure
differences of 200-250 psi (1.4-1.7 MPa), after
adjusting to datum, were noted between
adjacent porosity zones in offsetting wells. A
series of drillstem tests conducted in one of the
infill wells showed similar pressure differentials
between various zones within the reservoir
section.
An attempt was made to correlate the
permeability-thickness product (kh) determined
from falloff tests with kh values calculated from
core data in the same wells. The kh calculated
using arithmetically averaged core permeability
data seemed to compare better with pressure
transient data than did kh values calculated
using geometrically averaged core
permeabilities. The results of this comparison
are presented in Table 2. Thus, arithmetically
averaged core permeability data were judged to
be more representative of the effective
reservoir permeability, and were used in the
simulation model where permeability data from
pressure transient tests were not available.
Native State Core Tests
In addition to the extensive amount of
conventional coring done in the West Seminole
field, one native-state core was taken. The
core was cut using lease crude as the coring
fluid. The core samples were preserved at the
drill site to minimize exposure to oxygen and
retain original reservoir wettability conditions
as closely as possible. The native state core
samples were used for steady-state relative
permeability testing to obtain flow
characteristics of the reservoir rock.
SIMULATION MODEL
The next phase of the study was to model
the reservoir using a three-dimensional,
three-phase, black oil reservoir simulator. The
specific numerical simulator used was the Black
Oil Model developed by INTERCOMP Resource
3
4. 4
THE ROLE OF NUMERICAL SIMULATION IN RESERVOIR MANAGEMENT
OF A WEST TEXAS CARBONATE RESERVOIR SPE 10022
Development and Engineering, Inc. The study
area for the simulation work consisted of only the
main dome portion of the reservoir (Fig. 3). The
simulation study was concerned primarily with
predicting response in the main dome under
pattern waterflood operations. A no-flow
boundary, located in the structural saddle
between the main dome and east dome, formed the
eastern border of the study area. A distinct
difference in recorded field pressure history was
observed between wells in the main dome and
those in the east dome. This information, along
with well completion data, was used to
approximate the location of the no-flow boundary.
Model Grid Configuration
It was necessary to use a three-dimensional
grid system in the model since one of the major
objectives of the simulation work was to evaluate
the sensitivity of reservoi r response to vertical
communication within the reservoir section. The
model grid chosen incorporated the six layers
developed from the geologic work. With this
much resolution in the vertical dimension, it was
necessary to use a relatively coarse areal grid to
keep computer run time within reasonable limits.
The areal grid chosen is shown in Fig. 8. It
consisted of 288 areal blocks of about 10 acres (4
ha) each. Thus, the complete model grid was
composed of 1,728 blocks.
The porosity and permeability data for each
of the six layers was digitized from computer
contour maps. The model grid was chosen so
that the boundaries between layers coincided with
the location of potential vertical flow barrier units
identified in the geologic study. The strength of
the flow barriers could then be controlled
mathematically in the model by varying the
vertical transmissibility across the block
boundaries. This allowed study of the sensitivity
of reservoir response to variations in the
strength and distribution of these vertical flow
barriers.
Grid Size Sensitivity
Considerable time was spent evaluating the
effects of grid block size on simulator perform-
ance. There was concern that the relatively
coarse grid used in the model might introduce
serious errors into the simulator performance.
The primary concern was that the coarse
areal grid might introduce potentially large errors
through numerical dispersion effects. The pat-
tern waterflood area was modeled with wells in
alternate areal grid blocks. When further infill
drilling was investigated, there would be a well in
every areal block in some parts of the model. A
second point of concern was that a fairly distinct
permeability stratification was observed within the
oil zone (see Fig. 7). The use of grid blocks
approximately 50 feet (15 m) thick averaged out
much of this layering effect. Ignoring this
layering could produce errors in simulating
waterflood performance.
Both numerical dispersion and layering effects
762
were accounted for by using pseudo relative
permeability curves in the model. The pseudo
relative permeability curves were constructed
using the technique developed by Kyte and
Berry8. This technique produces pseudo
functions which account for both layering
and numerical dispersion in a coarse grid
model.
The pseudo relative permeability curves
were tested by comparing the performance of a
fine-grid, single-pattern model with the
performance of a model with coarse grids such
as used in the field-scale study. The fine and
coarse grid models are shown in Fig. 9. The
original rock relative permeability curves were
used in the fine-g rid model, and the pseudo
curves were used in the coarse-grid model.
Waterflood performance was tested first
considering the existing normal five-spot
pattern, and again considering the effects of
infill drilling to an inverted nine-spot pattern
development. In both cases, the waterflood
performance of the actual model grid using the
pseudo curves matched the performance of the
fine-grid pattern model using the rock relative
permeabiIity cu rves.
HISTORY MATCHING
After the reservoir description data had
been digitized and incorporated into the model
grid system, the simulator was used to
history-match field performance. Two major
objectives were set out for this phase of the
work:
1) Verify and further refine the
reservoir description by
history-matching the field pressure
and production performance.
2) Evaluate the sensitivity of reservoir
performance to changes in the
strength and distribution of barriers
to vertical flow of fluids within the
reservoir section.
Pressure and Production Performance
Both field and model performance indicated
that the principal producing mechanism in this
reservoir was a solution gas drive with some
assistance from expansion of the gas cap. The
effects of gas cap expansion were felt primarily
in those wells located down-dip from the gas
zones and near the edges of the field. Very
little or no effect of any water drive was
observed.
The history-matching work concentrated on
matching the overall field performance. Reliable
individual well data were not generally available
over the entire field life for every well.
Individual well data were matched wherever
available and considered to be valid, but the
5. SPE 10022 K. J. HARPOLE AND C. L. HEARN
most emphasis was given to matching overall field
performance.
Field-wide pressure surveys were taken on a
six-month basis for the early years of field life.
Later, they were taken on an annual basis, and
still later replaced by key-well surveys in some
years. The pressure data were generally very
consistent and considered valid, although
individual well points were often missing or
obviously in error due to gauge failures, etc.
The overall field performance match was
further complicated by the problem of excessive
free gas production, especially during early field
life. This was primarily a result of gas
channeling due to poor completions. Free gas
production from the gas cap has been and
continues to be a problem in the West Seminole
field. No accurate records of actual gas
production are available for the first six years.
This is the period prior to construction of a
gasoline plant in the field. The history-matching
work indicated that 8 to 10 BCF (230Xl06 to
285Xl06 m3 ) of gas -cap gas, over and above the
reported production, had to have been produced
during the first six years of field life in order to
match the field pressure decline. This excess
gas was presumably flared during the period
prior to construction of the gas plant. Early
records do contain reports of extensive flaring of
gas during this period.
Only minor adjustments had to be made to
the original porosity and permeability
distributions to match individual well pressure
and production performance. This excellent
initial performance match is undoubtedly a result
of the extensive amount of core data available and
the effort spent in obtaining an accurate reser-
voir description prior to the simulation. Most of
the adjustments needed were in an area covering
about 300 acres (120 ha) in the northeastern
corner of the field. The adjustments consisted of
small increases in hydrocarbon pore volume and
horizontal transmissibilities necessary to match the
pressure performance of six wells in this area of
the field.
Another significant aspect of the history
matching work was to quantify the approximate
effective injection into the peripheral water
injection wells. The cumulative effective injection
into the peripheral wells had to be reduced to 15
to 20% of total injection to match the observed
reservoir pressure response. The inability of the
peripheral water injection to produce any
significant reservoir response was due to two
major factors:
1) The peripheral injection wells were
generally completed well below the
water-oil contact, and as a result, the
injection interval was separated
vertically from the reservoir by several
of the tight "barrier" zones.
2) Pay continuity was not sufficient in
these lower zones to allow the injected
water to readily move laterally over the
763
two, three, or more well spacings
required to bring it into contact with
the main productive zones.
The final pressure and production history
match obtained is shown in Fig. 10.
Sensitivity to Vertical Communication
The geologic study provided information to
delineate the position, areal extent, and
variation in thickness of rock units which were
extensively anhydrite cemented, forming
potential barriers to vertical flow of fluids
within the reservoir section. However, it was
difficult to quantify the vertical permeability of
these units. The history match of reservoir
performance using the simulator allowed an
approximate determination of the effective
vertical permeability across these zones.
The foot-by-foot core analyses of these 2-
to 8-ft (0.6- to 2.4-m) thick "barrier" zones
showed horizontal permeabilities which were all
less than 1 md, with one or more values
commonly less than 0.1 md. Vertical
permeabilities were not measured; however, it
would be expected that they would be
'tonsiderably less than the measured horizontal
permeabilities.
The simulator was used to examine the
sensitivity of reservoir response to changes in
the effective vertical permeability of these
barriers. Four different configurations were
used in the sensitivity work:
1) "NO BARRIERS" vertical
permeability equal to horizontal
permeability in all model layers.
2) "MODERATE BARRIERS" vertical
transmissibilities reduced to simulate
the effect of barrier units having 0.1
to 0.01 md vertical permeability.
3) "STRONG BARRIERS" vertical
transmissibilities reduced to simulate
th~3 effect_40f barrier units having
10 to 10 md vertical permeability.
4) "COMPLETE NO-FLOW BARRIERS"
vertical transmissibilities set to zero
at layer boundaries near the gas-oil
contact.
This work showed that it was not possible
to match the field performance with ~OMPLETE
NO-FLOW BARRIERS" within the reservoir
section. The "NO-BARRIERS" and "MODERATE
BARRI ERS" configurations did not show
significant differences in internal reservoir
response characteristics. Thus, the majority of
the time was spent examining differences in
reservoir response between the "MODERATE
BARRIERS" and the "STRONG BARRIERS"
models.
Vertical flow between layers in the model
was controlled by adjusting the vertical
5
6. 6
THE ROLE OF NUMERICAL SIMULATION IN RESERVOIR MANAGEMENT
OF A WEST TEXAS CARBONATE RESERVOIR SPE 10022
transmissibilities between layers. The objective
was not to accurately quantify the actual vertical
permeability, but rather to obtain a satisfactory
predictive model of reservoir performance.
Variations in vertical transmissibility will control
the material balance of fluids migrating vertically
into or out of a given layer in the model. This,
in turn, is reflected in changes in such reservoir
response characteristics as gas coning behavior
and the magnitude of pressure differentials
created between zones within the reservoir.
Two major differences were observed in the
response of the "MODERATE BARRIERS" and
"STRONG BARRIERS" models during the history
matching work. These two areas of difference
were (1) the importance of gas coning as the
mechanism responsible for the observed excess
free gas production and (2) the magnitude of
vertical pressure differentials created between
zones in the reservoir. Under the "MODERATE
BAR RIERS" model configuration, the excess gas
cap gas production was observed to occur as a
consequence of gas coning into wells with
structurally higher completion intervals.
However, field performance data indicated that
gas coning was not the major source of the excess
free gas production. The wells exhibiting the
coning behavior in the model were not historically
high gas-oil ratio (GOR) or "problem" wells in the
field. Rather, the high-GOR wells (requiring
repeated workovers) were distributed randomly
th roughout the field, both with regard to areal
location and structural position of the completion
interval. The "STRONG BARR IERS" configuration
greatly restricted the vertical movement of gas.
Coning was drastically reduced and appeared
much later in the producing life of the wells.
The excess gas-cap gas production was obtained
in this model by simulating gas channeling behind
pipe into the "problem GOR" wells. In this way,
the correct overall field gas production was
maintained. This resulted in an equally
satisfactory pressure history match and a better
match of individual-well GOR behavior. Thus,
individual-well GOR performance and workover
histories provided evidence to support the
"STRONG BARRI ERS" model as being the more
correct reservoir description.
The other major difference observed in model
response under these two barrier strength
configurations was the magnitude of the pressure
differentials created across the barriers between
zones in the reservoir. The "MODERATE
BAR RIERS" model showed maximum pressure
differentials of 20 to 25 psi (0.14 to 0.17 MPa)
between zones. The "STRONG BARRIERS" model
showed that pressure differentials of up to 150 to
200 psi (1 to 1.4 MPa) between zones would
develop in many areas of the field. Results of a
sequence of drillstem tests conducted in Well
609W, drilled in 1973, indicated that pressure
differentials between zones in excess of 100 psi
(0.7 MPa) had developed. Also, during the
pressure interference testing, pressure differen-
tials in excess of 200 psi (1.4 MPa) were
observed between different zones in adjacent wells
in some parts of the field. Thus, the available
evidence again supports the "STRONG BARRIERS"
764
configuration as being the more correct model of
reservoir structure and performance.
PREDICTIONS OF FUTURE PERFORMANCE
The history-matched "STRONG BARRIERS"
reservoir description was chosen as the best
predictive model of the alternatives examined.
The final pressure and production performance
history match using this model is shown in Fig.
10. The simulator was next run in a prediction
mode to project future field performance. This
prediction assumed a continuation of the field
configuration and operating conditions existing
as of Jan. 1,1978. This case was designated
as the base case against which all other
operating alternatives were compared. Field
performance projections for the base case are
presented in Fig. 11.
A wide range of alternative operating plans
were examined using the simulation model. The
major parameters examined were: (1) changes
in the rates of water injection, (2) management
of gas cap voidage (alternatives ranged from
greatly increased gas injection to blowdown of
the gas cap at various points in time), and (3)
further infill drilling of additional wells in the
pattern area.
This prediction work demonstrated the
complex nature of the waterflood response in
this reservoir. The most significant factor
governing reservoir performance was the
vertical communication between the oil zone and
the gas cap. Even with the extremely low
history-matched vertical permeabilities used in
the simulator, prediction runs indicated that
significant movement of oil into the gas cap
would occur in response to any large pressure
differential created between the oil zone and the
gas cap.
The actual volume of oil moving into the
gas cap was extremely sensitive to the vertical
permeability assumed and to the dynamics of the
specific field operating plan considered.
Projections assuming continued current
operations indicated that a volume of oil
equivalent to 10 to 20% of the potential
waterflood oil recovery could be lost to the gas
cap. The model showed that any operating plan
which would cause an increase in the pressure
differential between the oil zone and the gas
cap (such as greatly increased water injection
rates or early blowdown of the gas cap) would
cause a further increase in the volume of oil
moving into the gas cap, and a corresponding
decrease in recovery.
Conversely, operating schemes which tend
to minimize the pressure differential between
the waterflood oil zone and the gas cap, such
as increased gas injection into the gas cap or
drilling additional production wells in the
waterflood zone, showed a reduction in oil
movement into the gas cap and a corresponding
increase in waterflood oil recovery. A
comparison of the results of all of the
prediction cases examined showed that an infill
7. SPE 10022 K. J. HARPOLE AND C. L. HEARN
drilling program was by far the most economically
attractive alternative. The projected incremental
oil recovery as a result of converting the eXisting
40-acre (16.2-ha) five-spot waterflood pattern
development to a 40-acre (16.2-ha) inverted
nine-spot pattern development through infill
drilling is as follows:
Ultimate Recovery
Per Cent of
Million Stock- Original
Tank Barrels (106 m3 ) Oil-in-Place
Estimated 28.2 (4.48) 16.2
Primary Recovery
Continued Current 45.1 (7.17) 25.9
Waterflood Operations
Waterflood with 49.0 (7.79) 28.2
Infill Drilling
Incremental Recovery
From Infill Drilling 3.9 (0.62) 2.3
The predicted oil production performance of the
main dome area under infill drilling is compared to
continued current operations in Fig. 12.
The simulation work showed that there is a
definite potential for movement of oil into the gas
cap under waterflood operations. If this is
ignored, the recovery and economic return will be
reduced significantly. If, however, this potential
for movement of oil between zones is recognized,
the gas cap management, timing of infill drilling,
and water injection rates can be designed to
minimize the loss of oil to the gas cap.
PROPOSED RESERVOIR MANAGEMENT PLAN
The proposed reservoir management plan
called for drilling up to 46 infill production wells
within the existing 40-acre (16.2-ha) five-spot
pattern development. These would be located to
allow the pattern area to be converted eventually
to a 40-acre (16.2-ha) inverted nine-spot pattern
development. Eight wells were to be drilled in
1979 followed by eight additional wells in each
succeeding year, to a maximum of 46 wells. The
performance of the infill drilling program would
be evaluated at each step. Water injection rates
would be increased concurrently with the drilling
program to maintain voidage replacement in the oil
zone but prevent excessive over-injection of
water.
The study indicated that blowdown of the
gas cap before the peak in waterflood oil
production rates would significantly reduce oil
recovery. Conversely, increased gas injection
into the gas cap would yield additional waterflood
oil recovery; however, current economic
conditions indicate this would not be cost
effective at the present time. Other possible
operating alternatives include injection of lower
heating value hydrocarbon gas or inert gas to
achieve voidage replacement in the gas cap at
lower cost.
765
COMPARISON OF FIELD PERFORMANCE
WITH MODEL PREDICTIONS
The performance of the field to date has
shown that this study has provided a valid
predictive model of field performance. Figures
13 and 14 present a comparison of the oil
production and gas-oi I ratio performance
predictions with the observed performance for
the period from January, 1978 through July,
1981. The performance comparison shows
excellent agreement with the simulation model
predictions.
The first group of eight infill producing
wells was put on production during the last half
of 1979. The combined initial potential of these
eight wells was tested at 1,494 BOPD
(238 m3 /d). The simulation model prediction
had projected this group of wells to have a
combined initial production of 1,560 BOPD (248
m3 d), a difference of less than 5%.
Because of the success of the infill drilling
program through mid-1980, it was decided to
accelerate the schedule of the drilling program
in the second half of 1980. This departure
from the operating program assumed in the
simulator resulted in slightly higher field
producing rates and higher gas-oil ratios than
predicted by the model.
CONCLUSIONS
1) Development of a detailed reservoir
description using both geological and
engineering data is necessary for the
type of comprehensive numerical
simulation study conducted for the
West Seminole reservoir.
2)
3)
4)
5)
In carbonate reservoirs, it is
important that the effects of both
primary depositional factors and
post-depositional diagenetic controls
on the porosity and permeability
distribution be considered in
development of the reservoi r
description.
Waterflood performance of this field is
extremely sensitive to the vertical
permeability between major porosity
zones in the reservoir.
It was possible to quantify the
general order of magnitude of vertical
permeability effects in this reservoir
using a three-dimensional simulation
model.
An understanding of the internal
reservoi r response characteristics is
essential to future reservoir
management of the West Seminole
field. The most important of these
characteristics are:
a) There wi II be a slow, but
7
8. 8
1.
2.
THE ROLE OF NUMERICAL SIMULATION IN RESERVOIR MANAGEMENT
OF A WEST TEXAS CARBONATE RESERVOIR SPE 10022
6)
substantial movement
the gas cap under
operations.
of oil into
waterflood
b) The magnitude of this movement
will depend on the pressure
differential created between the oi I
zone and the gas cap.
An increase in oil recovery can be
obtained by managing the reservoir to
minimize this pressure differential and
the resulting loss of oil to the gas cap.
This can be most economically achieved
through:
a) drilling additional production
wells in the pattern area,
b) controlling the rates of water
injection so as to maintain voidage
replacement in the waterflood
zone without over-injection, and
c) careful management of voidage re-
placement into the gas cap.
REFERENCES
Harris, D. G.: "The Role of Geology in
Reservoir Simulation Studies", J. Pet.
Tech. (May 1975) 625-632.
Harris, D. G. and Hewitt, C. H.:
"Synergism in Reservoir Management - The
3.
4.
5.
6.
7.
8.
766
Geologic Perspective", J. Pet. Tech. (July
1977) 761-770.
Jardine, D., Andrews, D. P., Wishart, J.
W., and Young, J. W.: "Distribution and
Continuity of Carbonate Reservoirs", J.
Pet. Tech. (July 1977) 873-885.
Harpole, K. J.: "Improved Reservoir
Characterization A Key to Future
Reservoir Management for the West
Seminole San Andres Unit", J. Pet. Tech.
(Nov. 1980) 2009-2019.
Ghauri, W. K., Osborne, A. F., and
Magnuson, W. L.: "Changing Concepts in
Carbonate Waterflooding, West Texas
Denver Unit Project An Illustrative
Example", J. Pet. Tech. (June 1974)
595-666.
George, C. J. and Stiles L. H.: "Improved
Techniques for Evaluating Carbonate
Waterfloods in West Texas", J. Pet. Tech.
(Nov. 1978), 1547-1554.
Zaaza, M. W.: "The Depositional Facies,
Diagenesis, and Reservoir Heterogeneity of
the San Andres Formation in the West
Seminole Field, Gaines County, Texas",
PhD Dissertation, The University of Tulsa
(1978).
Kyte, J. R. and Berry D.
Pseudo Functions to Control
Dispersion", Soc. Petro Eng. J.
1975) 269-276.
W.: "New
Numerical
(August,
9. TABLE 1
WEST SEMINOLE FIELD
RESERVOIR AND FLUID DATA
PRODUCTIVE SURFACE AREA, ACR'ES (ha)
AVERAGE PRODUCING DEPTH, FT (m)
AVERAGE GROSS OIL ZONE THICKNESS, FT (m)
AVERAGE GROSS GAS CAP THICKNESS, FT (m)
ESTIMATED ORIGINAL OIL IN PLACE,
MILLION STB (1 06stock-tank m3 )
ESTIMATED ORIGINAL FREE GAS IN PLACE,
BILLION SCF (109 std m3 )
AVERAGE POROSITY, %
AVERAGE PERMEABILITY, MD
AVERAGE CONNATE WATER SATURATION, %
RESERVOIR TEMPERATURE, of (GC)
ORIGINAL RESERVOIR PRESSURE (SATURATED)
AT 1575 FT (480 m) SUBSEA, PSIA (MPa)
ORIGINAL SOLUTION GAS-OIL RATIO,
SCF/STB (std m 3 /stock-tank m 3 )
OIL GRAVITY, GAPI (gm/ cm 3)
OIL VISCOSITY, CP (mPa-s)
OIL FORMATION VOLUME FACTOR AT 2020 PSIA
(13.93 MPa), RB/STB (res m 3/stock-tank m 3 )
TABLE 2
2782 ( 1126)
5112 ( 1558)
140 (43)
111 (34)
172 (27.3)
137 (3.92)
9.9
9
18
101 (38.3)
2020 (13.93)
773 (139)
34 (0.85)
0.98 (0.98)
1.38 (1.38)
COMPARISON OF PRESSURE TRANSIENT Kh WITH
Kh DERIVED FROM CORE DATA
FALLOFF CORE Kh CORE Kh
TEST Kh ARITHMETIC MEAN GEOMETRIC MEAN
WELL (md-ft) (md-m) (md-ft) (md-m) (md-ft) (md-m)
305W 1094 (333) 910 (277) 242 ( 74)
306W 1008 (307) 732 (223) 312 ( 95)
307W 533 ( 162) 637 ( 194) 355 (108)
609W 1306 (398) 1008 (307) 265 ( 81)
610W 944 (288) 446 ( 136) 193 ( 59)
611W 599 ( 183) 467 ( 142) 197 ( 60)
707W 889 (271) 868 (265) 335 (102)
767
10. ~
--/7-----_ r
-'---~I ---1--1----- .~" )"
( 1 I I _ ' ~- -rl
-i-L_ 'j----r----i, ~ ~." --
, iL r---~- "--
I , - _ ?
/ , f-- __:---( I
J UNIT~~ STATES 0: AMERICA 1/"--
~ ~ I r~--'i--'---cl='-r---- :_______.
L ' I I I I J---r"cC<
--.,!> I I L-.., ~' ,
..........., '------ J I
'___ 1- -. !* - ) I ')
~
TEXAS ' C--
WEST ----
SEMINOLE .r,
FIELD , ;Y
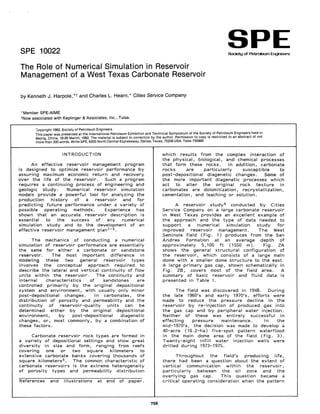
Fig. 1 - Field location map.
WEST SEMINOLE FIELD
STRUCTURAL MAP
TOP POROSITY
lEGEND
CONTOUR INTERVAL 50 FT.: 15.2 m
• EXISTII«lo ~ING WELLS
ri EXISTING INJECTION WELLS
r Gr,GAS INJE(:nON
o 2000 0 100C
~ I
FEET METERS
Fig. 2a - Structure map on top of porosity.
EAST-WEST CROSS SECTION
B
SCALE
Fig. 2b - Schematic cross section through the field.
768
o
t"""iiiMi
500
.....,........,
MILES
o 800
~------'
KILOMETERS
11. ----- ----------- --~-~:-~;;.p----" =---" ::.-::.-:---------;~~~;~~-;~~---
,p-- --p- • • • -"~ WATER INJECTION
// ' / PATTERN
/ ,
f · · • • • • 'r- __/I
: 1 ,:--:--:-r :
p • • • I.~.: • • t
I • ______ ------1-----,:______~---J
• WATERFLOOD' 1
- - - - - - - --- --------,
,
p _le:_:_:.1
I 'GI' : "PATTERN, AREA": I
------------1 b • ---:--r~---i--:-r-~---r~--l · • 'p- - - --p- --'i
•
I I I : : _
~-----;, 1>--.......
' --/-----9 P
: ':0__
,
l _____ ,
•
• •
---I' ,
• • •
• •
•
•
•
•
• •
•
•
,
,
I
.....-f -:---------...... ~~.---,: F---I--'----i
, I
: : -MAIN DOME-
I ,
, I
, ,
AREA
, ,
I ,
~ __________J L____ L-~!!_OJ!!..u~~
lEGEN 0
"EAST DOME"
AREA
WEST SEMINOLE FIELD WELL PA TTERN
AND STUDY AREA DESIGNATIONS
• EXISTING PRODUCING WELLS
rl EXISTING INJECTION WELLS
r 'GI':GA5 INJECTION
o 2000
I
FEET
o
i
METERS
1000
Fig_ 3 - Field well pattern and study area designations.
POSSIBLE LOSS OF OIL
TO GAS CAP
,
,
I
I
,
,
,
,
,
,
,
,
,
,
,
,
:
,
,
-----------~
INJECTION
WELL
PRODUCTION
WELL
.. t
GAS CAP
Fig. 4 - Schematic showing possible loss of oil to the gas cap.
769
12. I-
W
W
IJ..
Z
J:
l-
n.
w
C
RESERVOIR ZONATION IN WELL 307W
POR. (%) PERM.(MD)
o 25 50 0 25 50
4970 +---'---'-----'-----'
CORE
LITHOLOGIC
LOG GAMMA RAY
en
w
a::
<
c
Z
::J
o
al
W
Z
o
N
.......
a::
w
>-
<
...J
k'i'~'1 PELOIDAL GRAINSTONE FACIES F
••SKELETAL WACKESTONE FACIES
_ ZONE WITH EXTENSIVE ANHYDRITE
Fig. 5 - Reservoir layering based on geologic study, log data, and core data.
PERMEABILITY ZONA TION IN THE WEST SEMINOLE FIELD
WELL WELL
306
WELL
LEGEND
PERMEABILITY ZONES
c::::::::::JOVER 20 MD.
f::;;/;j10-20 MO.
!@TIlj1-10 MO.
_ LESS THAN 1MD.
(PERMEABILITY
BARRIER)
GEOLOGIC FACIES
b'){/j NON-SKELETAL
Ql'ffi4 SKELETAL (FUSULINID)
_SKELETAL
ANHYDRITE FILLED
WELL
SCALE
Fig. 6 - Cross section showing permeability distribution.
770
WELL
808
13. PERMEABILITY STRA TIFICA T/ON IN MODEL LA YER 5
A A'
WELL 811 W
PERM (Md)
WELL 810 W
PERM (Md)
WELL 1307 W
PERM (Md)
o 3 5 ~ 1 ~
1640 +-L.L---'---'-'-'--...L-' 1610---t-----L-~LJ._..1_-'---.J
1050
16'55
1660
I
101':: -;
J.",..------- - - - - - - - - - ,.,------- - -
-
f-~f------ - - - - - - - ,,:;-J---,'i-----,.......-
-
-
-
-
--
..-
,"
-
-
-- 1645
--' _1651J l
-- - 165'
-
..-
-
- Ib6'5
- - - - - - - I~ ....,,~_ _ _ _ _ _ ",. _ _ - -;'67C
1670 ~;,....------ - - - - - - - -164[-1--'--.::-_ _ _ _ _ _ - - -
1665
1675 f-oi------- - - - - - - - -'64:;-.-1--"""'-"""'---- _ _ _
1675
11>80
~~=:::......- - - - - - .'--f----
168'5 - - - , ... ~~-~ - - __ __ 169('
'0
----- -'6"5"++-_____
J---f~---- - - - - - - - -,,-;::jlr--......;~----
1690
1700
1705
- - - - __ 1700
-----
1'=-------- - - - - ____.~-!'-------- __ _
170'5-+-~--'---
NOTE: WELLS NOT IN CORRECT
RELATIVE STRUCTURAL
POSITIONS
,-------------------- -----"...- ---"..
..--- ----------------------- --1
i p.. p' p. !
: :
: p'" P"' p. :
r-----------J p. p. p. p. !
,
l_~ _____ _
"P.811~lelO p.
flO ~; 0'" 0"" 0'" "'00."
p".. po. .• P" p"
: P"" '"'00''' O'l'" 0'''''
'-----, p'" p" i307 p,. p,.
p.
P'"
P'''' P"
'-----1, p,., [----------1 0", p'.
, ,
P'"
L
__________1 L
____L...f!!i.!3~!!!..~__________________~
WEST SEMINOLE FIELD
LEGEND
o EXISTwo. JIAODUCIG WEUS
rl EXISTIIG ~TION _LLS
r 'OI',QAS IllU!CTION
Fig. 7 - Permeability stratification within the main waterflood zone.
771
14. I t--
,-,-- -+-- -- -- -- ___h,L-h' -- -- -- -- -- - --
I
I
P IP
I I • • • P
! l i
I
I : 1p • • • • • • p
+ i I
• ft p
i P
P
I •
t-;-
I
I
I
I
Ip • • • • • •
,rt-p I p P p P
! l I •
--
:p • • • • •
I
P p p p P I P
I
I
----------- --- -------
I
I
I
P p ? :
I
• • •
I
I
I
P • • • • • •
I I I • • • I
I
,- -- 1 P ,p p p p •
I
P I
•
I
• • • •
I
•
I
I
• • :
p I
I
I
___________ J
j I I
P : : p !
I P P P p
I i
I
i
I
I
I I
I
I
I
I
i iLJ
~--'--
~ _ ___ .L_Cl!!'I_O}!!...L,!!~ ___________ _
LEGEND
SIMULATION MODEL GRID • EXISTING PRODUCING WELLS
ri EXISTING INJECTtON WELLS
r 'GI': GAS INJECTION
o 2000 o 1000
~i~_1 i I
FEET METERS
Fig. 8 - Areal grid used in the simulation model.
FINE GRID MODEL
7X7 AREAL GRID COVERS
ONE 10-ACRE (4-ha)
QUARTER 9-SPOT PATTERN.
1 LAYER REPRESENTS GAS CAP;
7 LAYERS REPRESENT OIL ZONE.
COARSE GRID MODEL
7X7 AREAL GRID COVERS
NINE 40-ACRE (16.2 ha)
9-SPOT PATTERNS.
LA YER REPRESENTS GAS CAP;
LAYER REPRESENTS OIL ZONE.
SHADING SHOWS QUARTER
9-SPOT AREA REPRESENTED BY
FINE GRID MODEL ABOVE.
Fig. 9 - Simulation model grid systems used in the grid size sensitivity study.
772
15. WEST SEMINOLE FIELD MAIN DOME
10
u.
() 250 (I')
en GAS PRODUCTION HISTORY MATCH E
z '0
0 -
Ul
...J 200 co
...J 0
05 I
I Z
Z r-- 150 0
0 5 ~
~ ()
()
"CALCULA TED :::>
:::> 100 0
0 J-----, 0
0 r-- L __ ,
a:
a:
___ ..... I
a..
a.. 50
en en
<C
<C (!)
(!)
0
'50 '55 '60 '65 '70 '75
a: 500 80 a:
>
- <C
en w
...J >
CD
WATER PRODUCTION HISTORY MATCH -
CD 400 (I')
60 E
(I') (I')
0 --- 0
.,.... .,....
I
300
I
z CALCULATED z
0 ".--- 0
~ 40 ~
() ()
:::> 200 :::>
0 0
0 0
a: OBSERVED
...... a:
a.. 20 a..
a: 100 a:
w w
l- I-
e:( e:(
~
0 0
~
'50 '55 '60 '65 '70 '75
2000 14
... _-- 12
-------
1600
CALCULATED/---
OBSERVED
en I 10
a.. as
I a..
~ 1200 ~
8 I
:::> w
en a:
en 6
:::>
w 800
en
a: en
a.. w
PRESSURE HISTORY MATCH 4
a:
a..
400
2
0 0
'50 '55 '60 '65 ',70 '75
Fig. 10 - Final pressure and production history match.
773
16. o
~ 5000
00
I
~ 4000
«
a::
:::! 3000
o
W
C) 2000
«
a::
W
> 1000
«
>-
~ 0
o
6000
0
......
III
5000
I-
CJ)
I
W
I- 4000
«
a:
z 3000
0
i=
()
2000
:::>
0
0
a: 1000
a..
...J
(5
0
WEST SEMINOLE FIELD MAIN DOME
OIL PRODUCTlON,GAS/OIL RA TlO, WATER/OIL RATIO
co
~16000~---------------------------------------------------------------
00
....
u.
~ 8000
I
a::
8 0
a::
(5
a::
o
3:
>-
a:: 00
wtt-
OOw
Wa::
a::::J
wOO
c)oo
«w
a:: a::
w[L
>
«
12
9
6
2100
1700
1300
900
500
100
'50 '55 '60 '65 '70 '80 '85 '90 '95 2000 '05 '10 '15
PRESSURE RESPONSE
---------
HISTORY _.--+-_. PREDICTION
,
'50 '55 '60 '65 '70 '75 '80 '85 '90 '95 2000 '05 '10 '15
'"
2000 "'~
1000 f
a::
o
C)
o
a::
o
3:
14 ~
~
12 t1
a::
10 w::J
C)OO
8 « ~
a:: a::
w[L
6 ~ a::
4 (5
>
a::
2 ~
w
a::
Fig. 11 - Predicted field performance under the base case of continued current operations.
WEST SEMINOLE FIELD MAIN DOME
COMPARISON OF OIL PRODUCTION PERFORMANCE
'50 '55 '60 '65 '70 '75 '80 '85 '90 '95 2000 '05 ,10 ,15
Fig. 12 - Predicted field performance showing incremental oil recovery expected from infill
drilling.
774
1J
....
800 '1
I
W
~
600 ri
...I
(5
400 w
C)
«
a::
200 ~
«
o
800
600
400
200
0
>-
...I
«
o
"tl
('J
......
E
I
W
I-
«
a:
z
0
i=
()
:::>
0
0
a:
a..
...J
(5
17. 6000
• •
. :'.' '. •
5000 I~ I I 800 "0
I I , I
0 .".' ,...,: .....
....., " C')
..... •
In
I
I E
I
l- i ' I
U) 4000 I
I Z
1
/ . 600
z • W
I
l-
I
W <
l- .... t...•.... a:
< 3000 ,.....................- I
..J
a: /
/ •
.....--. PREDICTED PERFORMANCE 0
..J 400
0 e_e_e_e_e
ACTUAL PERFORMANCE
2000
200
1000
'78 '79 '80 '81 '82
Fig. 13 - Comparison of actual vs. predicted oil production performance.
7000
1200 C')
. PREDICTED PERFORMANCE E
In
/I
.-.-.-. ACTUAL PERFORMANCE 1100 .....
I- 6000 ''.,., ~
U)
..... . 1000 0
u. ,
() 1/ ........, l, I-
U)
5000
• • I • 900
U)
• I
• .' I
I Z
Z , I
...
0
800 0
•
l-
I
• ,.... I-
< 4000 .
1
700 <
• ., I I
a:
a: • II / ., 'oJ
., I ... I
• '4 ..J
..J e_e •
600
0 0
I 3000 U)
U) 500 <
< (!)
(!)
400
2000
'78 '79 '81 '82
Fig. 14 - Comparison of actual vs. predicted GOR performance.
775