Downloaded 44 times
![HELLEBORECAPITAL
Introduction
Standard correlation coefficients
A metric space for copulas
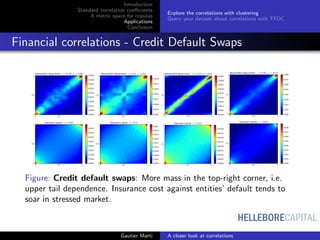
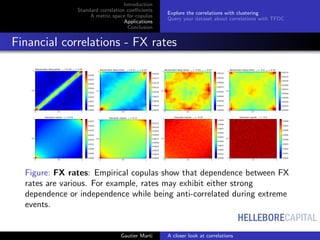
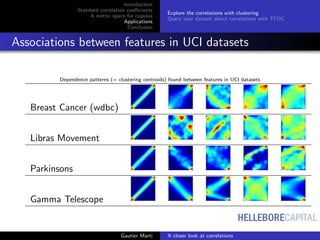
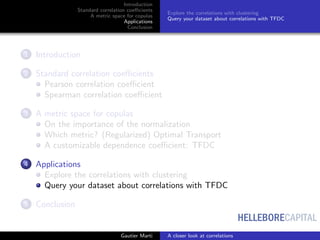
Applications
Conclusion
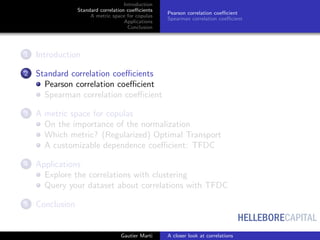
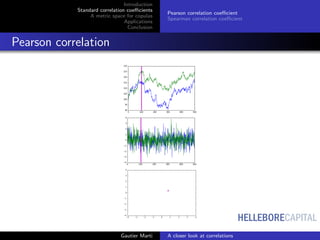
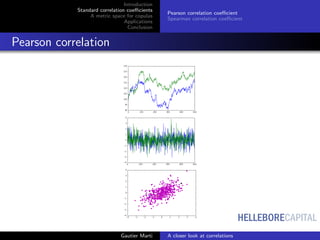
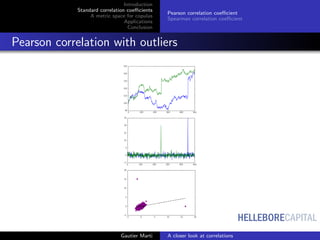
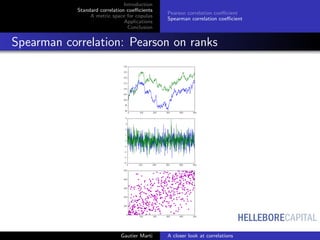
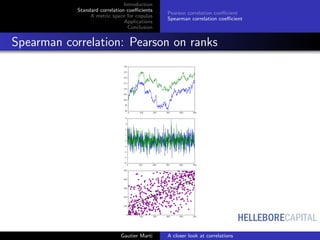
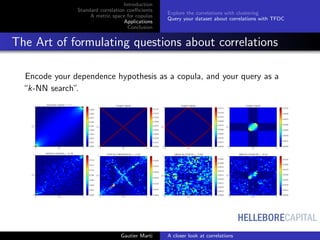
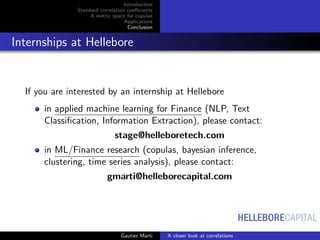
What is correlation?
E[Xi Xj ] − E[Xi ]E[Xj ]
(E[X2
i ] − E[Xi ]2)(E[X2
j ] − E[Xj ]2)
∈ [−1, 1]
N
k=1(xik
− xi )(xjk
− xj )
N
k=1(xik
− xi )2 N
k=1(xjk
− xj )2
∈ [−1, 1]
import numpy as np
np.corrcoef(x_i,x_j)
Gautier Marti A closer look at correlations](https://image.slidesharecdn.com/mlmeetups4e3slides-161105203113/85/A-closer-look-at-correlations-3-320.jpg)


![HELLEBORECAPITAL
Introduction
Standard correlation coefficients
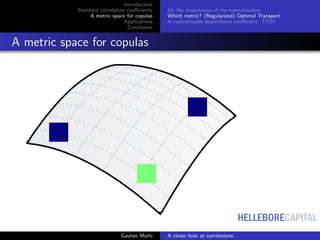
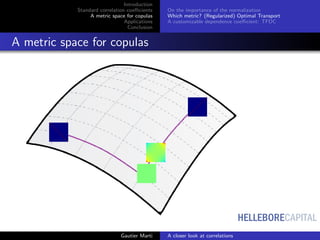
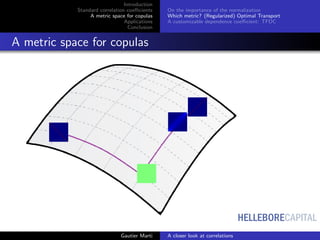
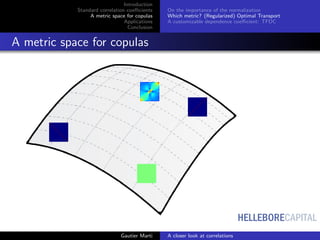
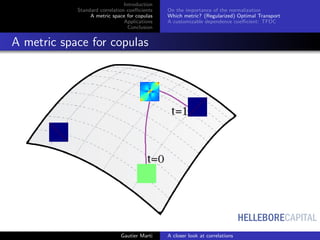
A metric space for copulas
Applications
Conclusion
On the importance of the normalization
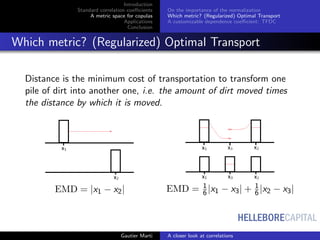
Which metric? (Regularized) Optimal Transport
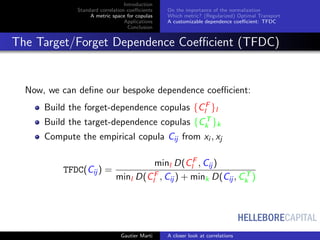
A customizable dependence coefficient: TFDC
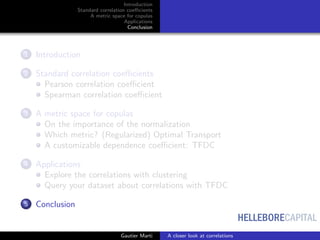
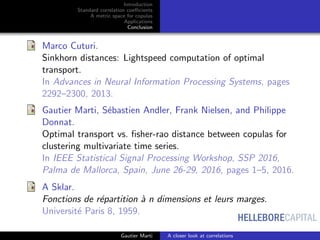
From ranks to empirical copula
Sklar’s Theorem [3]
For (Xi , Xj ) having continuous marginal cdfs FXi
, FXj
, its joint cumulative
distribution F is uniquely expressed as
F(Xi , Xj ) = C(FXi
(Xi ), FXj
(Xj )),
where C is known as the copula of (Xi , Xj ).
Gautier Marti A closer look at correlations](https://image.slidesharecdn.com/mlmeetups4e3slides-161105203113/85/A-closer-look-at-correlations-23-320.jpg)
![HELLEBORECAPITAL
Introduction
Standard correlation coefficients
A metric space for copulas
Applications
Conclusion
On the importance of the normalization
Which metric? (Regularized) Optimal Transport
A customizable dependence coefficient: TFDC
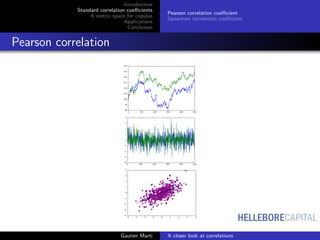
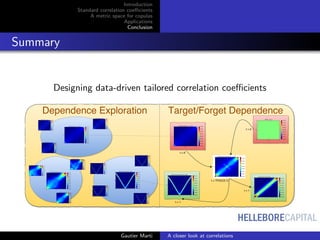
Minimum, Independence, Maximum copulas
Fr´echet–Hoeffding copula bounds
For any copula C : [0, 1]2
→ [0, 1] and any (u, v) ∈ [0, 1]2
the following
bounds hold:
W(u, v) ≤ C(u, v) ≤ M(u, v),
where W is the copula for counter-monotonic random variables, and M
is the copula for co-monotonic random variables.
0 0.5 1
ui
0
0.5
1
uj
w(ui,uj)
0.000
0.002
0.004
0.006
0.008
0.010
0.012
0.014
0.016
0.018
0.020
0 0.5 1
ui
0
0.5
1
uj
W(ui,uj)
0.0
0.1
0.2
0.3
0.4
0.5
0.6
0.7
0.8
0.9
1.0
0 0.5 1
ui
0
0.5
1
uj
π(ui,uj)
0.00036
0.00037
0.00038
0.00039
0.00040
0.00041
0.00042
0.00043
0.00044
0 0.5 1
ui
0
0.5
1
uj Π(ui,uj)
0.0
0.1
0.2
0.3
0.4
0.5
0.6
0.7
0.8
0.9
1.0
0 0.5 1
ui
0
0.5
1
uj
m(ui,uj)
0.000
0.002
0.004
0.006
0.008
0.010
0.012
0.014
0.016
0.018
0.020
0 0.5 1
ui
0
0.5
1
uj
M(ui,uj)
0.0
0.1
0.2
0.3
0.4
0.5
0.6
0.7
0.8
0.9
1.0
Gautier Marti A closer look at correlations](https://image.slidesharecdn.com/mlmeetups4e3slides-161105203113/85/A-closer-look-at-correlations-24-320.jpg)


![HELLEBORECAPITAL
Introduction
Standard correlation coefficients
A metric space for copulas
Applications
Conclusion
On the importance of the normalization
Which metric? (Regularized) Optimal Transport
A customizable dependence coefficient: TFDC
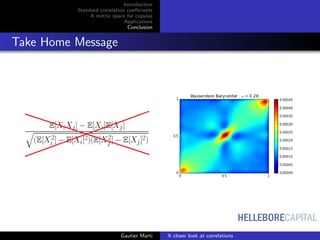
Which metric? (Regularized) Optimal Transport
Its geometry has good properties in general [1], and for copulas [2].
0 0.5 1
0
0.5
1
0.0000
0.0015
0.0030
0.0045
0.0060
0.0075
0.0090
0.0105
0.0120
0 0.5 1
0
0.5
1
0.0000
0.0015
0.0030
0.0045
0.0060
0.0075
0.0090
0.0105
0.0120
0 0.5 1
0
0.5
1
0.0000
0.0015
0.0030
0.0045
0.0060
0.0075
0.0090
0.0105
0.0120
0 0.5 1
0
0.5
1
0.0000
0.0015
0.0030
0.0045
0.0060
0.0075
0.0090
0.0105
0.0120
0 0.5 1
0
0.5
1 Bregman barycenter copula
0.0000
0.0008
0.0016
0.0024
0.0032
0.0040
0.0048
0.0056
0 0.5 1
0
0.5
1 Wasserstein barycenter copula
0.0000
0.0004
0.0008
0.0012
0.0016
0.0020
0.0024
0.0028
0.0032
Gautier Marti A closer look at correlations](https://image.slidesharecdn.com/mlmeetups4e3slides-161105203113/85/A-closer-look-at-correlations-29-320.jpg)

![HELLEBORECAPITAL
Introduction
Standard correlation coefficients
A metric space for copulas
Applications
Conclusion
On the importance of the normalization
Which metric? (Regularized) Optimal Transport
A customizable dependence coefficient: TFDC
TFDC Power
0.00.20.40.60.81.0
xvals
power.cor[typ,]
xvals
power.cor[typ,]
0.00.20.40.60.81.0
xvals
power.cor[typ,]
xvals
power.cor[typ,]
cor
dCor
MIC
ACE
MMD
CMMD
RDC
TFDC
0.00.20.40.60.81.0
xvals
power.cor[typ,]
xvals
power.cor[typ,]
0 20 40 60 80 100
0.00.20.40.60.81.0
xvals
power.cor[typ,]
0 20 40 60 80 100
xvals
power.cor[typ,]
Noise Level
Power
Figure: Power of several dependence coefficients as a function of the
noise level in eight different scenarios. Insets show the noise-free form of
each association pattern. The coefficient power was estimated via 500
simulations with sample size 500 each.
Gautier Marti A closer look at correlations](https://image.slidesharecdn.com/mlmeetups4e3slides-161105203113/85/A-closer-look-at-correlations-37-320.jpg)
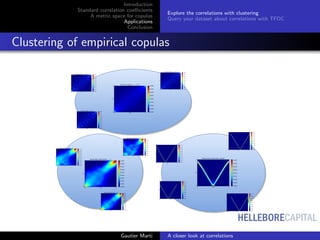

The document discusses standard correlation coefficients, including Pearson and Spearman metrics, and emphasizes the significance of normalization in correlation analysis. It introduces a customizable dependence coefficient known as the Target/Forgot Dependence Coefficient (TFDC) which enhances correlation exploration through applications like clustering. Additionally, it examines various copula methods and their applications in analyzing dependencies between variables.


![7.__Developing_a_Research_Proposal[1].pptx](https://cdn.slidesharecdn.com/ss_thumbnails/7-260131073037-df92dd7d-thumbnail.jpg?width=640&height=640&fit=bounds)


![Hacking-Uncovered-How-People-Get-Hacked-and-How-to-Stay-Safe[1].pptx](https://cdn.slidesharecdn.com/ss_thumbnails/hacking-uncovered-how-people-get-hacked-and-how-to-stay-safe1-260130170011-4883a9c7-thumbnail.jpg?width=640&height=640&fit=bounds)


