Download as PDF, PPTX


![HELLEBORECAPITAL
Introduction
The standard methodology
Exploring dependence between returns
Copula-based dependence coefficients (clustering distances)
Empirical convergence rates
Beyond dependence: a (copula,margins) representation
Introduction
Goal: Finding groups of ’homogeneous’ assets that can help to:
• build alternative measures of risk,
• elaborate trading strategies. . .
But, we need a high confidence in these clusters (networks).
So, we need appropriate AND fast converging methodologies [8]:
to be consistent yet efficient (bias–variance tradeoff),
to avoid non-stationarity of the time series (too large sample).
A good model selection criterion:
Minimum sample size to reach a given ’accuracy’.
Gautier Marti Clustering CDS: algorithms, distances, stability and convergence r](https://image.slidesharecdn.com/cmstatistics2016-161206211027/85/Clustering-CDS-algorithms-distances-stability-and-convergence-rates-3-320.jpg)
![HELLEBORECAPITAL
Introduction
The standard methodology
Exploring dependence between returns
Copula-based dependence coefficients (clustering distances)
Empirical convergence rates
Beyond dependence: a (copula,margins) representation
The standard methodology - description
The methodology widely adopted in empirical studies: [7].
Let N be the number of assets.
Let Pi (t) be the price at time t of asset i, 1 ≤ i ≤ N.
Let ri (t) be the log-return at time t of asset i:
ri (t) = log Pi (t) − log Pi (t − 1).
For each pair i, j of assets, compute their correlation:
ρij =
ri rj − ri rj
( r2
i − ri
2) r2
j − rj
2
.
Convert the correlation coefficients ρij into distances:
dij = 2(1 − ρij ).
Gautier Marti Clustering CDS: algorithms, distances, stability and convergence r](https://image.slidesharecdn.com/cmstatistics2016-161206211027/85/Clustering-CDS-algorithms-distances-stability-and-convergence-rates-5-320.jpg)
![HELLEBORECAPITAL
Introduction
The standard methodology
Exploring dependence between returns
Copula-based dependence coefficients (clustering distances)
Empirical convergence rates
Beyond dependence: a (copula,margins) representation
The standard methodology - description
From all the distances dij , compute a minimum spanning tree:
Figure: A minimum spanning tree of stocks (from [1]); stocks from the
same industry (represented by color) tend to cluster together
Gautier Marti Clustering CDS: algorithms, distances, stability and convergence r](https://image.slidesharecdn.com/cmstatistics2016-161206211027/85/Clustering-CDS-algorithms-distances-stability-and-convergence-rates-6-320.jpg)
![HELLEBORECAPITAL
Introduction
The standard methodology
Exploring dependence between returns
Copula-based dependence coefficients (clustering distances)
Empirical convergence rates
Beyond dependence: a (copula,margins) representation
The standard methodology - limitations
• MST clustering equivalent to Single Linkage clustering:
• chaining phenomenon
• not stable to noise / small perturbations [11]
• Use of the Pearson correlation:
• can take value 0 whereas variables are strongly dependent
• not invariant to variable monotone transformations
• not robust to outliers
Is it still useful for financial time series? stocks? CDS??!
Gautier Marti Clustering CDS: algorithms, distances, stability and convergence r](https://image.slidesharecdn.com/cmstatistics2016-161206211027/85/Clustering-CDS-algorithms-distances-stability-and-convergence-rates-7-320.jpg)
![HELLEBORECAPITAL
Introduction
The standard methodology
Exploring dependence between returns
Copula-based dependence coefficients (clustering distances)
Empirical convergence rates
Beyond dependence: a (copula,margins) representation
The standard methodology - limitations
• MST clustering equivalent to Single Linkage clustering:
• chaining phenomenon
• not stable to noise / small perturbations [11]
• Use of the Pearson correlation:
• can take value 0 whereas variables are strongly dependent
• not invariant to variables monotone transformations
• not robust to outliers
Is it still useful for financial time series? stocks? CDS??!
Gautier Marti Clustering CDS: algorithms, distances, stability and convergence r](https://image.slidesharecdn.com/cmstatistics2016-161206211027/85/Clustering-CDS-algorithms-distances-stability-and-convergence-rates-8-320.jpg)
![HELLEBORECAPITAL
Introduction
The standard methodology
Exploring dependence between returns
Copula-based dependence coefficients (clustering distances)
Empirical convergence rates
Beyond dependence: a (copula,margins) representation
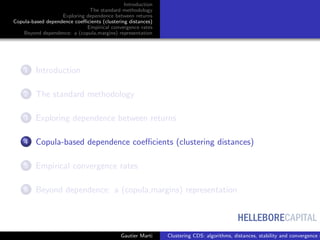
Copulas
Sklar’s Theorem [13]
For (Xi , Xj ) having continuous marginal cdfs FXi
, FXj
, its joint cumulative
distribution F is uniquely expressed as
F(Xi , Xj ) = C(FXi
(Xi ), FXj
(Xj )),
where C is known as the copula of (Xi , Xj ).
Copula’s uniform marginals jointly encode all the dependence.
Gautier Marti Clustering CDS: algorithms, distances, stability and convergence r](https://image.slidesharecdn.com/cmstatistics2016-161206211027/85/Clustering-CDS-algorithms-distances-stability-and-convergence-rates-10-320.jpg)
![HELLEBORECAPITAL
Introduction
The standard methodology
Exploring dependence between returns
Copula-based dependence coefficients (clustering distances)
Empirical convergence rates
Beyond dependence: a (copula,margins) representation
From ranks to empirical copula
ri , rj are the rank statistics of Xi , Xj respectively, i.e. rt
i is the rank
of Xt
i in {X1
i , . . . , XT
i }: rt
i = T
k=1 1{Xk
i ≤ Xt
i }.
Deheuvels’ empirical copula [3]
Any copula ˆC defined on the lattice L = {( ti
T ,
tj
T ) : ti , tj = 0, . . . , T} by
ˆC( ti
T ,
tj
T ) = 1
T
T
t=1 1{rt
i ≤ ti , rt
j ≤ tj } is an empirical copula.
ˆC is a consistent estimator of C with uniform convergence [4].
Gautier Marti Clustering CDS: algorithms, distances, stability and convergence r](https://image.slidesharecdn.com/cmstatistics2016-161206211027/85/Clustering-CDS-algorithms-distances-stability-and-convergence-rates-11-320.jpg)
![HELLEBORECAPITAL
Introduction
The standard methodology
Exploring dependence between returns
Copula-based dependence coefficients (clustering distances)
Empirical convergence rates
Beyond dependence: a (copula,margins) representation
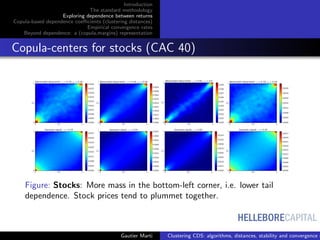
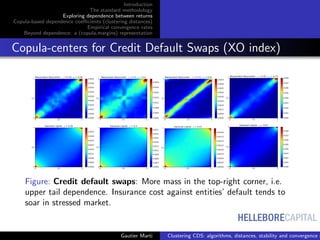
Clustering of bivariate empirical copulas
Generate the N
2 bivariate empirical copulas
Find clusters of copulas using optimal transport [10, 9]
Compute and display the clusters’ centroids [2]
Some code available at www.datagrapple.com/Tech.
Gautier Marti Clustering CDS: algorithms, distances, stability and convergence r](https://image.slidesharecdn.com/cmstatistics2016-161206211027/85/Clustering-CDS-algorithms-distances-stability-and-convergence-rates-12-320.jpg)
![HELLEBORECAPITAL
Introduction
The standard methodology
Exploring dependence between returns
Copula-based dependence coefficients (clustering distances)
Empirical convergence rates
Beyond dependence: a (copula,margins) representation
Dependence as relative distances between copulas
C copula of (Xi , Xj ),
|u − v|/
√
2 distance between (u, v) to the diagonal
Spearman’s ρS :
ρS (Xi , Xj ) = 12
1
0
1
0
(C(u, v) − uv)dudv
= 1 − 6
1
0
1
0
(u − v)2
dC(u, v)
Many correlation coefficients can be expressed as distances to the
Fr´echet–Hoeffding bounds or the independence [6]. Some are explicitely
built this way (e.g. [12, 5, 9]).
Gautier Marti Clustering CDS: algorithms, distances, stability and convergence r](https://image.slidesharecdn.com/cmstatistics2016-161206211027/85/Clustering-CDS-algorithms-distances-stability-and-convergence-rates-16-320.jpg)
![HELLEBORECAPITAL
Introduction
The standard methodology
Exploring dependence between returns
Copula-based dependence coefficients (clustering distances)
Empirical convergence rates
Beyond dependence: a (copula,margins) representation
Spearman vs. TFDC
0.0 0.2 0.4 0.6 0.8 1.0
discontinuity position a
0.0
0.2
0.4
0.6
0.8
1.0
Estimatedpositivedependence
Spearman & TFDC values as a function of a
TFDC
Spearman
Figure: Empirical copulas for (X, Y ) where
X = Z1{Z < a} + X 1{Z > a},
Y = Z1{Z < a + 0.25} + Y 1{Z > a + 0.25}, a = 0, 0.05, . . . , 0.95, 1,
and where Z is uniform on [0, 1] and X , Y are independent noises (left).
TFDC and Spearman coefficients estimated between X and Y as a
function of a (right).
For a = 0.75, Spearman coefficient yields a negative value, yet X = Y
over [0, a].
Gautier Marti Clustering CDS: algorithms, distances, stability and convergence r](https://image.slidesharecdn.com/cmstatistics2016-161206211027/85/Clustering-CDS-algorithms-distances-stability-and-convergence-rates-19-320.jpg)
![HELLEBORECAPITAL
Introduction
The standard methodology
Exploring dependence between returns
Copula-based dependence coefficients (clustering distances)
Empirical convergence rates
Beyond dependence: a (copula,margins) representation
Process: Recovering a simulated ground-truth [8]
A simulation & benchmark process that needs to be refined:
Extract (using a large sample) a filtered correlation matrix R
Gautier Marti Clustering CDS: algorithms, distances, stability and convergence r](https://image.slidesharecdn.com/cmstatistics2016-161206211027/85/Clustering-CDS-algorithms-distances-stability-and-convergence-rates-21-320.jpg)
![HELLEBORECAPITAL
Introduction
The standard methodology
Exploring dependence between returns
Copula-based dependence coefficients (clustering distances)
Empirical convergence rates
Beyond dependence: a (copula,margins) representation
Process: Recovering a simulated ground-truth [8]
A simulation & benchmark process that needs to be refined:
Generate samples of size T = 10, . . . , 20, . . . from a relevant
distribution (parameterized by R)
Gautier Marti Clustering CDS: algorithms, distances, stability and convergence r](https://image.slidesharecdn.com/cmstatistics2016-161206211027/85/Clustering-CDS-algorithms-distances-stability-and-convergence-rates-22-320.jpg)
![HELLEBORECAPITAL
Introduction
The standard methodology
Exploring dependence between returns
Copula-based dependence coefficients (clustering distances)
Empirical convergence rates
Beyond dependence: a (copula,margins) representation
Process: Recovering a simulated ground-truth [8]
A simulation & benchmark process that needs to be refined:
Compute the ratio of the number of correct clustering
obtained over the number of trials as a function of T
100 200 300 400 500
Sample size
0.0
0.2
0.4
0.6
0.8
1.0
Score
Empirical rates of convergence for Single Linkage
Gaussian - Pearson
Gaussian - Spearman
Student - Pearson
Student - Spearman
100 200 300 400 500
Sample size
0.0
0.2
0.4
0.6
0.8
1.0
Score
Empirical rates of convergence for Average Linkage
Gaussian - Pearson
Gaussian - Spearman
Student - Pearson
Student - Spearman
100 200 300 400 500
Sample size
0.0
0.2
0.4
0.6
0.8
1.0
Score
Empirical rates of convergence for Ward
Gaussian - Pearson
Gaussian - Spearman
Student - Pearson
Student - Spearman
A full comparative study will be posted online at www.datagrapple.com/Tech.
Gautier Marti Clustering CDS: algorithms, distances, stability and convergence r](https://image.slidesharecdn.com/cmstatistics2016-161206211027/85/Clustering-CDS-algorithms-distances-stability-and-convergence-rates-23-320.jpg)
![HELLEBORECAPITAL
Introduction
The standard methodology
Exploring dependence between returns
Copula-based dependence coefficients (clustering distances)
Empirical convergence rates
Beyond dependence: a (copula,margins) representation
ON CLUSTERING FINANCIAL TIME SERIES
GAUTIER MARTI, PHILIPPE DONNAT AND FRANK NIELSEN
NOISY CORRELATION MATRICES
Let X be the matrix storing the standardized re-
turns of N = 560 assets (credit default swaps)
over a period of T = 2500 trading days.
Then, the empirical correlation matrix of the re-
turns is
C =
1
T
XX .
We can compute the empirical density of its
eigenvalues
ρ(λ) =
1
N
dn(λ)
dλ
,
where n(λ) counts the number of eigenvalues of
C less than λ.
From random matrix theory, the Marchenko-
Pastur distribution gives the limit distribution as
N → ∞, T → ∞ and T/N fixed. It reads:
ρ(λ) =
T/N
2π
(λmax − λ)(λ − λmin)
λ
,
where λmax
min = 1 + N/T ± 2 N/T, and λ ∈
[λmin, λmax].
0.0 0.5 1.0 1.5 2.0 2.5 3.0 3.5 4.0
λ
0.0
0.2
0.4
0.6
0.8
1.0
1.2
1.4
1.6
1.8
ρ(λ)
Figure 1: Marchenko-Pastur density vs. empirical den-
sity of the correlation matrix eigenvalues
Notice that the Marchenko-Pastur density fits
well the empirical density meaning that most of
the information contained in the empirical corre-
lation matrix amounts to noise: only 26 eigenval-
ues are greater than λmax.
The highest eigenvalue corresponds to the ‘mar-
ket’, the 25 others can be associated to ‘industrial
sectors’.
CLUSTERING TIME SERIES
Given a correlation matrix of the returns,
0 100 200 300 400 500
0
100
200
300
400
500
Figure 2: An empirical and noisy correlation matrix
one can re-order assets using a hierarchical clus-
tering algorithm to make the hierarchical correla-
tion pattern blatant,
0 100 200 300 400 500
0
100
200
300
400
500
Figure 3: The same noisy correlation matrix re-ordered
by a hierarchical clustering algorithm
and finally filter the noise according to the corre-
lation pattern:
0 100 200 300 400 500
0
100
200
300
400
500
Figure 4: The resulting filtered correlation matrix
BEYOND CORRELATION
Sklar’s Theorem. For any random vector X = (X1, . . . , XN ) having continuous marginal cumulative
distribution functions Fi, its joint cumulative distribution F is uniquely expressed as
F(X1, . . . , XN ) = C(F1(X1), . . . , FN (XN )),
where C, the multivariate distribution of uniform marginals, is known as the copula of X.
Figure 5: ArcelorMittal and Société générale prices are projected on dependence ⊕ distribution space; notice their
heavy-tailed exponential distribution.
Let θ ∈ [0, 1]. Let (X, Y ) ∈ V2
. Let G = (GX, GY ), where GX and GY are respectively X and Y marginal
cdf. We define the following distance
d2
θ(X, Y ) = θd2
1(GX(X), GY (Y )) + (1 − θ)d2
0(GX, GY ),
where d2
1(GX(X), GY (Y )) = 3E[|GX(X) − GY (Y )|2
], and d2
0(GX, GY ) = 1
2 R
dGX
dλ − dGY
dλ
2
dλ.
CLUSTERING RESULTS & STABILITY
0 5 10 15 20 25 30
Standard Deviation in basis points
0
5
10
15
20
25
30
35
Numberofoccurrences
Standard Deviations Histogram
Figure 6: (Top) The returns correlation structure ap-
pears more clearly using rank correlation; (Bottom)
Clusters of returns distributions can be partly described
by the returns volatility
Figure 7: Stability test on Odd/Even trading days sub-
sampling: our approach (GNPR) yields more stable
clusters with respect to this perturbation than standard
approaches (using Pearson correlation or L2 distances).
Gautier Marti Clustering CDS: algorithms, distances, stability and convergence r](https://image.slidesharecdn.com/cmstatistics2016-161206211027/85/Clustering-CDS-algorithms-distances-stability-and-convergence-rates-25-320.jpg)


This document presents a methodology for exploring dependence between asset returns using copula-based dependence coefficients and clustering techniques. It elaborates on the advantages and limitations of minimum spanning tree clustering, the importance of stable methodologies, and the use of empirical copulas for clustering financial assets. Additionally, it outlines a process for refining simulations to assess clustering accuracy based on varying sample sizes.