The document discusses constructing statistical graphs and charts to represent variables related to access to water. It provides examples of bar graphs and pie charts using sample data on water quality received by households. A bar graph is created showing that 50% receive clear water, 37.5% receive turbid water, and 12.5% receive other colored water. A pie chart also represents this data visually. Interpretations are made that half the community has access to good quality water while the other half may experience health issues due to water quality.
Good Stuff Happens in 1:1 Meetings: Why you need them and how to do them well
1° gráficos estadísticos (1)
1. I.E.P. “San Martín de Porres” 1° - 2021
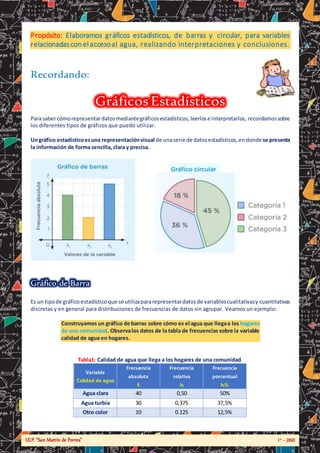
Propósito: Elaboramos gráficos estadísticos, de barras y circular, para variables
relacionadascon elaccesoal agua, realizando interpretaciones y conclusiones.
Recordando:
Gráficos Estadísticos
Parasabercómorepresentardatosmediantegráficosestadísticos,leerlose interpretarlos, recordamossobre
los diferentes tipos de gráficos que puedo utilizar.
Ungráfico estadísticoesuna representaciónvisual de unaserie de datosestadísticos,endonde se presenta
la información de forma sencilla, clara y precisa.
Gráfico de Barra
Es un tipode gráficoestadísticoque se utilizapararepresentardatosde variablescualitativasy cuantitativas
discretas y en general para distribuciones de frecuencias de datos sin agrupar. Veamos un ejemplo:
Construyamos un gráfico de barras sobre cómo es el agua que llegaa los hogares
de una comunidad. Observalos datos de la tabla de frecuencias sobre la variable
calidad de agua en hogares.
Tabla1: Calidad de agua que llega a los hogares de una comunidad.
Variable
Calidad de agua
Frecuencia
absoluta
fi
Frecuencia
relativa
hi
Frecuencia
porcentual
hi%
Agua clara 40 0,50 50%
Agua turbia 30 0,375 37,5%
Otro color 10 0.125 12,5%
2. I.E.P. “San Martín de Porres” 1° - 2021
Total 80 1 100%
Veamos:(coloca aquí tu grafico de barras trabajado en tu cuaderno)
3. I.E.P. “San Martín de Porres” 1° - 2021
.
INTERPRETACIONES
Se observaenel gráficoque el 50% de la comunidad,respondieronque ensu hogarle llegaagua clara.
El 37,5% respondieron que en su hogar le llega agua turbia.
El 12,5% respondieron que en su hogar le llega agua de otro color.
Gráfico Circular
El gráfico circularo de torta, como tambiénse le conoce,representalatotalidadque se quiere observar,es
decir, un todo. Cada sector circular o porción de la torta representa la proporción de cada categoría de la
variable respecto al total. Se emplea fundamentalmente para variables cualitativas, especialmente cuando
las frecuencias están expresadas en porcentajes. Siempre va acompañado de una leyenda.
Para la obtenciónde losángulosde cada sectorse utilizanlasiguiente fórmula,que
únicamente expresan la proporcionalidad entre el ángulo y la frecuencia:
Veamos:
Tabla1: Calidad de agua que llega a los hogares de una comunidad.
Variable
Calidad de agua
Frecuencia
absoluta
fi
Frecuencia
relativa
hi
Frecuencia
porcentual
hi%
Angulo del sector
circular
Agua clara 40 0,50 50% ∝=
360°
80
𝑥40 = 180°
Agua turbia 30 0,375 37,5% ∝=
360°
80
𝑥30 = 135°
Otro color 10 0.125 12,5% ∝=
360°
80
𝑥10 = 45°
Total 80 1 100% 360°
4. I.E.P. “San Martín de Porres” 1° - 2021
Veamos:(coloca aquí tu grafico de barras trabajado en tu cuaderno)
INTERPRETACIONES
Se observaenel gráficoque el 50% de la comunidad,respondieronque ensuhogarle llegaagua clara.
El 37,5% respondieron que en su hogar le llega agua turbia.
El 12,5% respondieron que en su hogar le llega agua de otro color.
CONCLUSIONES
La mitad de los pobladores encuestados si están accediendo a una buena calidad de agua.
La mitad de los pobladores encuestados no están accediendo a una buena calidad de agua, por tal
motivo, podrían registrar diversas enfermedades.
50%
37,5%
5. I.E.P. “San Martín de Porres” 1° - 2021
Me Evalúo
Es el momento de autoevaluarnos para reconocer nuestros avances y lo que necesitamos
mejorar. Coloca una “” de acuerdo con lo que consideres. Luego, escribe las acciones
que tomarás para mejorar tu aprendizaje
Competencia:
Resuelve problemas de gestión de datos e incertidumbre.
Criterios de evaluación Lo logré
Estoy en
proceso de
lograrlo
¿Qué puedo
hacer para
mejorar mis
aprendizajes?
Representé los datos a través de gráficos estadísticos
pertinentes.
Leí e interpreté gráficos estadísticos para obtener
información.
Propuse conclusiones sobre el acceso al servicio
de agua con base en la información recogida.